CONTOURGLOBAL DEUTSCHE BANK EUROPEAN LEVERAGED FINANCE CONFERENCE JUNE 2019

Page created by Philip Blair
 
CONTINUE READING
CONTOURGLOBAL DEUTSCHE BANK EUROPEAN LEVERAGED FINANCE CONFERENCE JUNE 2019
ContourGlobal
Deutsche Bank European Leveraged Finance
Conference
June 2019
CONTOURGLOBAL DEUTSCHE BANK EUROPEAN LEVERAGED FINANCE CONFERENCE JUNE 2019
Disclaimer

The information contained in these materials has been provided by ContourGlobal plc (the “Company”) and has not been independently verified. No
representation or warranty, express or implied, is made as to, and no reliance should be placed on, the fairness, accuracy, completeness or correctness of the
information or opinions contained herein. It is not the Company’s intention to provide, and you may not rely on these materials as providing, a complete or
comprehensive analysis of the Company’s financial position or prospects. The information and opinions contained in these materials are provided as at the date of
this presentation and are subject to change without notice. Neither the Company nor any of its affiliates, advisors or representatives shall have any liability
whatsoever (in negligence or otherwise) for any loss whatsoever arising from any use of this presentation or its contents or otherwise arising in connection with
this presentation.

Certain statements in this presentation are “forward-looking statements.” All statements other than statements of historical facts included in this presentation,
including, without limitation, those regarding the Company’s financial position, business strategy, plans and objectives of management for future operations, are
forward-looking statements. These statements involve a number of factors that could cause actual results to differ materially, including, but not limited to, changes
in economic, business, social, political and market conditions, success of business and operating initiatives, and changes in the legal and regulatory environment
and other government actions. Forward-looking statements contained in this presentation regarding past trends or activities should not be taken as a
representation that such trends or activities will continue in the future. Any forward-looking statement made during this presentation or in these materials speaks
only as of the date on which it is made. The Company assumes no obligation to update or revise any forward-looking statements.

Information contained herein relating to markets, market size, market share, market position, growth rates, penetration rates and other industry data pertaining to
the Company’s business is based on the Company’s estimates and is provided solely for illustrative purposes. In many cases, there is no readily available external
information to validate market-related analyses and estimates, thus requiring the Company to rely on internal surveys and studies. The Company has also
compiled, extracted and reproduced market or other industry data from external sources, including third parties or industry or general publications, for the
purposes of its internal surveys and studies. Any such information may be subject to significant uncertainty due to differing definitions of the relevant markets and
market segments described.

This presentation contains references to certain non-IFRS financial measures and operating measures. These supplemental measures should not be viewed in
isolation or as alternatives to measures of the Company’s financial condition, results of operations or cash flows as presented in accordance with IFRS in its
consolidated financial statements. The non-IFRS financial and operating measures used by the Company may differ from, and not be comparable to, similarly titled
measures used by other companies. The non-IFRS adjustments for all periods presented are based upon information and assumptions available as of the date of
this presentation.

                                                                                                                                                                        2
CONTOURGLOBAL DEUTSCHE BANK EUROPEAN LEVERAGED FINANCE CONFERENCE JUNE 2019
Contents

 1. Financial Snapshot and Business Highlights

 2. 2018 Operational and Financial Performance

                                                 3
CONTOURGLOBAL DEUTSCHE BANK EUROPEAN LEVERAGED FINANCE CONFERENCE JUNE 2019
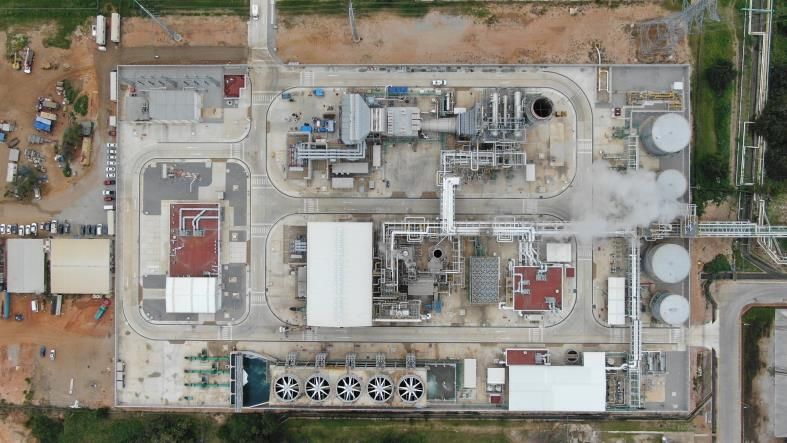
2018 Financial and Credit Snapshot
High value growth with credit metrics consistent with S&P positive outlook

                    2018 Key Financial Metrics                                                                                          Adj. EBITDA Growth
Adj.
                                $610m             +19% growth vs. 2017A                                       Significant M&A and development pipeline
EBITDA                                                                                                        with ~1.0 GW of advanced stage
                                                                                                              opportunities
Prop. Adj.
EBITDA
                                $536m              +23% growth vs 2017A

                                                                                                                                                                    150
FFO                             $302m             +18% growth vs. 2017A                                                                 2014-2018
                                                                                                                                        CAGR 19%
                                                         >5-6x Credit Rating
DSCR                            6.1x2                    Upgrade Threshold
                                                                                                                                                                    610
HoldCo Net                      2.2x3            +18% growth vs.leverage
                                                                  2017A
                                                                                                                                                          513
                                                    Sustainable                                                                             440
Leverage                                                                                                        305              331
Net Debt/
Adj. EBITDA
                                4.4x1                         4.0x-4.5x target
                                                                                                               2014              2015       2016         2017       2018    2022
                                                                                                                                                                           Target
(1) Includes full year earnings of Spanish CSP, which was acquired in May 2018 (+$40m of Adjusted EBITDA based on FY earnings)                      Run-rate 2018 EBITDA
(2) CFADS as defined in Bond Indenture post cash overhead at the corporate level divided by corporate bond interest
(3) Net corporate debt divided by CFADS plus distributions from Solar Italy farm down

                                                                                                                                                                                    4
CONTOURGLOBAL DEUTSCHE BANK EUROPEAN LEVERAGED FINANCE CONFERENCE JUNE 2019
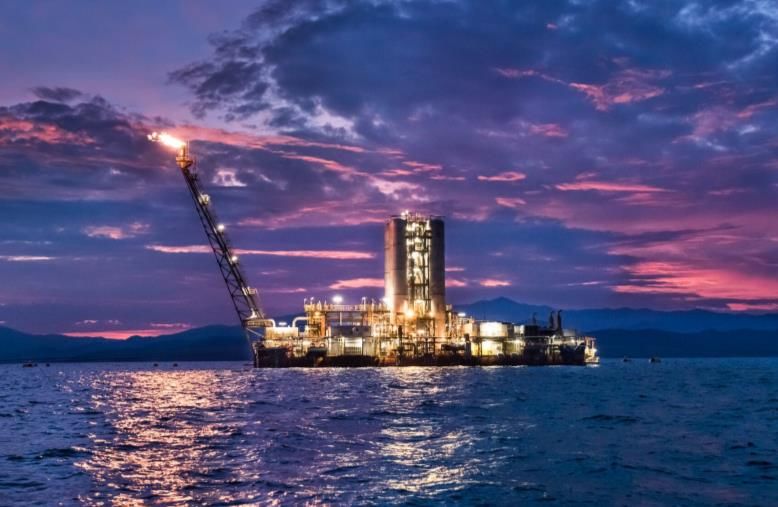
ContourGlobal Footprint
Global platform of pure contracted power generation with strong expertise

Business Highlights                                                        ContourGlobal
                                                                            ContourGlobalFootprint – 4.8
                                                                                           Footprint     GWGW
                                                                                                      – 4.8 in 19
                                                                                                                inCountries
                                                                                                                   19 countries 1

    • Long term contracts and regulated tariffs
      delivering stable and secure cash flows

    • Diversified footprint by geography and
      technology: all assets less than 20% group
      EBITDA

    • Proven track record of value accretive
      growth through both operationally lead
      acquisitions and greenfield development

    • Modest Leverage: use of non-recourse debt
      financing provides significant protection to
      equity investor

    • High cash flow conversion: underlying assets
                                                                              Portfolio
      distributing +$275m cash per year to parent
                                                                                  Thermal          Solar   High Efficiency Cogen
                                                                                  Wind             Hydro   Biogas

               1) Figures (GW and number of countries) include 518 MW Mexican Cogeneration acquisition
               signed January 2019                                                                                                  5
CONTOURGLOBAL DEUTSCHE BANK EUROPEAN LEVERAGED FINANCE CONFERENCE JUNE 2019
We Invest in High-Quality and Stable Businesses
Businesses operate with fixed-price, long-term contracts or regulation, with credit worthy
off-takers. This structure provides risk mitigation and sets ContourGlobal apart in the sector.

    Limited      ✓ Long-term contracts typically with state-owned or supported utilities or large investment grade
   Credit Risk     companies, or stable regulatory regimes (avg. credit rating BBB-)

   Limited
   Duration      ✓ Long-term contracts, weighted average remaining contract life of 12 years
     Risk

       No
                 ✓ Fixed-price contracts that typically contain inflation pass-through terms
   Price Risk

     No          ✓ Typical Thermal PPAs virtually eliminate commodity risk via fuel and CO2 emissions costs pass-
   Cost Risk       through mechanisms

   Negligible    Contract Structure Differs between technologies
   Revenue /     ✓ Thermal: No volume risk; plants paid full capacity payment irrespective of off-taker demand
  Volume Risk    ✓ Renewables: Plants typically paid set price based on MWh produced

                                                                                                                 6
CONTOURGLOBAL DEUTSCHE BANK EUROPEAN LEVERAGED FINANCE CONFERENCE JUNE 2019
Diversified: technology, geography and currency
Our business model and strongly diversified asset base lead to resilient financial
performance

      FY 2018 PF Adj. EBITDA1 by Technology                        FY 2018 PF Adj. EBITDA by Geography                           FY 2018 PF Adj. EBITDA by Currency

                                                                                                                                               5% 2%

                                                                                                                                              8%
                                       38%                                    37%
                 45%
                                                                                                   53%                                   30%                    55%

                                                                                  10%
                               17%

      Thermal    High Efficiency Cogen       Renewable                   Europe           Africa         Latam                EUR       USD      BRL      BRL Hedged         Other

                                                      Financial performance is highly resilient to external factors

           100%                           99%                           98%                           97%                           100%                         100%

          FY 2018              10% change in electricity     10% depreciation of BRL 10% change in renewables 10% change in fuel prices 10% change in CO2 prices
                                     spot prices                                            resource

 1.    FY 2018 Pro Forma Adj EBITDA = actual EBITDA for FY 2018 + pro forma adjustment for a full year contribution from our Spanish CSP assets + pro forma adjustment for
       expected run-rate annual contribution from our Mexican CHP assets ($110 million; signed but not closed yet)

                                                                                                                                                                                     7
CONTOURGLOBAL DEUTSCHE BANK EUROPEAN LEVERAGED FINANCE CONFERENCE JUNE 2019
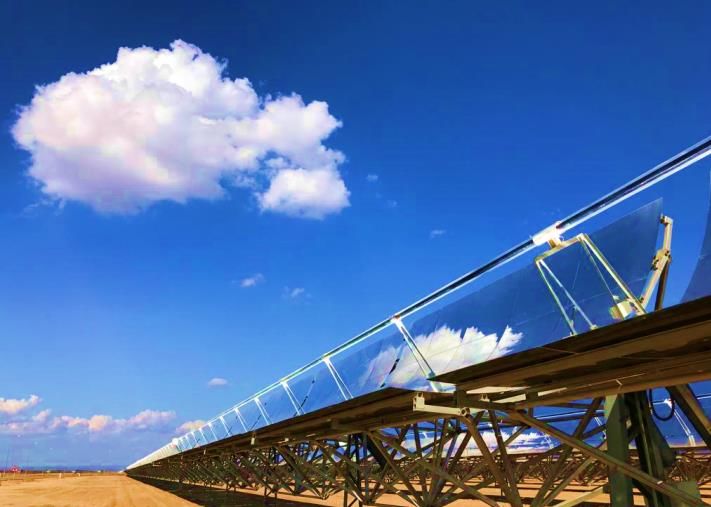
Improving cost structure while increasing operational
performance
 Track-record of creating value in acquisitions through operational improvement

                                         Value lever                                  ContourGlobal Operations Way Philosophy
                                                         Other Operational         Performance of Operational-Led Acquisitions reflects
                  Fixed Cost Reduction    Availability
                                                          Improvements              the value of CG Operational Structure and program
    Maritsa
                                                                  €2m fuel     •       Fixed cost reductions achieved in conjunction
    908MW
 Lignite Plant
                   ✓           26%       ✓          2%   ✓         savings             with increased performance
                                                                               •       Long-term owner / operator business model
   Arrubal                                                      Insourced              ensures we maintain control of processes and
   800MW
Gas-Fired Plant
                   ✓          22%        ✓          2%   ✓     Operations;
                                                                  Zero LTI     •
                                                                                       costs
                                                                                       No inefficient outsourcing, offers greater
                                                                                       potential synergies across region
 Austria Wind
   150 MW
  Wind Farm
                   ✓          20%        ✓          2%   ✓     Repowering      •       Accountability with continuous operational
                                                                                       benchmarking to best-in-class
                                                                               •       Zero-based Organizational Design: low fixed
   Solar Italy                                                       O&M               costs, enhanced transparency and
    65MW
Solar PV Assets
                   ✓           32%       ✓          1%   ✓       insourced             communication
                                                                               •       Timely Transparency: Real time course
   Bonaire                                                                             correction through widely accessible data
                                                                   Zero LTIs
   28MW
 Wind & HFO
                   ✓           16%       ✓          3%   ✓       since 2015
                                                                                       systems; global network with full integration of
                                                                                       all plants and people.

                                                                                                                                          8
CONTOURGLOBAL DEUTSCHE BANK EUROPEAN LEVERAGED FINANCE CONFERENCE JUNE 2019
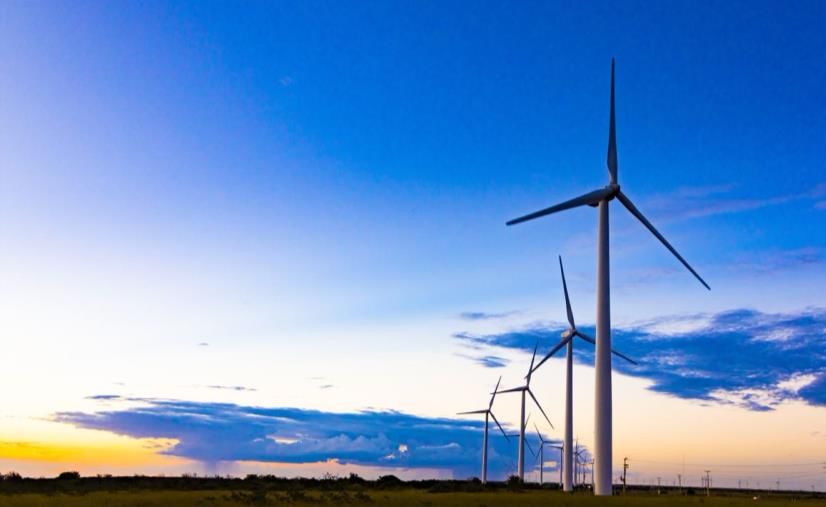
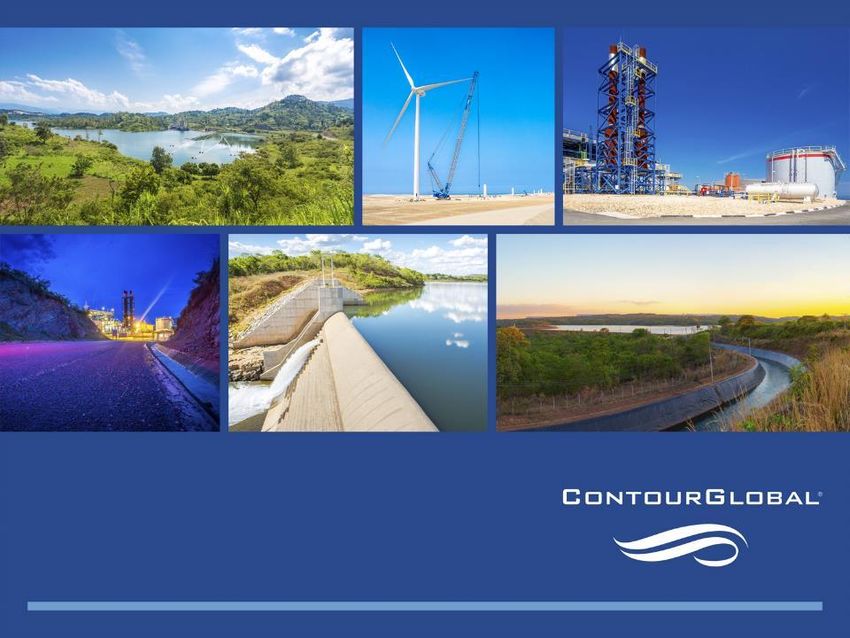
Growth - Mexican Cogeneration Business Acquisition
Signed in Jan 2019 on Track for COD and Close in Q3 2019

 Transaction Highlights and Update:

• Acquisition of natural-gas fired combined heat & power assets for
  518MW of operational capacity at completion, potential for a
  further 414MW in development

• Commissioning of 414 MW CGA 1 plant progressing with COD
  expected in Q3 2019.

• Successful COD condition precedent to transaction close. Alpek                         Overview of Assets
  remains with construction risks

• Estimated Adj. EBITDA of $110m in first full year of operations     CGA I: 414 MW Plant under commission

• Acquisition value was of $724 million paid in cash, with an
  additional payment at closing estimated at $77m of VAT
  (refundable in full within 12 months)

• $590m project financing underwritten by Scotiabank

• On track for 90% contracted revenues at transaction close

                                                                                                         9
CONTOURGLOBAL DEUTSCHE BANK EUROPEAN LEVERAGED FINANCE CONFERENCE JUNE 2019
Contents

 1. Financial Snapshot and Business Highlights

 2. 2018 Operational and Financial Performance

                                                 10
Industry Leading Health & Safety Performance
‘Achieving Target Zero’ is one of ContourGlobal’s Key Priorities

Leading the Sector in Health and Safety Performance1
 • To provide a safe working place for employees, contractors and sub-contractors is also part of
   operational excellence and is reflected in the company “Target Zero” (zero harm, zero injuries)
   and driven by a culture of continuous improvement.
 • As a result, ContourGlobal has become an industry leader in Health and Safety performance as
   demonstrated by benchmark lost-time incident rates (“LTI” rates)
  L T I R (1) - P E E R S (2) V S C G

             LTIR 2018                                                                                                                            0.90
             LTIR 2017
             Selected Peers Top Quartile = 0.20 (3)                                                                                        0.68
             US Utilities Average = 0.6 (4)
                                                                                                                                    0.54
                                                                                                                     0.49 0.50
                                                                                        0.36 0.38 0.38 0.38
                                                                          0.27 0.27
                              0.17 0.18 0.18 0.18 0.19 0.20

                0.00 0.03

                                                                                                                                                                                         Inka Wind Farm, Peru
(1) Lost Time Injury Rate (LTIR) is an industry standard reporting convention for calculating injuries in the workplace. LTIR measures recordable lost time incident (LTI) rates on the basis of 200,000 working
hours (2) Source: peers’ data from 2018/2017 annual reports/sustainability reports published by companies normalized to basis of 200,000 working hours (3) selection of comparable peers from study
performed by black&veatch with all major players in the us power generation sector and european companies (4) based on the 2017 report for days away from work cases - injuries and illnesses from the
bureau of labor statistics

                                                                                                                                                                                                                   11
Divisional Operating Performance
Consistent delivery of strong operational performance

    Thermal – Equivalent Availability Factor1 (%)                                                                  Wind – Equivalent Availability Factor1 (%)

                                                                                 74% weighted
                                                                                 average PPA
       93.0%                      92.6%                            90.2%         minimum                           96.1%                             92.7%                 95.8%
                                                                                 availability
                                                                                 requirement

        2016                       2017                             2018                                            2016                              2017                  2018
• Significant room between availability and average minimum                                             • Significant improvement in Brazil Wind operations driving
  PPA requirements                                                                                        improvement in wind EAF

      Hydro – Equivalent Availability Factor1 (%)                                                                   Solar – Equivalent Availability Factor1 (%)

       92.3%                     97.8%                             98.5%                                  99.5%                             99.2%                      99.2% 95.3%

       2016                       2017                             2018                                          2016                              2017                   2018
                                                                                                                                     Solar PV              Solar CSP
• Further improvement in already excellent hydro availability;                                          • 99%+ solar PV availability; integration and maintenance at CSP
  plants primarily rewarded on capacity or regulatory payments                                            plants acquired in May 2018
  as opposed to individual plant generation

                   (1) Equivalent Availability factor refers to the actual amount of time a plant or group of plants is available to produce electricity                             12
Robust Financial Performance
Significant growth in Adjusted EBITDA, Proportionate Adjusted EBITDA and FFO

              Adjusted EBITDA1                                          Proportionate Adjusted EBITDA                FFO1
                    ($m)                                                            ($m)                             ($m)

           +27%2                          650 3                                   +33%2                     +29%2
                                                                                                576 3
                                                                                                                            330³

                                          610
              513                                                                               536
                                                                                                                            302
                                                                                     434                      256

              2017                       2018                                        2017       2018          2017          2018

                                               2018 Adj. EBITDA of $610m within the guidance range of $600-630m

(1)   Adjusted EBITDA and FFO are non-IFRS measures as defined in IPO Prospectus
(2)   Growth calculated between 2017 and 2018 including full year contribution of Spanish CSP
(3)   Pro forma numbers: Adjusted to reflect full year contribution of Spanish CSP.

                                                                                                                                   13
Significant recurring cash generation and resilient credit
metrics
     Significant cash flow vs existing debt service and dividend commitments, results in
               $120m+ recurring cash flow available for business reinvestment

Asset level                                                                                                             Significant recurring cash flow
                                                                                                                        after debt service from asset to
                                                                                                                                corporate level…

Corporate level
 Distributions to Corporate                     Cash overhead at                               Corporate                             Cash available for investment
            Level:                              Corporate Level:                              Bond Interest                                 and dividends:
         $275m1                                      ($32m)                                   Costs: ($34m)                                    $210m

Key Debt Metrics                                                                                                               …results in consistently high
Net Debt/EBITDA: 4.4x                                                                                                          corporate interest cover and
DSCR: 6.1x (7.3x including distributions from Solar Italy farm down)2                                                                sustainable corporate
Net Corporate Leverage: 2.2x3                                                                                                                      leverage
               (1) Including Solar Italy farm down proceeds of $40m
               (2) CFADS as defined in Bond Indenture post cash overhead at the corporate level divided by corporate bond interest                                   14
               (3) Net corporate debt divided by CFADS plus distributions from Solar Italy farm down
Ample Cash Resources to Support Debt Service at
Corporate Level and Future Growth
• $2.9bn Net Debt as of December 31, 2018
• Committed to high value growth while maintaining strong BB credit ratings
• $414m liquidity at parent level, including $337m of cash and $77m undrawn capacity under our corporate level revolver. This
  is excluding the proceeds of the CSP farm down announced in December 2018 and expected to close in Q2 2019 (€134m)

Dec-18 NET DEBT – ($m)                                            Dec-18 LIQUIDITY – ($m)

                     865                                                                                               774
                                                                                                       77
                                                                                       337
                                               2,863
      2,695
                                 (697)

                                                                        360

   Project Debt Corporate Debt    Cash      Net Debt Dec-            Asset Level   HoldCo Level Revolving Credit Total Liquidity
                                              18 (IFRS)                 Cash           Cash         Facility        Dec-18

                                                                                                                                   15
Eurobond Refinancing in 2018
Average debt maturity extended to almost 10 years, weighted average cost reduced,
corporate debt term extended1
Weighted average outstanding life of debt (years)                                                         Weighted average cost of debt (%)
                                                                    9.9
                        8.3                                                                                                4.8%                              4.5%

                       2017                                        2018                                                    2017                              2018

 Adj. IFRS Net Debt / Adj. EBITDA1, 2                                                                     Debt Service Coverage Ratio4

        5.4x                                                                                                               9.2x
                                                                                                    500                                                                                  9.5
                               4.6x                                            4.4x 3                                                                         6.8x
                                                       4.1x                                         400     6.3x                                                          6.1x           7.5
                                                                                                                          301         5.7x       5.6x
                                                                                                                                                             291
                                                                                                    300                              237        232                                      5.5
                                                                                                           202                                                           203
                                                                                                    200                                                                                  3.5

                                                                                                    100          32             33         41         41           43          34        1.5

                                                                                                      -                                                                                  (0.5
       2015                    2016                    2017                   2018                         Jun-16         Dec-16     Jun-17     Dec-17       Jun-18      Dec-18
(1) Adjusted Net Debt and Adjusted EBITDA are non-IFRS measures
(2) ContourGlobal share of Net Debt at TermoemCali and Sochagota considered                                        CFADS (LTM)                         Annualized Debt Service
(3) Net Leverage Ratio includes full year earnings of Spanish CSP, which was acquired in May 2018
    (+$40m of Adjusted EBITDA based on FY earnings)                                                                DSCR                                Incurrence Level (2x min)
(4) Ccalculation as stated in the bond documentation

                                                                                                                                                                                    16
Appendices

Sao Domingos II Hydro Power Plant (Brazil)
Successful Integration of New Assets Drives Growth
Adjusted EBITDA bridges

ADJUSTED EBITDA – THERMAL DIVISION ($m)                                                                                                                                                 2%
                                                                                                                                                                                      decrease
                                                                                                                                          12
                                                       (10)                                     (6)

                 332                       Change in revenue                             One-off reversal of bad debt provision                                                327
                                        recognition standard and                                        in 2017
                                             policy (IFRS15)

        Adj. EBITDA 2017 1                            Maritsa                           French Caribbean                    FX Impact and Other                       Adj. EBITDA 2018
                                                                                                                                                                                           1
ADJUSTED EBITDA – RENEWABLE DIVISION ($m)                                                                             Spanish CSP, Solar Italy and                                       53%
                                                                                                                         Biogas, Hydro Brazil2
                                                                                                                                                                                       increase
  Better EAF in Brazil Wind
                                                                                                           104                                                                       309
                                                                                                                                    21
                                                                                                                                                            (7)
          202                      10
                                                                                    2
                                                         (23)
                                                                                                                                            Cash gain on 49%
                                                                 ($20m) in Brazil Wind and ($3.5m) in                                    divestment of Solar Italy
                                                                Austria wind slightly offset by Peru Wind                                and Slovakia portfolios3

 Adj. EBITDA 20171 Wind availability Wind resource                         Other Organic              Acquisitions           Farm-downs             FX Impact and Adj. EBITDA 2018
                                                                                                                                                        Other
                                                                                                                                                                                               1
(1)   Before Corporate Costs. 2017 Renewable EBITDA adjusted for reallocation between Renewable HoldCos and Corporate Overhead of approx. $9m
(2)   Spanish CSP Acquisition closed on May 10th 2018. Solar Italy and Biogas portfolio closed on December 4th, 2017 and March 22nd, 2018. Hydro Brazil closed on March 17th, 2017
(3)   Solar Italy and Slovakia farm downs closed on October 17th, 2018

                                                                                                                                                                                                   18
Top Contributors to Adj. EBITDA

 Top Contributors to Adj. EBITDA1                                                                 2016   2017   2018
 Top contributors from Thermal fleet
 Maritsa East III                                                                                  117    125    120
 Arrubal                                                                                            62     61     63
                                  2
 ContourGlobal Solutions                                                                            12     27     27
 Cap des Biches                                                                                     12     26     27
 KivuWatt                                                                                           22     24     26
 Togo                                                                                               21     25     25
 Caribbean                                                                                          21     27     24
 Colombia                                                                                           21     22     21
 Others                                                                                            (0)      2      1
 Top contributors from Renewable fleet
 Spanish CSP                                                                                         –      –     89
 Brazil Wind                                                                                        79     82     59
 Brazil Hydro                                                                                        9     28     41
 Peru Wind                                                                                          31     25     29
 Vorotan                                                                                            22     23     23
 Austria Wind                                                                                       23     25     20
 Solar Europe, excl. CSP3                                                                           31     31     41
 Total                                                                                             485    553    638

(1)   EBITDA is calculated by asset excluding corporate costs and thermal and renewable holdcos
(2)   Includes Solutions Europe and Africa and Solutions Brazil
(3)   Includes Solar Italy, Solar Slovakia and Solar Romania

                                                                                                                  19
Top Contributors to CFADS1

 Top Contributors to CFADS (Before Corporate and Other Costs)1                                 2016       2017   2018
 Maritsa                                                                                        118         30     65
 Solar Europe excl. CSP2                                                                         22         55     38
 Spanish CSP                                                                                      –          –     35
 Arrubal                                                                                         19         28     18
 Cap des Biches                                                                                   –          7     17
                                  3
 ContourGlobal Solutions                                                                         28         41     15
 Peru Wind                                                                                       23          5     15
 Brazil Hydros                                                                                  (1)         55     14
                                                                                                      4
 Vorotan                                                                                        111         13      9
 Togo                                                                                             6          6      7
 Caribbean                                                                                       10          9      5
 Austria Wind                                                                                     7          8      4
 KivuWatt                                                                                         –          –      4
 Colombia                                                                                         4          8      4
 Brazil Wind                                                                                      2          5    (0)
 Total before Corporate, Thermal and
                                                                                                349        270    249
 Renewable HoldCo costs

(1)   CFADS (Cash Flows Available for (Corporate) Debt Service) as defined in Bond Indenture
(2)   Includes Solar Italy, Solar Slovakia and Solar Romania
(3)   Includes Solutions Europe and Africa and Solutions Brazil
(4)   $84m second instalment of acquisition payment not deducted from CFADS

                                                                                                                   20
For further information please visit www.contourglobal.com
You can also read