INVESTOR PRESENTATION - SECOND QUARTER 2019 - Kimco Investor Relations
←
→
Page content transcription
If your browser does not render page correctly, please read the page content below
INVESTOR PRESENTATION
SECOND QUARTER 2019
SAFE HARBOR
                                                                         The statements in this presentation, including targets and assumptions, state
                                                                         the Company’s and management’s hopes, intentions, beliefs, expectations or
                                                                         projections of the future and are forward-looking statements. It is important to
                                                                         note that the Company’s actual results could differ materially from those
                                                                         projected in such forward-looking statements. Factors that could cause actual
                                                                         results to differ materially from current expectations include the key
                                                                         assumptions contained within this presentation, general economic conditions,
                                                                         local real estate conditions, increases in interest rates, foreign currency
                                                                         exchange rates, increases in operating costs and real estate taxes. Additional
                                                                         information concerning factors that could cause actual results to differ
                                                                         materially from those forward-looking statements is contained from time to
                                                                         time in the Company’s SEC filings, including but not limited to the Company’s
                                                                         Annual Report on Form 10-K. Copies of each filing may be obtained from
                                                                         http://investors.kimcorealty.com/ or the SEC.

Cover: Lincoln Square, Philadelphia, PA   Suburban Square, Ardmore, PA
KIMCO’S 2020 VISION

                         High-quality assets, tightly clustered in major metro markets
 PORTFOLIO QUALITY       that provide multiple growth levers

                         Increase net asset value (NAV) through redevelopment, select
    NAV CREATION         ground-up development and active investment management

FINANCIAL STRENGTH       Maintain a strong balance sheet and financial flexibility

                                                                                     3
REITS AND KIMCO TODAY

             Suburban Square, Ardmore, PA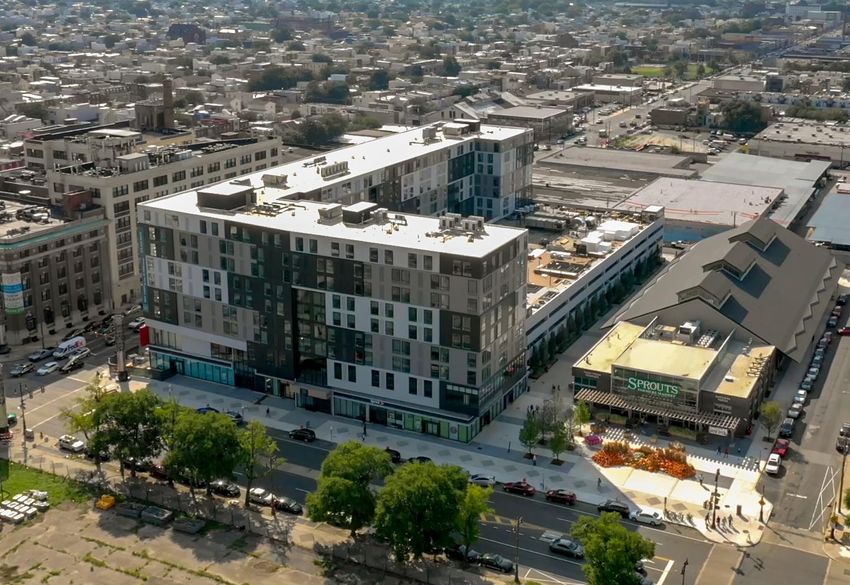
REITS AND KIMCO TODAY
                Kimco is Positioned for Success as Retail Transforms

Consumer Preference Profile:                    Kimco Asset Profile:
   Instant need for every day goods             ✓ 77% of ABR comes from grocery anchored centers

   In-person services                           ✓ 63% of ABR from small shops is from service based tenants

   Experiences in a social environment          ✓ 58% of ABR comes from Service & Experiential Tenants

   Technology to ease pain points of shopping   ✓ 38% of ABR comes from Omni-Channel Players

   Convenient location                          ✓ 81% of ABR comes from top Major Metro Markets

                                                                              ABR is defined as Annual Base Rent   5
REITS AND KIMCO TODAY
Net Store Openings Weighing in Favor of Shopping Center Tenants

               Over 6,000 Net New
             Store Openings in 2019*

                                       ”                    *Creditntell; June 2019   6
REITS AND KIMCO TODAY
      Buy Online Pick-up In Store (BOPIS) Exemplifies Successful Omni-channel Retailing

               Less Costly                                                More Convenient                                                                 More Sustainable
           for Retailers and Consumers

  Eliminate “last mile delivery” costs                                  Consumers prefer to return                                                            Decrease in returns
    which account for 53%  of shipping costs1                            items to a physical store,
    Target reduces costs by 40% using store                          regardless of free shipping/return offers3
    fulfillment; 90% for same-day offerings2                                                                                                                Increase in purchases
                                                             Inventory in any location can be sold to a
                                                            consumer in any location, digital or physical                                                    Lower shipping costs
   Brick & Mortar locations double
                                                                thanks to Single view inventory and store-to-store
     as local distribution centers                                             shipping capabilities
                                                                                                                                                          Increase in transactions

Reduced returns & additional purchases                                55% of online shoppers prefer
            made while at the store                                   retailers with a physical store
                                                                             over an online-only vendor4

                                1.   https://www.businessinsider.com/last-mile-delivery-shipping-explained, May 10, 2018   3.   UPS Global Study
                                2.   Target 1Q19 Earnings Call Transcript; May 2019                                        4.   https://retailnext.net/en/blog/brick-and-mortar-vs-online-retail/   7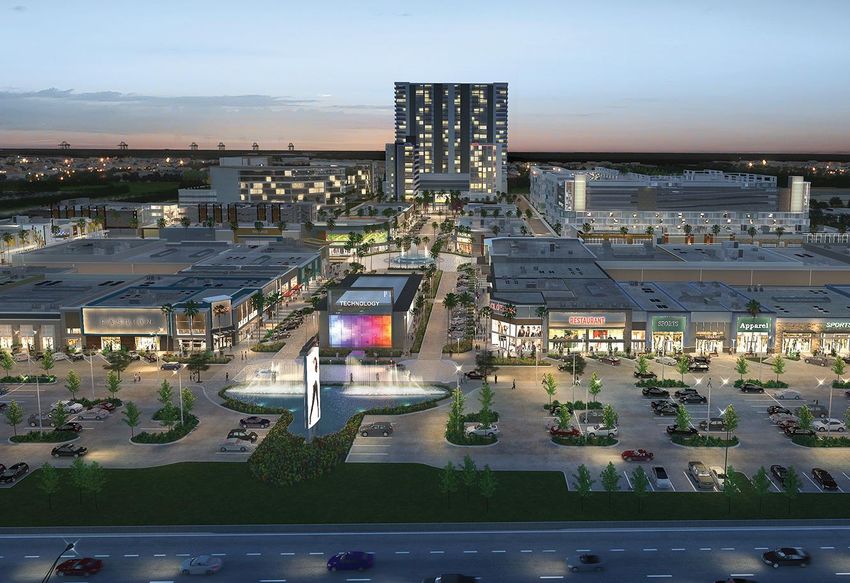
REITS AND KIMCO TODAY
            Kimco Tenants Successfully Implement Omni-channel Retailing / BOPIS

    Grocery orders can be picked up at
    about 2,450 stores and delivery will                                                                                          ~54% of online orders are
    cover ~75% of the U.S. population by                                                                                                picked up in store5
    the end of the year1

    Restaurants experienced digital                                                                                                Stores fulfilled more than
    sales growth of 101% year over                                                                                                       80% of Target’s first
    year through delivery, order ahead                               Online                                                             quarter digital sales6
    and catering2

    24% of BOPIS customers make an                                                            In-store
    additional purchase in store,
                                                                                                                                       40% of online orders
    effectively doubling their original                                                                                              are picked up in store7
    order3

                                                                                                                             Mobile payments for in store
&   Kohl’s now accepts Amazon                                                                                                 pick up have grown to 41%
    returns at all stores4
                                                                                                                               of total tender in the U.S.8

                       1.   Walmart fiscal 1Q FY20 Quarterly Results: Management Commentary; May 2019           5.   Home Depot 1Q19 Earnings Call transcript; May 2019
                       2.   Chipotle 1Q19 Earnings Call transcript (SeekingAlpha.com); April 2019               6.   Target 1Q19 Earnings Press Release; May 2019
                       3.   Duluth Trading 1Q19 Earning Call; June 2019                                         7.   Best Buy 1Q FY20 Earnings Call; May 2019                        8
                       4.   Kohl’s July 2019 Press Release: “Kohl’s Now Accepts Amazon Returns at All Stores”   8.   Starbucks.com Supplemental Data: Mobile Dashboard; April 2019
PORTFOLIO QUALITY

          Lincoln Square, Philadelphia, PA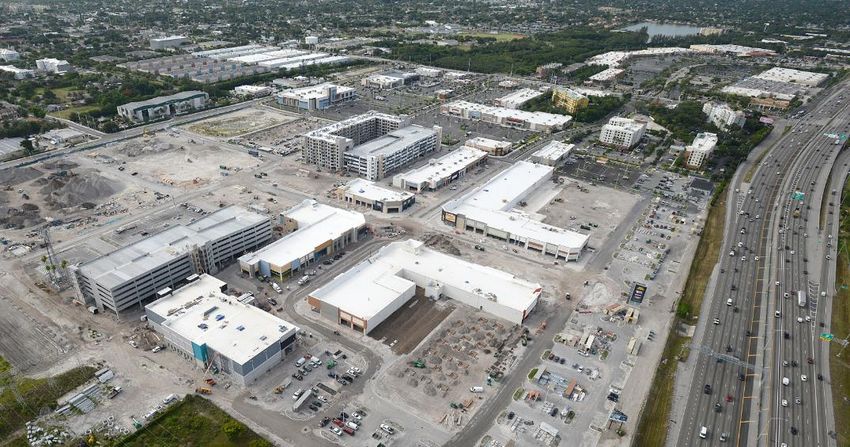
PORTFOLIO QUALITY
                Over 80% of Annual Base Rent comes from our top Major Metro Markets*

                           Denver                  Chicago

Seattle
Portland                                                                                                                                 Major Metro Markets
                                                                                                                                          ABR Contribution
                                                                                                            Boston
                                                                                                         New York              79% Coastal and Sun Belt Markets
San Francisco                                                                                        Philadelphia
Sacramento
San Jose                                                                                               Baltimore                2%      Other Major Metro Markets
                                                                                                  Washington D.C.
Los Angeles                                                                                      Raleigh-Durham
                                                                                                        Charlotte               81% Major Metro Markets
Orange County
San Diego                                                                                                                                Population growth of 6.3 million
                                                                                                                                         projected within the next 5 years
Phoenix
                                                                                                           Orlando

                                                                                                           Miami
                                                                                                  Fort Lauderdale

                              Austin   Dallas Houston        Atlanta     Tampa

                                              *Markets noted on the map are Kimco’s top major metropolitan markets by percentage of pro-rata ABR as of 6/30/2019   10
PORTFOLIO QUALITY
Tenant Diversity
Only 14 tenants with ABR exposure greater than 1.0%
3.8%
• Scale: 7,800 leases with 3,700 tenants
• Stability: Fixed, contractual rents with bumps
• Security: Average lease term of 10 years for anchors and 5 years for small shops
• Safety: No peer has more investment grade tenants in their Top 25 Tenant List*
2.5%
2.2%
2.0% 1.9% 1.8%
1.6% 1.5% 1.4%
1.2% 1.1%
Data as of 6/30/2019, Percentages noted reflect pro-rata annual base rent (ABR)
*Peers that report a Top 25 Tenant lists are: FRT, REG, WRI, UE, BRX, KRG, and SITC 11PORTFOLIO QUALITY
96% of Kimco’s Portfolio Composed of Retailers Thriving in the New Landscape
% of ABR
Service and Experiential Tenants 58%
14% Grocery/ Warehouse Clubs
14% Restaurants
10% Off-Price
9% Service
% of ABR
Omni-Channel Players 38% 5% Other (i.e. wireless, dollar store)
10% Home Improvement/ Home Decor 4% Health Clubs/ Fitness
6% Other (i.e. pet, party, accessories) 2% Medical
5% Sporting Goods/ Hobbies
5% Pharmacy/ Personal Care 63% of non-
Only 4% of our ABR comes
anchor ABR from
Remaining 4% from tenant-types that are 4% Apparel
Service based
still finding their ‘sweet
spot’ in this environment
4% Banking/ Finance 77% of ABR tenants
3% Mass Merchandiser from Grocery
Anchored
1% Electronics Centers
Data as of 6/30/2019, Percentages reflect pro-rata annual base rent (ABR)
12PORTFOLIO QUALITY
Strength of our Grocers Equates to Strength in our Portfolio
Average Grocer Sales PSF at Percent of KIM ABR from
KIM Shopping Centers Grocery Anchored Centers
$700M $677 $675
76.7% 77.4%
$645 75% 73.8%
72.2%
71.7%
$597
$600M 65.8%
$570
65%
$555
58.6%
$500M 55%
2013 2014 2015 2016 2017 2018 2013 2014 2015 2016 2017 2018 2Q19
PSF is defined as Per Square Foot 13PORTFOLIO QUALITY
Strong Portfolio Fundamentals
NEAR RECORD HIGH SMALL
SHOP OCCUPANCY
RENT PER SQUARE FOOT
U.S. OCCUPANCY
96.2% 90.5% $16.54
SIGNED RENTAL RATES FOR NEW
LEASES INCREASED OVER
1,330 RENTAL RATES FOR 10%
LEASES TOTALING OVER NEW LEASES UP FOR THE 22ND
7.7M SF *
37.0% CONSECUTIVE QUARTER
All figures are at Kimco’s share, as of 6/30/2019
*During the trailing twelve months 14PORTFOLIO QUALITY
New Leases Reflect Changing Consumer Preference
Home
Improvement &
Furnishings,
Restaurant, 15%
Off-Price &
Specialty Foods &
Dollar Store,
Entertainment,
10%
20%
New
Grocery &
Leases Warehouse
Signed* Clubs, 10%
Dedicated
Health, Wellness Merchandisers,
& Beauty, 26% 9%
Other
Services,
7%
Apparel/
Shoes,
3%
*During the trailing twelve months
Data as of 6/30/2019, Percentages reflect pro-rata annual base rent (ABR) 15PORTFOLIO QUALITY
Building Blocks of NOI Growth
Same Property NOI Growth
Organic Growth
Ground-Up
(Rent Bumps)
Development
Leasing and
Redevelopment
Mark to Market
Pipeline
Opportunities
16PORTFOLIO QUALITY
Unmatched Mark to Market Opportunities
Anchor Mark Anchor Mark
to Market to Market
Seattle-Portland Boston
16 90k +67% 16 188k +42%
sites population sites population
San Francisco, Sacramento,
New York
San Jose
22 174k +29% 63 187k +49%
sites population sites population
Los Angeles, Orange County, Philadelphia, Baltimore,
San Diego Washington D.C.
46 168k +62% 65 110k +95%
sites population sites population
Texas Atlanta Florida Raleigh-Durham, Charlotte
24 92k +36% 7 80k +48% 43 125k +55% 14 67k +30%
sites population sites population sites population sites population
Data as of 6/302019
Population is a weighted average (based on pro-rata annual base rent (ABR)) of estimated populations within a 3-mile radius of Kimco sites 17PORTFOLIO QUALITY
Growth through Leasing & Value Creation
$17
Anchor Lease Spreads/Mark To Market
$15.74
$15.10 ▪ Mark to Market Spread on Anchor Leases: ~60%
$15 $14.12
▪ Total Average RPSF up 32% since 2013
+31.1%
▪ 22 Consecutive quarters of new leasing spreads
$ABR/SF
+33.6%
$13
exceeding 10%
+39.3%
$12.00
▪ 32% of Anchor Leases are “Legacy Leases” (20 years
$11
$11.30
or older); 67% mark to market
▪ Leased vs. Economic Occupancy; 270bp spread
$10.14
$9
2013-2015A 2016-2018A 2016-2020E
New Rent Expiring Rent Projected Rent
18NAV CREATION
Dania Pointe, Dania Beach, FLNAV CREATION
Active Projects: De-Risked for Success
Projected
1 Projected Total Investment to Date
. Project Market Project Type Projected ROI Completion /
Investment (% Complete)2
Stabilization Year
Redevelopment
1 Suburban Square – Phase III Philadelphia Mixed-Use $18.2M $6.3M (35%) 7.50 to 7.80% 2019 / 2019
2 Pentagon Centre – Phase I Washington D.C. Mixed-Use $164.5M3 $155.8M (95%) 6.00 to 6.50% 2019 / 2020
3 The Boulevard New York Retail $188.5M $92.3M (49%) 6.00 to 6.50% 2020 / 2020
4 Kentlands Market Square – Phase I Washington D.C. Retail $23.1M $11.4M (49%) 13.00 to 13.50% 2020 / 2020
5 Pocono Plaza Eastern PA Retail $21.2M $2.0M (9%) 9.50 to 11.00% 2020 / 2020
Projected Total Investment for Redevelopment Projects 1 $415.5M
Development
6 Dania Pointe – Phase II & III Ft. Lauderdale Mixed-Use $256.0M $180.6M (71%) 6.00 to 7.00% 4 2020 / 2021
7 Mill Station Baltimore Retail $108.0M $84.6M (78%) 7.25 to 7.75% 2019 / 2019
Projected Total Investment for Development Projects $364.0M
Projected Total Investment for Redevelopment and Development Projects 1 $779.5M
1. Select investments >$15MM stated based on Q2 2019 Supplemental
2. Investment to Date reflects activity through 6/30/19
3. Stated as gross investment. Kimco owns 55% of Pentagon Centre 20
4. Returns for this project are stated on a combined/blended basis for multiple phasesNAV CREATION
Development and Redevelopment Investment
Total Investment ($M)
$418
400
$275 to $350
$296 $191 Development
300
Redevelopment
$115- $200 to $250 $200 to $250
$212 $135
200 $160
$70-
$143 $85
$125
100 $41 $200-
$227 $160- $250
$215 $130-
$136 $165
$102 $87
0
2015A 2016A 2017A 2018A 2019E 2020E 2021E & beyond*
All figures are at Kimco’s share
*Annually 21NAV CREATION
Development Projects: Exciting Progress
Dania Pointe – Ph. I
Dania Beach, FL
330K sf of retail
Anchors: TJMaxx, Ulta, BrandsMart,
Hobby Lobby, YouFit Health Club,
Lucky’s Market
Completed: Q4 2018
Dania Pointe – Ph. II & III
Dania Beach, FL
417K sf of retail (59% pre-leased)
Anchors: Bowlero, Forever 21, Lindbergh,
Tommy Bahama, B. Young, Regal Cinema,
Saito Japanese Steakhouse
Est. costs/completion:
$256M/2020
22NAV CREATION
Development Projects: Exciting Progress
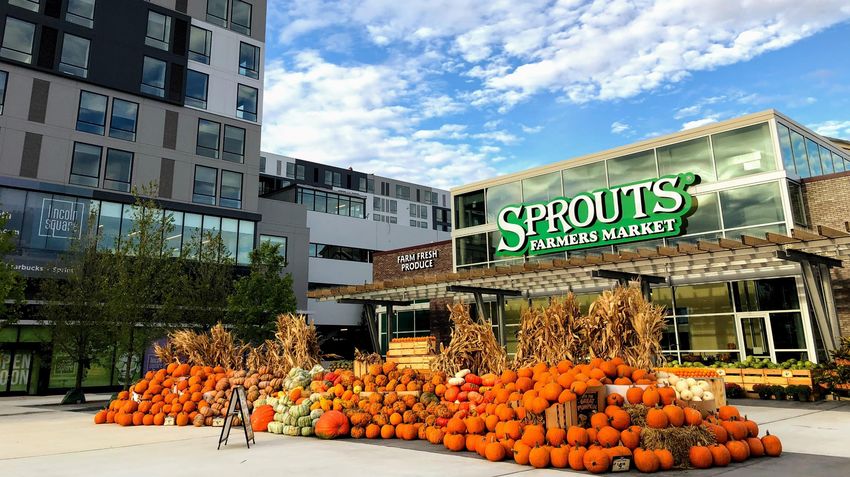
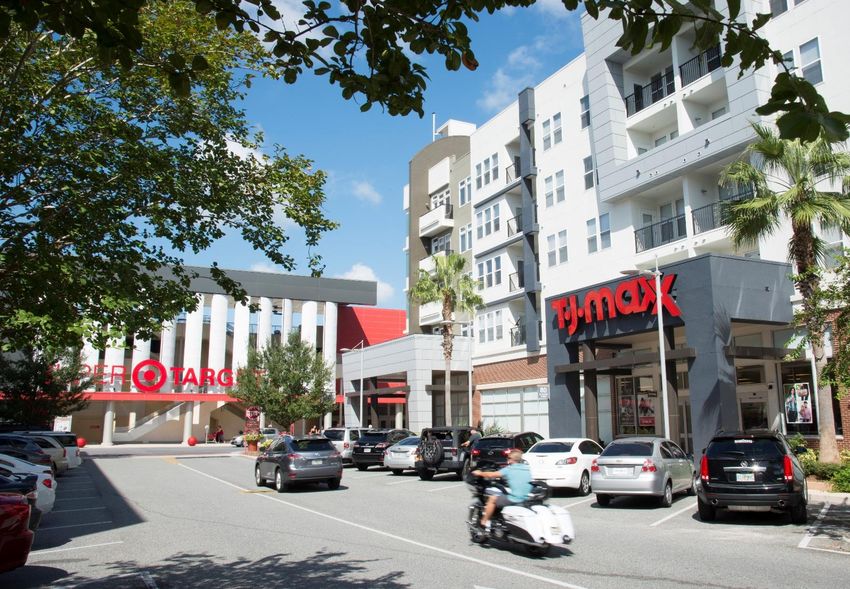
Lincoln Square
Philadelphia, PA
100K sf of retail & 322 residential units
Anchors: Target, Petsmart, Sprouts
Farmers Market
Completed: Q4 2018
Mill Station
Owings Mills, MD
621K sf of retail (93% pre-leased)
Anchors: Costco (open), Lowe’s (open),
AMC (open), Giant Food, Burlington,
HomeSense, Marshalls
Est. costs/completion:
$108M/2019
23NAV CREATION
Redevelopment Projects: Exciting Progress
Pentagon Centre – Ph. I
Arlington, VA
Across from Amazon’s HQ2
Residential tower - 440 units (open, Headquarters
46% leased)
Interior renovation and parking Pentagon Centre
Pentagon
structure complete Centre
Headquarters
Est. costs/completion:
$164.5M/2019
The Boulevard
Staten Island, NY
~400K sf of retail (89% pre-leased)
Anchors: ShopRite, Alamo Drafthouse,
Marshalls, Ulta
Est. costs/completion:
$188.5/2020
24NAV CREATION
Redevelopment Projects: Exciting Progress
Suburban Square – Ph. III
Station Row
Ardmore, PA
Two story Building
Mixed-use Retail/Office
Est. costs/completion:
$18.2M/2019
Kentlands – Ph. I
Gaithersburg, MD
Redevelop to create a
placemaking environment
Anchors: Cinepolis, Whole Foods
(open)
Est. costs/completion:
$23.1M/2020
25NAV CREATION
Completed Projects: Value Creation Realized
Redevelopment Activity Since 2015 2019 Highlights
82 PROPERTIES
W/ PROJECTS
$423.5M
GROSS INVESTMENT COMPLETED
9.8% 10
BLENDED ROI
REDEVELOPMENT
PROJECTS
WITH
A BLENDED RETURN
OF
8.5%
26NAV CREATION
Future Opportunities
27 POTENTIAL
PROJECTS
1.7M SF
RETAIL GLA IN SCOPE*
>6,000
RESIDENTIAL UNITS*
*Excludes Retail GLA in Scope and Residential Units for 6 projects in Master Planning 27NAV CREATION
Select Future Opportunities
Entitled Projects
Project Market Retail Scope Residential Scope Hotel Scope Office Scope Potential Commencement Horizon
Camino Square Ft. Lauderdale 40,000 SF 350 Units 1 to 3 Years
Kentlands Market Square - Phase 2 Washington D.C. 12,000 SF 245 Units 1 to 3 Years
Pentagon Centre - Phase 2 Washington D.C. 16,000 SF 253 Units 1 to 3 Years
Dania Pointe - Phase 4 & 5 Ft. Lauderdale 48,000 SF 400 Units 506,000 SF 1 to 3 Years
Westlake S.C. San Francisco 34,500 SF 179 Units 1 to 3 Years
Jericho Commons / Milleridge New York 93 Rooms 1 to 3 Years
Kentlands Market Square – Phase 3 Washington D.C. TBD1 1,384 Units TBD1 TBD1 10+ Years
Pentagon Centre – Phase 3 Washington D.C. 346,5002 200 Rooms 705,500 SF 15+ Years
Total 497,000 SF 2,811 Units 293 Rooms 1,211,500 SF
Projects Undergoing Entitlement3
Project Market Retail Scope Residential Scope Hotel Scope Office Scope Potential Commencement Horizon
Cupertino Village San Jose 185 Rooms 1 to 3 Years
The Marketplace at Factoria Seattle 10,000 SF 295 Units 1 to 3 Years
Kissena Blvd. S.C. New York 75,500 SF 215 Units 1 to 3 Years
Suburban Square - Phase 4 Philadelphia 19,000 SF 150 Units 1 to 3 Years
Fremont Hub San Jose 57,000 SF 255 Units 4 to 6 Years
North County Plaza San Diego 5,500 SF 260 Units 4 to 6 Years
West 38th Street Denver 6,000 SF 75 Units 4 to 6 Years
Hickory Ridge Baltimore 34,000 SF 230 Units 4 to 6 Years
Washington Street Plaza Boston 44,000 SF 270 Units 4 to 6 Years
Memorial Plaza Boston 57,000 SF 215 Units TBD 7 to 10 Years
Total 308,000 SF 1,965 Units 185 Rooms
1. Approved for 1.2M sf (breakdown for use has not yet been determined)
2. Reworked existing retail sf
3. Residential scope rounded for Projects Undergoing Entitlement
28FINANCIAL STRENGTH
Mill Station, Owings Mills, MDFINANCIAL STRENGTH
Financial Flexibility is Financial Strength
FLEXIBILITY
= STRENGTH
▪ Maintain a strong liquidity position ▪ Committed to strong investment grade ratings
$2.25B unsecured line of credit Baa1 Moody’s
BBB+ S&P
▪ Extend WAVG debt maturity profile
BBB+ Fitch
9.9 yrs
▪ Lower Net Debt / Adjusted EBITDA leverage levels
▪ Growing unencumbered asset pool 6.0x consolidated
76% of our properties 7.5x Pro-rata (including JV’s and preferred stock)
▪ Sustain Fixed Charge Coverage of 3.0+
3.3x
As of 6/30/2019 30FINANCIAL STRENGTH
Strong Capital Structure
Total Capitalization Balance Sheet Highlights
3%1%
8% ▪ Fitch affirmed BBB+ ratings with a
stable outlook
Common Equity
▪ No consolidated debt due in 2019 and
Unsecured Debt minimal debt due in 2020
$13.8B Preferred Stock
32% 56% Mortgage Debt
▪ Weighted average debt maturity
profile at 9.9 years, one of the longest in
Non-controlling Interest
the REIT industry
31FINANCIAL STRENGTH
Well-Staggered Debt Maturities
Consolidated Debt 24% Joint Venture Debt
1,200 Fixed Rate 3.62%* Fixed Rate 4.33%*
600
Floating Rate 3.56%* Floating Rate 4.04%*
WAVG Term 9.9 Yrs WAVG Term 4.37 Yrs
900
25%
16%
400
Debt in Millions
Debt in Millions
13%
600 10% 10% 15%
12% 13% 12%
9% 8% 8% 12%
200
No Debt
300 due in 6%
2019 2% 3%
0% 2%
0%
0 0
Secured Unsecured Line of Credit Kimco’s Share Partner’s Share
One of the longest debt maturity profiles in the REIT industry Percentages are annual maturities of total debt stack
*Weighted average 32APPENDIX Pentagon Centre, Arlington, VA
CORPORATE SUSTAINABILITY
  Established Priorities          Tangible Results                 Transparency & Leadership

                                       Awards                       2018 Corporate Responsibility Report
Operational         Tenant
Leadership        Partnerships
                                           Global 1200 ESG Index

         Stakeholder
         Engagement

Quality Team      Community

                                                                                                           34
RECONCILIATION OF NON GAAP MEASURES
FFO to Net Income Available to the Company’s Common Shareholders
2019E 2019E
($M) FFO/Share (1)
FFO as Adjusted $606 - $623 $1.44 - $1.48
Transactional income, net 2–2 0.00 – 0.00
FFO $608 - $625 $1.44 - $1.48
Depreciation and amortization real estate related (279) - (290) (0.66) - (0.69)
Depreciation and amortization real estate JVs (2) (38) - (43) (0.09) - (0.10)
Gain on sale of properties/change in control of interests 50 – 68 0.12 - 0.16
Gain on disposition of JV properties/change in control of interests 17 – 22 0.04 - 0.05
Impairment charges (25) – (25) (0.06) - (0.06)
Profit participation from other real estate investments, net 11 – 11 0.03 – 0.03
Loss on marketable securities 2–2 0.00 – 0.00
Noncontrolling interests (3) 1–2 0.00 – 0.01
Net income available to common shareholders $347 - $372 $0.82 - $0.88
(1) Reflects diluted per share basis and the operational impact if certain units were converted to common stock at the beginning of the period
(2) Net of non-controlling interests
(3) Related to gains, impairments and depreciation on operating properties, where applicable 35RECONCILIATION OF NON GAAP MEASURES
Net Income to EBITDA & Net Debt/EBITDA Calculations
Net income/(loss) $ 101,387 Net Debt / EBITDA Calculation
Interest 44,097 $2,345,766 and $2,115,320, respectively
of $2,398,588,
Other interest - Net Debt $ 4,791,511
Depreciation and amortization 69,005
Gain on sale of properties/change in control of interests (14,762) Consolidated EBITDA $ 208,373
Gain on sale of joint venture properties (8,496) Consolidated EBITDA as adjusted $ 198,548
Impairment charges 17,451
Impairment of joint venture properties 35
Provision/(benefit) for income taxes (344) Net Debt to Consolidated EBITDA 5.7x
Consolidated EBITDA 208,373 Net Debt to Consolidated EBITDA as adjusted 6.0x
Transactional charges / (income), net (9,825)
Consolidated EBITDA as adjusted $ 198,548 Net Debt / EBITDA Calculation Pro-Rata (Including Preferreds)
Consolidated EBITDA $ 208,373 Net Debt (Pro-rata Share with JV) $ 5,388,594
Prorata share of interest expense - real estate jv's 6,793 Preferred Stock 1,064,500
Prorata share of depreciation and amortization - real estate jv's 10,115 Debt $ 6,453,094
EBITDA including prorata share - JV's 225,281
Transactional charges / (income), net (9,825) Pro-rata EBITDA $ 215,166
EBITDA as adjusted including prorata share - JV's $ 215,456 JV Depreciation 10,115
EBITDA Adjustments (9,825)
Debt $ 4,905,502 EBITDA $ 215,456
Cash 113,991
Net Debt $ 4,791,511 Net Debt and Preferred to Pro-rata EBITDA as adjusted
(including preferreds) 7.5x
36KIMCO NOTES
37You can also read