INVESTOR PRESENTATION - THIRD QUARTER 2019 - Kimco Realty Corporation
←
→
Page content transcription
If your browser does not render page correctly, please read the page content below
INVESTOR PRESENTATION
THIRD QUARTER 2019
SAFE HARBOR
                                                                         The statements in this presentation, including targets and assumptions, state
                                                                         the Company’s and management’s hopes, intentions, beliefs, expectations or
                                                                         projections of the future and are forward-looking statements. It is important to
                                                                         note that the Company’s actual results could differ materially from those
                                                                         projected in such forward-looking statements. Factors that could cause actual
                                                                         results to differ materially from current expectations include the key
                                                                         assumptions contained within this presentation, general economic conditions,
                                                                         local real estate conditions, increases in interest rates, foreign currency
                                                                         exchange rates, increases in operating costs and real estate taxes. Additional
                                                                         information concerning factors that could cause actual results to differ
                                                                         materially from those forward-looking statements is contained from time to
                                                                         time in the Company’s SEC filings, including but not limited to the Company’s
                                                                         Annual Report on Form 10-K. Copies of each filing may be obtained from
                                                                         http://investors.kimcorealty.com/ or the SEC.

Cover: Lincoln Square, Philadelphia, PA   Suburban Square, Ardmore, PA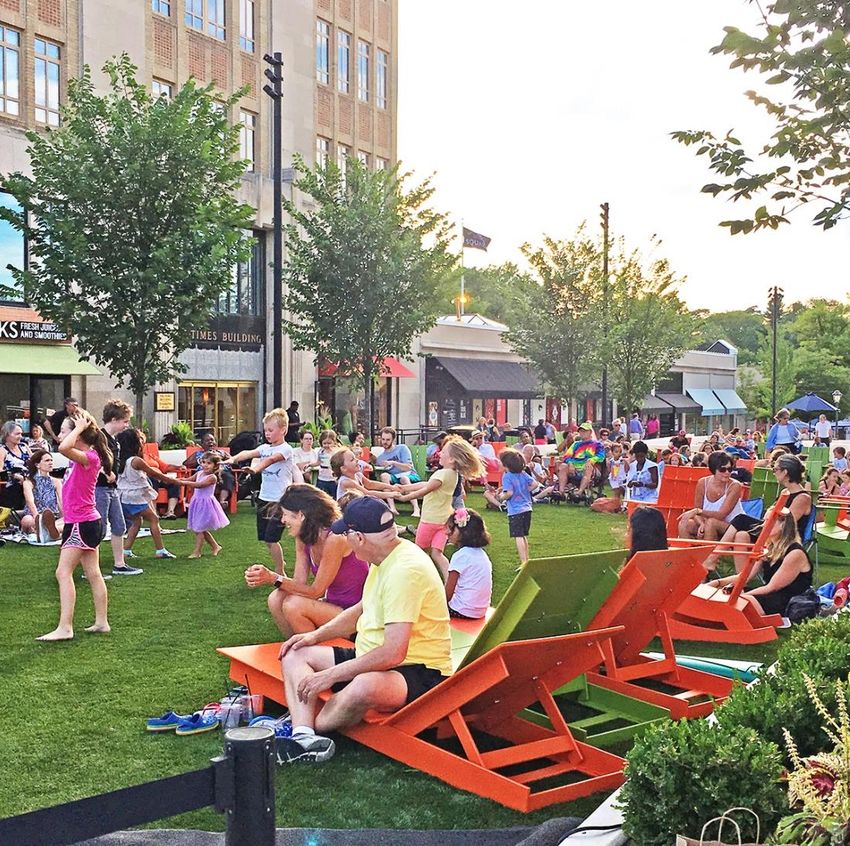
KIMCO’S 2020 VISION

                         Increase net asset value (NAV) through a curated
                         High-quality assets, tightly clustered in major metro markets
    NAV CREATION         collection of mixed-use projects, redevelopments and
                         that provide multiple growth levers
                         active investment management

                         High-quality assets, tightly clustered in major metro markets
 PORTFOLIO QUALITY       that provide multiple growth levers

FINANCIAL STRENGTH       Maintain a strong balance sheet and financial flexibility

                                                                                     3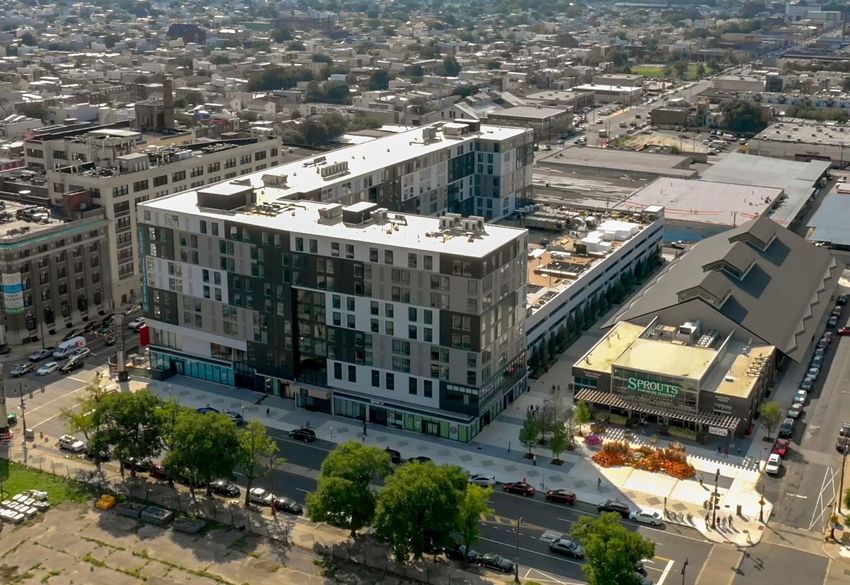
NAV CREATION

Development Project @ Dania Pointe, Dania Beach, FL
NAV CREATION
                                                    Active Projects: De-Risked for Success

                                                                                                                                                                                       Projected
                              1                                                           Projected Total Investment to Date
  .                 Project                            Market                Project Type                                                                 Projected ROI               Completion /
                                                                                            Investment       (% Complete)2
                                                                                                                                                                                    Stabilization Year
Redevelopment
  1 Suburban Square – Phase III           Philadelphia                     Mixed-Use             $18.2M                 $12.2M (67%)                      7.50 to 7.80%                 2019 / 2019
  2 Pentagon Centre – Phase I             Washington D.C.                  Mixed-Use             $164.5M3               $164.2M (100%)                    6.00 to 6.50%                 2019 / 2020
  3 The Boulevard                         New York                         Retail                $213.5M                $124.5M (58%)                     6.00 to 6.50%                 2020 / 2020
  4 Kentlands Market Square – Phase I     Washington D.C.                  Retail                $23.1M                 $16.0M (69%)                    13.00 to 13.50%                 2020 / 2020
  5 Pocono Plaza                          Eastern PA                       Retail                $21.2M                 $10.8M (51%)                     9.50 to 11.00%                 2020 / 2020
Projected Total Investment for Redevelopment Projects 1                                          $440.5M

Development
  6 Dania Pointe – Phase II & III          Ft. Lauderdale                  Mixed-Use             $256.0M                $196.9M (77%)                    6.00 to 7.00% 4                2020 / 2021
  7 Mill Station                           Baltimore                       Retail                $108.0M                $94.2M (87%)                     7.25 to 7.75%                  2019 / 2019
Projected Total Investment for Development Projects                                              $364.0M

Projected Total Investment for Redevelopment and Development Projects 1                          $804.5M

                                   1.   Select investments >$15MM stated based on Q3 2019 Supplemental   3.   Stated as gross investment. Kimco owns 55% of Pentagon Centre
                                   2.   Investment to Date reflects activity through 9/30/19             4.   Returns for this project are stated on a combined/blended basis for multiple phases   5
NAV CREATION
                      Development and Redevelopment Investment
                                    Total Investment ($M)

                                         $418
400

                                                   $275 to $350
                            $296          $191                                                                  Development
300
                                                                                                                Redevelopment
                                                       $115-      $200 to $250   $200 to $250
               $212                                    $130
200                          $160
                                                                       $70-
      $143                                                             $85
                $125
100    $41                                                                           $200-
                                          $227         $160-                         $250
                                                       $220           $130-
                             $136                                     $165
       $102     $87
 0

       2015A    2016A        2017A         2018A        2019E          2020E      2021E & beyond*

                                                                                          All figures are at Kimco’s share
                                                                                          *Annually                          6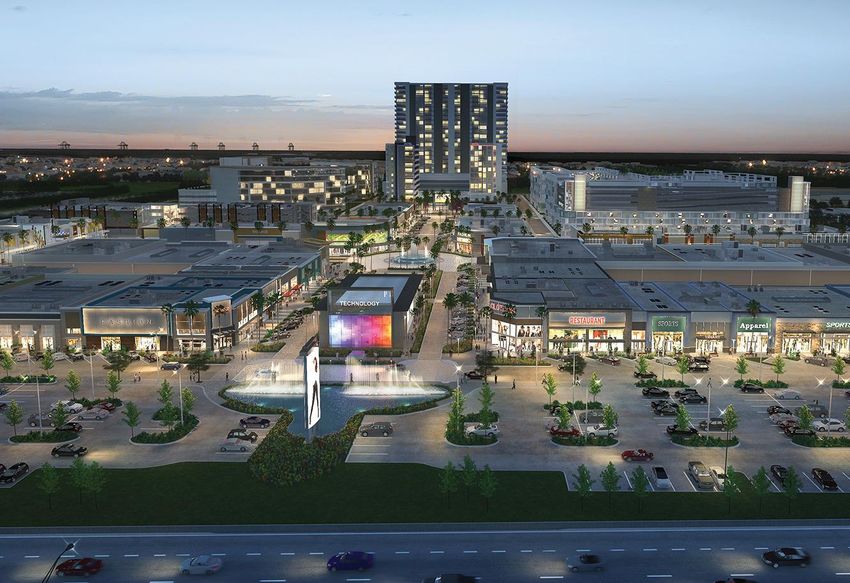
NAV CREATION
Development Projects: Exciting Progress

    Dania Pointe – Ph. I
    Dania Beach, FL
    330K sf of retail
    Anchors: TJMaxx, Ulta, BrandsMart,
    Hobby Lobby, YouFit Health Club,
    Lucky’s Market
    Completed: Q4 2018

    Dania Pointe – Ph. II & III
    Dania Beach, FL
    417K sf of retail (64% pre-leased),
    +850 residential units,
    +350 hotel rooms,
    +506K sf office space
    Anchors: Bowlero, Regal Cinema,
    Lindbergh, Tommy Bahama, Saito
    Japanese Steakhouse, B. Young
    Est. Retail costs/completion:
    $256M/2020

                                          7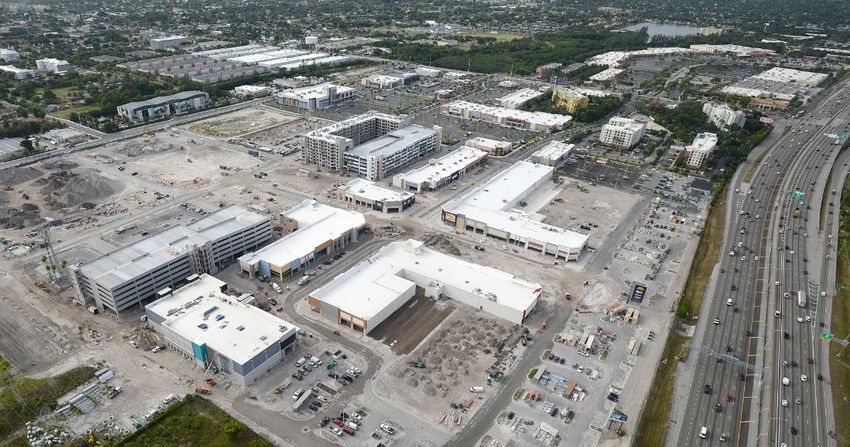
NAV CREATION
Development Projects: Exciting Progress

    Lincoln Square
    Philadelphia, PA
    100K sf of retail & 322 residential units
    Anchors: Target, Petsmart, Sprouts
    Farmers Market
    Residential: open, over 90% leased
    Completed: Q4 2018

    Mill Station
    Owings Mills, MD
    621K sf of retail (93% pre-leased)
    Open Anchors: Costco, Lowe’s, AMC,
    Giant Food, Burlington, HomeSense,
    Marshalls
    Est. costs/completion:
    $108M/2019

                                                8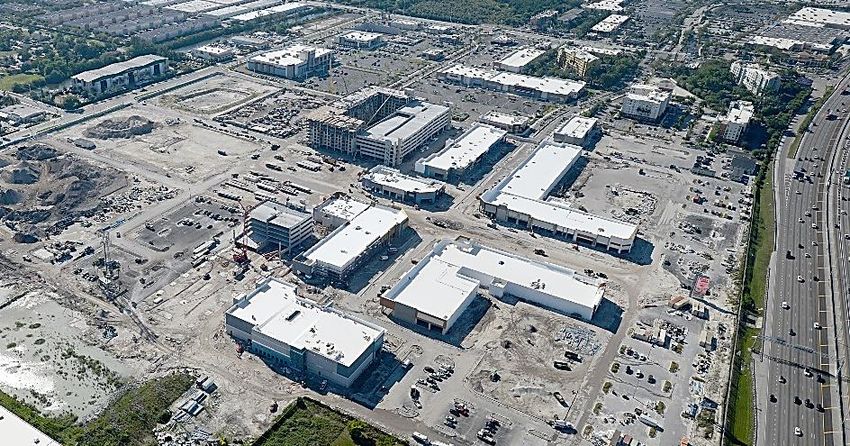
NAV CREATION
Redevelopment Projects: Exciting Progress

      Pentagon Centre – Ph. I
      Arlington, VA
      Across from Amazon’s HQ2
      Residential tower - 440 units (open,                     Headquarters

      79% leased)
      Interior renovation and parking        Pentagon Centre
                                                 Pentagon
      structure complete                          Centre
                                                                       Headquarters

      Est. costs/completion:
      $164.5M/2019

      The Boulevard
      Staten Island, NY
      ~400K sf of retail (89% pre-leased)
      Anchors: ShopRite, Alamo Drafthouse,
      Marshalls, Ulta
      Est. costs/completion:
      $213.5/2020

                                                                                      9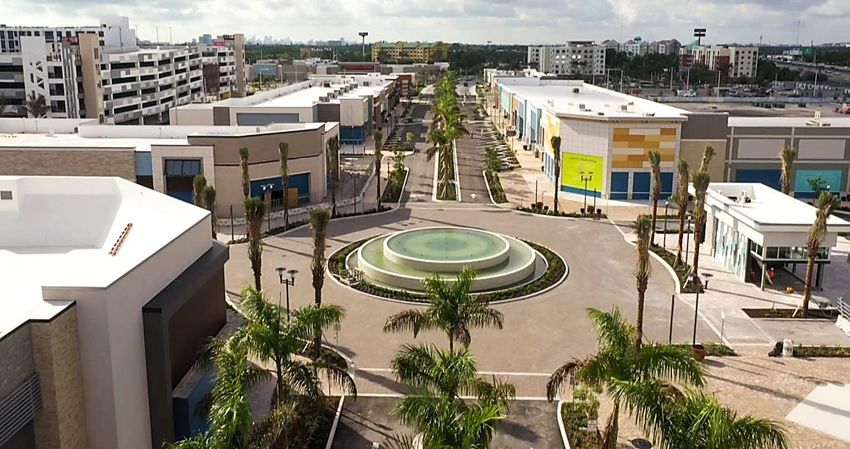
NAV CREATION
Redevelopment Projects: Exciting Progress

      Suburban Square – Ph. III
      Station Row
      Ardmore, PA
      Two story Building
      Mixed-use Retail/Office
      Est. costs/completion:
      $18.2M/2019

      Kentlands – Ph. I
      Gaithersburg, MD
      Redevelop to create a
      placemaking environment
      Open Anchors: Cinepolis,
      Whole Foods
      Est. costs/completion:
      $23.1M/2020

                                            Kentlands photo credit: Om Khurjekar
                                                                                   10
NAV CREATION
Completed Projects: Value Creation Realized
Redevelopment Activity Since 2015 2019 Highlights
86 PROPERTIES
W/ PROJECTS
$435.6M
GROSS INVESTMENT COMPLETED
9.9% 15
BLENDED ROI
REDEVELOPMENT
PROJECTS
WITH
A BLENDED RETURN
OF
9.1%
11NAV CREATION
Future Opportunities
26 POTENTIAL
PROJECTS
INFORMATION AS OF NOVEMBER 2019
FUTURE –26
26 PROJECTS
1.7M SF
MIXED-USE20
– 20 PROJECTS
MASTER PLANNING – 6 PROJECTS
RETAIL GLA IN SCOPE*
>6,000
RESIDENTIAL UNITS*
*Excludes Retail GLA in Scope and Residential Units for 6 projects in Master Planning 12NAV CREATION
Mixed-Use Project Detail
Retail Residential Office
Project Market Hotel Scope Status Timeline
Scope Scope Scope
The Shoppes at Wilde Lake Baltimore, MD 32,000 SF 230 Units 15,000 SF Completed Q3 2016
Lincoln Square Philadelphia 101,226 SF 322 Units Completed Q4 2018
Pentagon Centre - Phase I (The Witmer) Washington D.C. 346,5002 SF 440 Units Active 2019
Dania Pointe - Phase II & III Ft. Lauderdale 417,000 SF 850 Units 350 Rooms 506,000 SF Active Retail: 2020
Camino Square Ft. Lauderdale 40,000 SF 350 Units Entitled Potential Commencement: 1 to 3 Years
Kentlands Market Square - Phase II Washington D.C. 12,000 SF 245 Units Entitled Potential Commencement: 1 to 3 Years
Pentagon Centre - Phase II Washington D.C. 16,000 SF 253 Units Entitled Potential Commencement: 1 to 3 Years
Dania Pointe – Future Phases Ft. Lauderdale 150 Units Entitled Potential Commencement: 1 to 3 Years
Westlake S.C. San Francisco 34,500 SF 179 Units Entitled Potential Commencement: 1 to 3 Years
Jericho Commons / Milleridge New York 93 Rooms Entitled Potential Commencement: 1 to 3 Years
Cupertino Village San Jose 185 Rooms Entitled Potential Commencement: 1 to 3 Years
Suburban Square - Phase IV Philadelphia 19,000 SF 150 Units Entitled Potential Commencement: 1 to 3 Years
Kentlands Market Square – Phase III Washington D.C. TBD1 1,384 Units TBD1 TBD1 Entitled Potential Commencement: 10+ Years
Pentagon Centre – Phase III Washington D.C. 346,5002 SF 200 Rooms 705,500 SF Entitled Potential Commencement: 15+ Years
Total 1,364,726 SF 4,553 Units 828 Rooms 1,226,500 SF
1. Approved for 1.2M sf (breakdown for use has not yet been determined)
2. Reworked existing retail sf 13NAV CREATION
Select Mixed-Use Projects Undergoing Entitlement
Residential Office Potential Commencement
Project Market Retail Scope Hotel Scope
Scope Scope Horizon
The Marketplace at Factoria Seattle 10,000 SF 295 Units 1 to 3 Years
Kissena Blvd. S.C. New York 75,500 SF 215 Units 1 to 3 Years
Fremont Hub San Jose 57,000 SF 255 Units 4 to 6 Years
North County Plaza San Diego 5,500 SF 260 Units 4 to 6 Years
Hickory Ridge Baltimore 34,000 SF 230 Units 4 to 6 Years
Washington Street Plaza Boston 44,000 SF 270 Units 4 to 6 Years
Memorial Plaza Boston 57,000 SF 215 Units TBD 7 to 10 Years
Total 283,000 SF 1,740 Units
Residential scope rounded
14REITS AND KIMCO TODAY
Redevelopment Project @ Suburban Square, Ardmore, PAREITS AND KIMCO TODAY
Positioned for Success as Retail Transforms
Consumer Preference Profile: Kimco Asset Profile:
Instant need for everyday goods ✓ 77% of ABR comes from grocery anchored centers
In-person services ✓ 64% of ABR from small shops is from service-based tenants
Experiences in a social environment ✓ 58% of ABR comes from Service & Experiential Tenants
Technology to ease pain points of shopping ✓ 38% of ABR comes from Omni-Channel Players
Convenient location ✓ 81% of ABR comes from top Major Metro Markets
ABR is defined as Annual Base Rent 16REITS AND KIMCO TODAY
Net Store Openings Weighing in Favor of Shopping Center Landlords
Over 6,000 Net New
Store Openings in 2019*
” *Creditntell; June 2019 17REITS AND KIMCO TODAY
Brick and Mortar Remains a Critical Component of Retail Strategy
FY2019:
+58 Marmaxx
+51 stores in 2019 +65 new locations +700 stores by the end of 2022
+98 new stores in 2019 +94 HomeGoods
+16 relocations
in 2019 FY2020:
+60 Marmaxx
+80 HomeGoods
+260 new locations in 2018 +145 to 150 new stores in 2019 +250 to 260 stores in 2019 +80 stores in 2019
+75 new stores in 2019
+Same pace in 2019 (unit growth of 19 to 20%) (a record for the brand) +75 stores in 2020
+70 stores in 2021
Burlington Store Press Release 11/26/19 TJX 2018 Annual Report - page 6 Five Below Earnings Call 3/17/19
National Vision Holdings Press Release 8/6/19
Hobby Lobby Press Release 2/6/19
Ross Dress for Less Press Release 10/14/19
Aldi Press Release 9/18/18
Orangetheory Fitness Chain Store Age article 10/9/18. Planet Fitness Press Release 8/6/19 18
Ulta Press Release 5/31/19REITS AND KIMCO TODAY
Retailers Use Stores as Hubs
Delivery from Store Drive Up Free expedited shipping Order Pickup Same Day Delivery
Free technology consultations both
40% cost reduction from store fulfillment;
in-store and on-site Select products offered in store 90% for same-day offerings2
Same-day delivery options Free 2-hour delivery for members Stores fulfilled more than 80% of
Embracing showrooming effect with
Discounts in-store for members Target’s Q1 digital sales3
price-matching policy
~50% of online orders are picked up in store4
1. Target 1Q19 Earnings Call Transcript; May 2019
2. Target 1Q19 Earnings Press Release; May 2019
3. Home Depot 2Q19 Earnings Call transcript; August 2019
19REITS AND KIMCO TODAY
Kimco Tenants Successfully Implement Omni-channel Retailing / BOPIS
Grocery orders can be picked Nearly 90% of all
up at about 2,700 stores BOPIS orders are filled
and delivery covers ~75% of and ready for pickup
the U.S. population1 within 30 minutes4
Restaurants experienced digital Online
sales growth of 88% year over 40% of online orders
year through delivery, order are picked up in store5
ahead and catering2 In-store
24% of BOPIS customers make Mobile payments for in
an additional purchase in store pick up have
store, effectively doubling their grown to 42% of total
original order3 tender in the U.S.6
1. Walmart fiscal 2Q FY20 Quarterly Results: Management Commentary; August 2019 4. Dick’s Sporting Goods 2Q FY20 Earnings Call transcript; August 2019
2. Chipotle 3Q19 Earnings Call transcript (SeekingAlpha.com); October 2019 5. Best Buy 1Q FY20 Earnings Call; May 2019
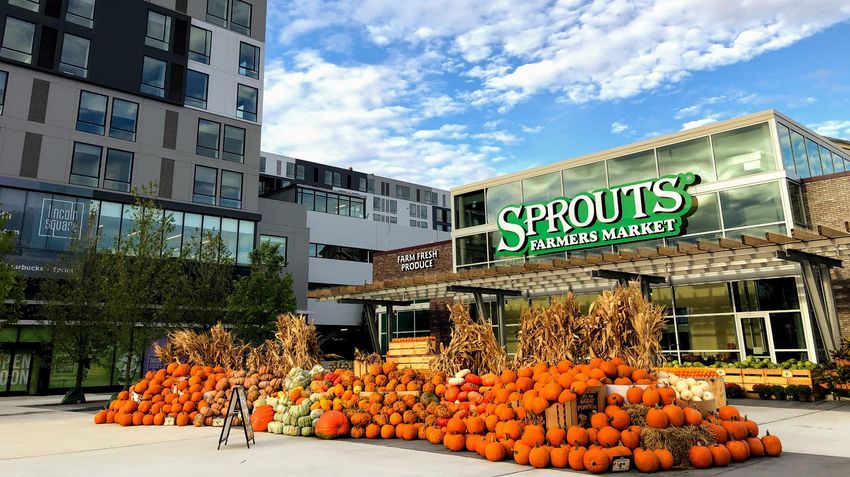
3. Duluth Trading 1Q19 Earning Call; June 2019 6. Starbucks.com Supplemental Data: Mobile Dashboard; October 2019 20PORTFOLIO QUALITY Development Project @ Lincoln Square, Philadelphia, PA
PORTFOLIO QUALITY
                Over 80% of Annual Base Rent comes from our top Major Metro Markets*

                           Denver                  Chicago

Seattle
Portland                                                                                                                                 Major Metro Markets
                                                                                                                                          ABR Contribution
                                                                                                            Boston
                                                                                                         New York              79% Coastal and Sun Belt Markets
San Francisco                                                                                        Philadelphia
Sacramento
San Jose                                                                                               Baltimore                2%      Other Major Metro Markets
                                                                                                  Washington D.C.
Los Angeles                                                                                      Raleigh-Durham
                                                                                                        Charlotte               81% Major Metro Markets
Orange County
San Diego                                                                                                                                Population growth of 6.3 million
                                                                                                                                         projected within the next 5 years
Phoenix
                                                                                                           Orlando

                                                                                                           Miami
                                                                                                  Fort Lauderdale

                              Austin   Dallas Houston        Atlanta     Tampa

                                              *Markets noted on the map are Kimco’s top major metropolitan markets by percentage of pro-rata ABR as of 9/30/2019   22
PORTFOLIO QUALITY
Tenant Diversity
3.8%
Only 14 tenants with ABR exposure greater than 1.0%
• Scale: 7,700 leases with 3,500 tenants
• Stability: Fixed, contractual rents with bumps
• Security: Average lease term of 10 years for anchors and 5 years for small shops
• Safety: No peer has more investment grade tenants in their Top 25 Tenant List*
2.4%
2.2%
1.9%
1.8%
1.6% 1.5% 1.4%
1.2%
1.1%
Data as of 9/30/2019, Percentages noted reflect pro-rata annual base rent (ABR)
*Peers that report a Top 25 Tenant lists are: FRT, REG, WRI, UE, BRX, KRG, and SITC 23PORTFOLIO QUALITY
96% of Portfolio Composed of Retailers Thriving in the New Landscape
Service and Experiential Tenants Omni-Channel Players Remaining
58% 38% 4%
of ABR of ABR of ABR
14% Restaurants 10% Home Improvement/ Home Decor Only 4% of our ABR comes
14% Grocery/ Warehouse Clubs 6% Other (i.e. pet, party, accessories) from tenant-types that are
10% Off-Price 5% Sporting Goods/ Hobbies still finding their ‘sweet
9% Service 5% Pharmacy/ Personal Care spot’ in this environment
5% Other (i.e. wireless, dollar store) 4% Apparel
4% Health Clubs/ Fitness 4% Banking/ Finance
2% Medical 3% Mass Merchandiser Did You Know…
1% Electronics 64% of non-anchor ABR comes from Service based tenants
77% of ABR comes from Grocery Anchored Centers
Data as of 9/30/2019, Percentages reflect pro-rata annual base rent (ABR)
24PORTFOLIO QUALITY
Strength of our Grocers Equates to Strength in our Portfolio
Average Grocer Sales PSF at Percent of KIM ABR from
KIM Shopping Centers Grocery Anchored Centers
$700M
$677 $675 77.3%
76.7%
$645 73.8%
75%
72.2%
71.7%
$597
$600M 65.8%
$570
65%
$555
58.6%
$500M 55%
2013 2014 2015 2016 2017 2018 2013 2014 2015 2016 2017 2018 3Q19
PSF is defined as Per Square Foot 25PORTFOLIO QUALITY
Strong Portfolio Fundamentals
ALL TIME HIGH
96.4% ANCHOR OCCUPANCY
RENT PER SQUARE FOOT
ALL TIME HIGH
U.S. OCCUPANCY 98.7% $16.63
SIGNED RENTAL RATES FOR NEW
LEASES INCREASED OVER
1,318 RENTAL RATES FOR 10%
LEASES TOTALING OVER NEW LEASES UP FOR THE 23RD
8.1M SF *
27.2% CONSECUTIVE QUARTER
All figures are at Kimco’s share, for the third quarter
*During the trailing twelve months 26PORTFOLIO QUALITY
New Leases Reflect Changing Consumer Preference
Home
Improvement &
Furnishings,
11% Off-Price &
Health, Wellness Dollar Store,
& Beauty, 23% 11%
New Grocery &
Leases Warehouse
Clubs, 10%
Signed
Restaurant, Other Services,
Specialty Foods 8%
& Entertainment,
Dedicated
24%
Merchandisers,
8%
Apparel/
Shoes,
5%
During the trailing twelve months
Data as of 9/30/2019, Percentages reflect pro-rata annual base rent (ABR) 27PORTFOLIO QUALITY
Building Blocks of NOI Growth
Same Property NOI Growth
Organic Growth
Ground-Up
(Rent Bumps)
Development
Leasing and
Redevelopment
Mark to Market
Pipeline
Opportunities
28PORTFOLIO QUALITY
Growth through Leasing & Value Creation
$17
Anchor Lease Spreads/Mark To Market
$15.74
$15.10 ▪ Mark to Market Spread on Anchor Leases: ~60%
$15 $14.12
▪ Total Average RPSF up 32% since 2013
+31.1%
▪ 23 Consecutive quarters of new leasing spreads
$ABR/SF
+33.6%
$13
exceeding 10%
+39.3%
$12.00
▪ 36% of Anchor Leases are “Legacy Leases” (20 years
$11
$11.30
or older); 66% mark to market
▪ Leased vs. Economic Occupancy; 270bp spread
$10.14
$9
2013-2015A 2016-2018A 2016-2020E
New Rent Expiring Rent Projected Rent
29PORTFOLIO QUALITY
Corporate Sustainability
Established Priorities Tangible Results Transparency & Leadership
Awards 2018 Corporate Responsibility Report
Operational Tenant
Leadership Partnerships
Stakeholder
Engagement
Quality Team Community
Global 1200 ESG Index
30FINANCIAL STRENGTH
Mill Station, Owings Mills, MDFINANCIAL STRENGTH
Financial Flexibility is Financial Strength
FLEXIBILITY
= STRENGTH
▪ Maintain a strong liquidity position ▪ Committed to strong investment grade ratings
$2.25B unsecured line of credit BBB+ S&P
Baa1 Moody’s
▪ Extend WAVG debt maturity profile
BBB+ Fitch
10.8 yrs
▪ Lower Net Debt / Adjusted EBITDA leverage levels
▪ Grow unencumbered asset pool 6.4x consolidated
~80% of our properties 7.4x Pro-rata (including JV’s and preferred stock)
(up from 51% in 2014)
▪ Sustain Fixed Charge Coverage of 3.0+
~80% of our Total NOI
(up from 62% in 2014) 3.3x
As of 9/30/2019 32FINANCIAL STRENGTH
Strong Capital Structure
Balance Sheet Highlights Total Capitalization*
▪ Announced it will redeem $225M of 5.500%
Class J Preferred Stock on December 31, 2019 3% 1%
5% 3%1%
5%
▪ Issued $350M of 3.70% notes maturing
October 1, 2049, with an effective yield of
3.765% Common Equity
▪ Redeemed $175M of 6.000% Class I and Unsecured Debt
$175M of 5.625% Class K Preferred Stock on 32%
32%
September 13, 2019 $14.9B Preferred Stock
59%
59% Mortgage Debt
▪ Fitch affirmed BBB+ ratings with a stable
outlook Non-controlling Interest
▪ No consolidated debt due in 2019 and
minimal debt due in 2020
▪ Weighted average debt maturity profile at
10.8 years, one of the longest in the REIT industry
*As of 9/30/2019 33FINANCIAL STRENGTH
Well-Staggered Debt Maturities
Consolidated and Pro-rata Joint Venture Debt
27%
1,600 Consolidated Debt Joint Venture Debt
1,400 Fixed Rate 3.62%* Fixed Rate 4.18%*
Debt in Millions
Floating Rate 3.41%* Floating Rate 3.55%*
1,200 16% WAVG Term 10.8 Yrs WAVG Term 4.3 Yrs
Secured Debt 9% Secured Debt 95%
1,000 Unsecured Debt 91% Unsecured Debt 5%
12%
800
9% 9% 9%
600
8% 7%
No Debt
400 due in
3%
2019
200 0%
0
2019 2020 2021 2022 2023 2024 2025 2026 2027 2028 Thereafter
Percentages are annual maturities of total pro-rata debt stack
One of the longest debt maturity profiles in the REIT industry 2022 includes the expiration of a $2.25B line of credit
*Weighted average
34FINANCIAL STRENGTH
Significant Improvement in Credit Metrics
Consolidated NOI % Unencumbered Consolidated NOI
90% $1,200
80% 86.8% 87.1% $1,000 90.0% 92.4% 95.3% 98.5%
86.3% 86.1% 86.3% 86.3% 76.0% 83.6% 86.9% 89.8%
83.6%
$800
70% 78.0% 75.0%
$600
60%
62.2% $400
50% $200
2010 2015 2016 2017 2018 2019 2020 2021 2022 2010 2015 2016 2017 2018 2019 2020 2021 2022
% of Consolidated NOI Unencumbered Encumbered % Unencumbered
Net Debt/ Recurring EBITDA Debt Coverage Metrics
8.5x 5.0x
7.5x 4.0x
3.8x 3.9x
6.5x 3.0x 3.7x 3.7x
3.2x 3.2x 3.4x
6.3x 6.5x 6.4x 2.8x 3.0x
5.5x 6.0x 6.0x 2.0x
5.9x 5.9x 5.9x 5.5x
4.5x 1.0x
2010 2015 2016 2017 2018 2019 2020 2021 2022 2010 2015 2016 2017 2018 2019 2020 2021 2022
Consolidated Pro-Rata Including Preferreds Fixed Charge Debt Service
35APPENDIX
Redevelopment Project @ Pentagon Centre,
Pentagon Arlington,
Centre, VAVA
Arlington,RECONCILIATION OF NON-GAAP MEASURES
FFO to Net Income Available to the Company’s Common Shareholders
2019E 2019E
($M) FFO/Share (1)
FFO as Adjusted $616 - $620 $1.46 - $1.47
Transactional income, net (8) – (4) (0.02) – (0.01)
FFO $608 - $616 $1.44 - $1.46
Depreciation and amortization real estate related (276) - (287) (0.65) - (0.68)
Depreciation and amortization real estate JVs (2) (38) - (43) (0.09) - (0.10)
Gain on sale of properties/change in control of interests 50 – 68 0.12 - 0.16
Gain on disposition of JV properties/change in control of interests 16 – 21 0.04 - 0.05
Impairment charges (46) – (46) (0.11) - (0.11)
Profit participation from other real estate investments, net 10 – 10 0.02 – 0.02
Loss on marketable securities 1–1 0.00 – 0.00
Noncontrolling interests (3) 1–2 0.00 – 0.01
Net income available to common shareholders $326 - $342 $0.77 - $0.81
(1) Reflects diluted per share basis and the operational impact if certain units were converted to common stock at the beginning of the period
(2) Net of non-controlling interests
(3) Related to gains, impairments and depreciation on operating properties, where applicable 37RECONCILIATION OF NON GAAP MEASURES
Net Income to EBITDA & Net Debt/EBITDA Calculations
38KIMCO NOTES
39You can also read