INVESTOR PRESENTATION - FEBRUARY 2018 - American Axle & Manufacturing

Page created by Gregory Barker
 
CONTINUE READING
INVESTOR PRESENTATION - FEBRUARY 2018 - American Axle & Manufacturing
INVESTOR PRESENTATION
    FEBRUARY 2018
INVESTOR PRESENTATION - FEBRUARY 2018 - American Axle & Manufacturing
Forward Looking Statements
This presentation contains forward-looking statements within the meaning of the Private Securities Litigation Reform Act of 1995. These forward-looking
statements involve certain risks and uncertainties that could cause actual results to differ materially from those expressed or implied by these
statements. These risks and uncertainties include factors detailed in the reports we file with the SEC, including those described under “Risk Factors” in our
most recent Annual Report on Form 10-K and our Quarterly Reports on Form 10-Q. These forward-looking statements speak only as of the date of this
communication. We expressly disclaim any obligation or undertaking to disseminate any updates or revisions to any forward-looking statement contained
herein to reflect any change in our expectations with regard thereto or any change in events, conditions or circumstances on which any such statement is
based.

It should also be noted that this presentation contains certain financial measures, including Adjusted EBITDA, Adjusted Earnings per Share, Adjusted Free
Cash Flow, and Net Leverage Ratio that are not required by, or presented in accordance with, accounting principles generally accepted in the United States,
or GAAP. These measures are presented here to provide additional useful measurements to review our operations, provide transparency to investors and
enable period-to-period comparability of financial performance. A description of non-GAAP financial measures that we use to evaluate our operations and
financial performance, and reconciliation of these non-GAAP financial measures to the most directly comparable financial measures calculated and reported in
accordance with GAAP, can be found in the appendix under “Reconciliation of Non-GAAP Measures”.

                                                                                                                                                                2
INVESTOR PRESENTATION - FEBRUARY 2018 - American Axle & Manufacturing
Agenda

• Diversification and Value Creation

• Technology Leadership

• Financial Highlights and Targets

• Appendix – Industry Data, 2018 Walkdowns and Non-GAAP Measures

                                                                   3
INVESTOR PRESENTATION - FEBRUARY 2018 - American Axle & Manufacturing
About AAM
                                                                                     Over

                   AAM is a premier, global leader in design, engineering,           75
                  validation and manufacturing of driveline, metal forming,     MANUFACTURING
                                                                                  FACILITIES
                    powertrain and casting technologies for automotive,
                              commercial and industrial markets

   $7B
PRO FORMA SALES

     Over         AAM is Delivering POWER through world-class quality,
    700             technology leadership and operational excellence                 17
                                                                              ENGINEERING CENTERS
  CUSTOMERS

     Over                                                         Over

 25,000                                     17
                                          COUNTRIES
                                                                  90
  ASSOCIATES                                                    LOCATIONS

                                                                                                    4
INVESTOR PRESENTATION - FEBRUARY 2018 - American Axle & Manufacturing
Driving Long-Term Shareholder Value

 SOLID FOUNDATIONAL      Concentrated in the strongest vehicle
 BUSINESS                segments of light trucks, SUVs and crossovers

 INNOVATIVE TECHNOLOGY   Focused on electrification, lightweighting, fuel
 LEADERSHIP              efficiency, and vehicle safety and performance

                                                                               Potential for
 COMPELLING GROWTH       Driven by our new business backlog, innovative          Multiple
 AND DIVERSIFICATION     advanced technologies and global footprint
                                                                                Expansion
 INDUSTRY LEADING        Fueled by powerful vertical integration,               and Share
 PROFITABILITY           productivity initiatives and operational excellence
                                                                               Appreciation

 POWERFUL CASH           Strong free cash flow yield while funding
 GENERATOR               investments in profitable growth opportunities
                                                                                               5
INVESTOR PRESENTATION - FEBRUARY 2018 - American Axle & Manufacturing
DIVERSIFICATION AND VALUE CREATION
INVESTOR PRESENTATION - FEBRUARY 2018 - American Axle & Manufacturing
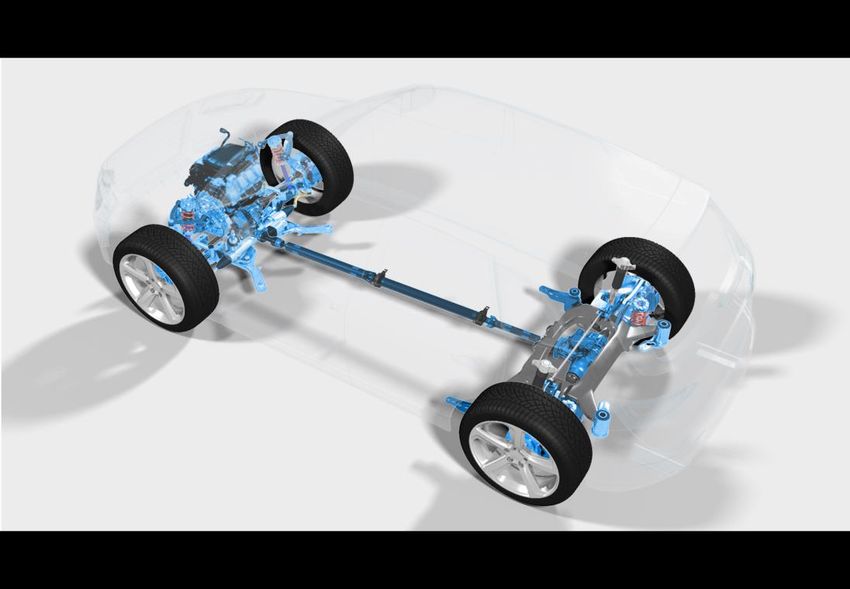
Comprehensive Solutions from Engine to Driveline
       DRIVELINE                    Our diverse product portfolio and technologies                                                                          POWERTRAIN
                                  provide continued growth and exciting cross-selling
    Rear and front axles                                                                                                                                  Transmission module and
    Rear drive modules                             opportunities                                                                                           differential assemblies
    Power transfer units                                                                                                                                  Aluminum valve bodies
    Driveshafts                                                                                                                                           Vibration control systems
    Transfer cases                                                                                                                                        Connecting rods
    Electric drive units                                                                                                                                  VVT products

      ≈ $4.0 billion                                                                                                                                        ≈ $1.1 billion
    METAL FORMING                                                                                                                                              CASTING
    Ring / pinion gears                                                                                                                                   Axle carriers
    Axle / transmission shafts                                                                                                                            Differential cases
    Differential gears                                                                                                                                    Steering knuckles
    Transmission gears                                                                                                                                    Control arms
    CVT components                                                                                                                                        Turbo charger housings
    Suspension components                                                                                                                                 Brackets

     ≈ $1.5 billion                                                                                                                                         ≈ $900 million              7
                                   *Based on estimated 2017 pro forma amounts before eliminations of intercompany sales of approximately $0.5 billion
INVESTOR PRESENTATION - FEBRUARY 2018 - American Axle & Manufacturing
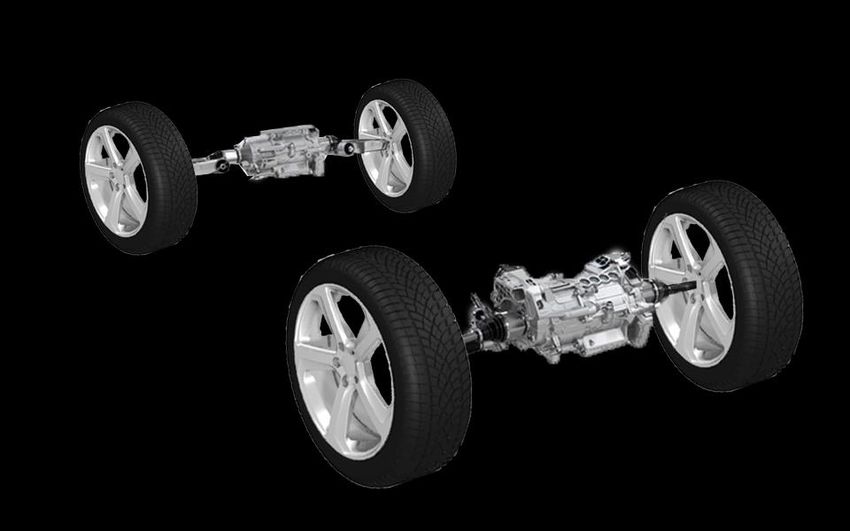
MPG Acquisition Update – 2017 Results
    Acquisition Benefit                                                                     FY 2017 Result
    Greater scale and                                     Pro forma sales of over $6.9 billion
    financial profile                                                                                                                             
    Accelerated business                                  Non-GM sales made up more than 50% of total sales
    diversification
                                                          Larger presence with commercial and industrial business as those markets
                                                                                                                                                  
                                                          strengthened in 2017
    Enhanced profitability                                AAM achieved Adjusted EBITDA* of over $1.1 billion
    and free cash flow
    generation                                            AAM generated over $340 million of Adjusted Free Cash Flow*
                                                                                                                                                  
    Synergy attainment and                                AAM recognized > $30 million of cost reduction synergies in 2017 and expects an
    value capture                                         annualized synergy attainment run rate of $73 million in January 2018                   
                                                          On track to meet our updated target of $120 million of annual run rate cost reduction
                                                          synergies by 1Q 2019 and 70% of this total by 1Q 2018
* For definitions of terms, please see the attached appendix                                                                                          8
INVESTOR PRESENTATION - FEBRUARY 2018 - American Axle & Manufacturing
Synergy Achievement Progress from MPG Acquisition
                                                              Initial Targeted
         Sources of Cost Savings                               Annual Profit           Synergy Achievement Gauge
                                                                   Impact                    (Annual Run Rate in millions)

Overhead
   Optimize operating structure                              ≈ $45 - $50 million          October
   Elimination of redundant public company costs                                   July    2017
                                                                                    2017
                                                                                            $54
Purchasing                                                                          $38
   Combine global purchasing to leverage larger scale
                                                              ≈ $45 - $50 million
   Direct and indirect material opportunities
   Insourcing initiatives

Other Cost Savings
   Manufacturing initiatives                                                                                                Updated
                                                              ≈ $10 - $20 million
   Plant loading optimization / facility rationalization                                                                    1Q 2019
                                                                                                                              Target
                                                                                                                              $120
Initial Targeted Annual Improvement                         ≈ $100-$120 million

                                       AAM is on track to achieve synergy targets                                                      9
INVESTOR PRESENTATION - FEBRUARY 2018 - American Axle & Manufacturing
AAM’s Gross New and Incremental Business Backlog
As of January 17, 2018

                                                                $1.5 BILLION: 2018-2020
                           Backlog by Vehicle Segment                                        Backlog by Global Market
         Commercial                                                                                                  South America
        and Other 5%                                                                                                  and other 5%
                                                                Passenger
                                 Full-size                      Cars 15%                        Asia 20%
                                  Light
                                Truck and
                                SUV 25%
                                                                                           Europe 15%
                                                                                                             North
                                                                Crossover                                  America 60%
                                                                 Vehicles
                                                                   55%

                       ≈80% of new business backlog relates to Non-GM business                                                       10
  * For production and sales assumptions for 2018-2020, please see the attached appendix
Continued Customer Diversification

          AAM 4Q 2017 Sales By Customer

                Other                                         Other         GM
                               GM                                           31%
                27%            42%                            27%

 Other
 Top 15                                              Other                  Ford
 Global                                              Top 15                 14%
 OEMs             FCA   Ford                         Global           FCA
  10%             14%    7%                          OEMs             15%
                                                      13%

 AAM will continue to diversify its customer concentricity through the backlog period   11
Backlog and Impact of GM’s Sourcing Decision
   As of January 17, 2018

           Dollars in Millions
                                                                                           $450 ($100-$200)*                      AAM’s gross new
                                                                $600   ($100-$200)*
                                                                                                                                  business backlog
                                                                                  ($275)                   ($225)
                                                                                                                                  Normal business
                                                                                                                                  attrition
               $450              ($150)
                                                                                                                    ≈$300 - 400   Estimated sales
                                                                                                                                  impact to AAM of
                                                   ($175)
                                                                                                                                  GM’s Next-Gen full-
                                                                                                                                  size truck sourcing
                                                                                                                                  Net impact for the
                                                                                                                                  three year period of
                                                                                                                                  2018 - 2020
                              2018                                      2019                    2020                2018-2020

          AAM’s new business backlog more than offsets attrition and the sales
            impact of GM’s next generation full-size truck program sourcing
                                                                                                                                                         12
* Utilized the mid point for the range for charting purposes.
TECHNOLOGY LEADERSHIP
Additional Electrification New Business Award

AAM’s new business award is for a rear eDrive unit     AAM expects our e-AAM products to account for
   on a high performance, hybrid passenger car       between $100 - $200 million of revenue by 2021 –
launching with a second e-AAM customer in 2020              with the potential to grow this higher

ELECTRIFICATION | Driving served market and content-per-vehicle growth for AAM
                                                                                                        14
AAM’s Capabilities for Hybrid and Electric Vehicles
          P1                                     P2                                  P3           P4

                                                                                                + Systems
                                                                                                Integration

                           Current
                          Production                                               Launching    Launching
                                                                                    eDrive in    eDrive in
 - AAM Powertrain and Driveline Content: Components and Sub-systems
                                                                                    2020         2018
 - AAM Powertrain and Driveline Content: Components and Fully integrated systems

     Content per vehicle opportunities > $2,500 for all architectures                                         15
Electric Powertrain Integrator
ICE Powertrain Components                     AAM’s AWD Electric Drive Units
                        Engine                                                                        Each unit integrates
                                          Electric Drive Unit - Rear                                   an electric motor,
                                                                                                       gear box and
                                                                                                       differential to
               Transmission                                                                            deliver power to
                                                                                                       the vehicle

                                                                                                      e-AAM products
                                                                                                       provide content-
                          Axle                                         Electric Drive Unit - Front
                                                                                                       per-vehicle
                                                                                                       opportunity of
                                                                                                       over $2,500

Note: ICE – Internal Combustion Engine.
                                                                                                                              16
Competitive Advantage in Electric Powertrains

1   Ability to engineer and integrate the electric powertrain into a single eDrive unit

2     Expertise in highly engineered components critical to eDrive performance

3   Continued commitment and investment in next generation eDrive innovations

4                       Global footprint and launch capabilities

5                          Product in the market place in 2018

                                                                                          17
QUANTUM™ Technology
AAM’s QUANTUM technology features all-new, completely
redesigned family of lightweight axles and drive units

KEY ATTRIBUTES

  Industry first technology along with a revolutionary design
                                                                     QUANTUMTM RDU w/ eLSD   QUANTUMTM Rear Axle
  Significant mass reduction (up to 35%)
  In combination, additional efficiency and weight reduction can
   deliver 1% to 1.5% improved vehicle fuel economy
  Scalable across multiple applications— without loss of
   performance or power
  Streamlined manufacturing process for key driveline components.

 Actively collaborating on QUANTUM projects with multiple customers
                                                                                                               18
AAM FINANCIAL HIGHLIGHTS AND TARGETS
4Q 2017 AAM Highlights
                                                                                     4Q FINANCIAL PERFORMANCE

                                            $1.73B                                           $296M                  $51M
                                                                                             17.1% of sales
                                              Quarterly                                       Quarterly             Adj. Free
                                               Sales                                         Adj. EBITDA*          Cash Flow*

                                                          Prepaid $200 million of                               New eDrive business
                                                           5.125% Senior Notes                                   award with second
                                                              due 2019 at par                                     e-AAM customer

                                                                                                                                      20
* For definitions of terms and non-GAAP reconciliations, please see the attached appendix.
AAM’s 2017 Financial Results
                                                                                       Full Year 2017
               AAM’s Consolidated Sales                                                  $6.27 billion
                         Adjusted EBITDA*                                                $1.103 billion
               Adjusted Free Cash Flow*                                                 $340.9 million
           Adjusted Earnings per Share*                                                        $3.75

     MPG’s pre-acquisition financial results from January 1st to April 5th are not included in AAM’s 2017 financials results.
     We incurred significant costs and payments related to restructuring, integration and acquisition-related activities as well as
      purchase accounting adjustments and related effects on the income statement during 2017. The impact of these items has been
      excluded from our Adjusted EBITDA, Adjusted free cash flow and Adjusted earnings per share amounts.

                                     We achieved record financial performance in 2017. . .
* For definitions of terms, please see the attached appendix
                                                                                                                                       21
AAM’s 2018 Financial Targets
                                                                               2018 Full Year Targets
                                         Sales                                          ≈ $7 billion
               Adjusted EBITDA* Margin                                                ≈ 17.5% - 18%
               Adjusted Free Cash Flow*                                               ≈ 5% of sales
   Based on the anticipated launch schedule of our new business backlog and our assumption that the US SAAR* is in the range of
    16.8 to 17.0 million units.
   Adjusted Free Cash Flow target assumes capital expenditures of ≈ 8% of sales. Elevated capital spending in 2018 reflects
    significant new and replacement program launches.
   We estimate approximately $50 to $75 million of restructuring and acquisition-related costs and related payments during 2018.
    The impact of these have been excluded from our Adjusted EBITDA and Adjusted Free Cash Flow targets.
   Our 2018 financial targets for the full year contemplate significant customer downtime in preparation for critical program
    changeovers and related project expense. We expect this to have the greatest impact in the first quarter of 2018.

                                                   . . . and expect another record year in 2018!                                    22
* For definitions of terms, please see the attached appendix
Free Cash Flow Generation Has Just Begun!
                 Projected Cumulative Adj. Free Cash Flow* 2017 - 2020
                                                                                  We expect to generate cumulative
                                                               > $1.5 Billion      adjusted free cash flow of over
                                                                                   $1.5 billion in the 4 year period
                                                                                   2017 – 2020
                                                                                  AAM expects Adjusted EBITDA*
                                                                                   margins to be in the range of 17%
                                                                                   to 18% of sales through 2020
                                                                                  Starting in 2019, AAM should
                                                                                   benefit from:
                    $341 Million                                                      Lower capital spending
                                                                                      Lower restructuring and
                                                                                         integration payments
                                                                                      Lower interest payments
                             2017E                               2017E - 2020E        Full run rate synergies
                                                                                                                       23
* For definitions of terms, please see the attached appendix
Capital Allocation Priorities
              Debt Paydown                                                  Organic Growth                                Others
               Plan to Delever                                              Capital Investment                      Strategic Initiatives
                          Net Leverage Ratio*                        • Support $1.5 billion in new and        • Will analyze opportunities within our
               2.9X                                                    incremental business backlog             current capital structure to:
                                                 2X                                                             • Diversify geographically
                                                                     • Constant focus of quoting and            • Expand technology leadership
                                                                       emerging opportunities on profitable     • Enhance profitability
       December
         June 30, 31,
                  20172017            December
                                    December     31, 2019
                                             31, 2017 Targettarget     growth and diversification
Maintain Appropriate Liquidity*
• > $1.4 billion at December 31, 2017                                 Research and Development                Shareholder Friendly Actions
• Target >$1 billion going forward                                   • Product, process and systems           • Will balance among other capital
     Favorable Debt Maturities                                         technology                               allocation priorities
• Prepaid $200M Notes due 2019 in 4Q 2017                            • Leverage global engineering
• Flexible prepayment options for both Senior                          capabilities
  Notes and Term Loan                                                • Focused on the global automotive
• $200M of 7.75% Notes due in 2019                                     megatrends of electrification,
• After 2019, minimal maturities until 2021                            lightweighting, and fuel efficiency
*For definitions of terms, please see the attached appendix                                                                                             24
Well Positioned in a Potential Downside Scenario
             US SAAR (units in millions)
                                                           Highly variable cost structure allows for
                                       25-30%               flexibility during periods of lower volumes
                                      downturn
      17.2
                                                           AAM has track record of reducing fixed costs
                                                            through facility and labor efficiency initiatives
                                                            during previous downside periods
                                                  ≈12

                                                           Multiple options available to manage to
                                                            additional potential change in volumes,
                                                            including SG&A, capital spending, R&D etc.

                                                           Continued synergy attainment and productivity
     2017E                            Breakeven             initiatives further reduce breakeven points

                                                                                                                25
APPENDIX – INDUSTRY DATA, 2018 WALKDOWNS AND NON-GAAP MEASURES
Production and Sales Volume Assumptions

                                                            2018             2019 - 2020
           Global Light Vehicle Production                ≈ 97M units      ≈ 2% annual growth

       North America Light Vehicle Production            ≈ 17.5M units             Flat

                      US SAAR                           16.8 – 17M units     16.5 – 17M units

           Europe Light Vehicle Production                ≈ 23M units              Flat

           China Light Vehicle Production                 ≈ 28M units      ≈ 4-5% annual growth

North America Class 5-8 Commercial Vehicle Production    ≈ 550k units              Flat

                                                                                                  28
Powertrain Projections
                                                  Global                                       North America
        Millions

                                                                        Millions
                   100
                                                                                      15
                    80
                    60                                                                10
                    40
                                                           ICE   100M                                     ICE   17M
                                                                                          5
                    20
                        0                                                                 0

                                        Greater China                                            Europe
                                                                                          25
                        35

                                                                               Millions
             Millions

                        30                                                                20
                        25
                                                                                          15
                        20
                        15
                        10                                 ICE   32M
                                                                                          10              ICE   23M
                                                                                           5
                         5
                         0                                                                 0

                             For at least the next decade, the internal combustion engine (ICE)
                                  is expected to be the main source of power for vehicles                             29
IHS Production Forecasts as of December 4, 2017
Projected LV Production Mix
IHS Forecasts as of December 4, 2017

                North America                        Europe                  China
                                       68%
                           62%                64%                                    61%
                                                                      58%
    55%                                                56%                   56%
                                                              51%
     45%                                              44%     49%
                             38%                                               44%
                                              36%
                                        32%
                                                                     42%
                                                                                     39%

    2012                   2016        2020   2012    2016    2020    2012    2016   2020

        Vehicle mix is trending favorably for AAM in all of our key markets                 30
4Q 2017 Sales Walkdown
         (in millions)

                                                                                                                                                                            $57              $1,734

                                                                                                                      $139

                                                                                                                                                         ($5)

           $1,570
                                                                                  $1,543

                                               ($27)

  Pro forma 4Q 2016                 Impact of exiting KBI             Adjusted Pro Forma 4Q              Backlog / Volume & Mix                        Pricing      Metal Market and Fx   AAM 4Q 2017
                                         business                              2016

   Nearly 9% year-over-year organic growth in 4Q 2017 on the strength of new business backlog
Pro forma sales for 4Q 2016 includes AAM sales of $947 million and MPG sales of $646 million, adjusted for the elimination of the MPG sales to AAM of $23 million                                     31
4Q Year-Over-Year Adjusted EBITDA* Walk
        (in millions)

                                                                                                                                                                               $15                               $296
                                                                              $43
                                                                                                                                                                                                   $3
                                                                                                                                                            $11
                                                                                                 ($5)
                    $271                                                                                             ($5)
                                                                                                                                        ($8)

                                                          $248

                                       ($23)

                4Q 2016 Pro      4Q 2016 MPG FX  4Q 2016 Pro Backlog / Volume Metal Market & Fx                    Pricing        Project Expense USM Acquisition MPG Acquisition              Other, net      AAM 4Q 2017
                   forma         Remeasurement forma excluding    & Mix                                                                                             Synergies
                                      Gain**     MPG FX Gain

                                                           Adjusted EBITDA margin of 17.1% in 4Q 2017
                                                                                                                                                                                                                             32
* For definitions of terms and non-GAAP reconciliations, please see the attached appendix. ** Primarily related to pre-acquisition Remeasurement of Euro Denominated Loan in MPG’s 4Q 2016 financial results
2018 Sales Walkdown
       (in millions)

                                                                                                          $450

                                                                             $6,991                                                 ($150)                                                  $7,000
                                                   ≈$725                                                                                                       ($175)
                                                                                                                                                                           ($116)

                        $6,266

                 AAM's 2017 Sales              1Q 2017 MPG              Pro Forma 2017              New Business           Expiring Programs / GM Next-Gen              Volume, Mix &   AAM's 2018 Sales
                                                                        Full Year Sales               Backlog                    Attrition     Sourcing Impact              Other           Target

                    Strong backlog offsets attrition and lower expected full-size truck volumes
                                                                                                                                                                                                           33
Note: 1Q 2017 MPG sales reflect total pre-acquisition sales of approximately $750 million adjusted for the elimination of approximately $25 million of sales to AAM
2018 Adjusted EBITDA* Walkdown
      (in millions)

                                                                                                                                                       $70
                                                                                                                                                                                     $1,243**
                                                     ≈$125                           $1,228
                                                                                                                                                                    ($30)
                                                                                                                     ($25)
                    $1,103

          AAM's 2017 Adjusted                1Q 2017 MPG Adj.                  2017 Pro forma                   Volume & Mix                      Synergies   Project Expense &   AAM's 2018 Adj.
               EBITDA                            EBITDA                                                                                                             Other          EBITDA target

                       Benefit of cost reductions synergies more than offsets margin headwinds
* For definitions of terms, please see the attached appendix   ** For charting purposes, this reflects 2018 Adj. EBITDA at midpoint of 17.5% to 18% range                                           34
Restructuring and Acquisition-Related Costs

                                                                          Expense            Cash Payments
                                                                                   (in millions)
                                                                      4Q 2017   FY 2017 4Q 2017 FY 2017
 Ongoing:
 Restructuring                                                        $    2.2 $    17.4 $    5.4 $   25.5
 Integration                                                              18.0      52.6     17.3     42.6

 Specific to Closing of Acquisition:
 Acqusition-related closing costs                                          -      40.7        0.1    41.2
 Interest payment upon the settlement of acquired company debt             -       -          -      24.6
 Settlement of pre-existing accounts payable with acquired entities        -       -          -      35.2
                                                                      $   20.2 $ 110.7 $     22.8 $ 169.1

AAM expects between $50 and $75 million of additional restructuring and acquisition-related costs
and cash payments in 2018.
                                                                                                             35
Reconciliation of Non-GAAP Measures

  In addition to the results reported in accordance with accounting principles generally
  accepted in the United States of America (GAAP) included within this presentation, we
  have provided certain information, which includes non-GAAP financial measures. Such
  information is reconciled to its closest GAAP measure in accordance with Securities
  and Exchange Commission rules and is included in the following slides.

  Certain of the forward-looking financial measures included in this presentation are
  provided on a non-GAAP basis. A reconciliation of non-GAAP forward-looking financial
  measures to the most directly comparable financial measures calculated and presented
  in accordance with GAAP is not practical given the difficulty of projecting event driven
  transactional and other non-core operating items, as well accounting adjustments
  related to recent tax reform and their related effects in any future period. The
  magnitude of these items, however, may be significant.

                                                                                             36
Supplemental Data
                                                 EBITDA and Adjusted EBITDA Reconciliation
                                                               ($ in millions)
                                                                 Three Months Ended                    Twelve Months Ended
                                                                      December 31,                           December 31,
                                                               2017                  2016             2017                  2016
   Net income                                              $      106.5          $      46.9      $     337.5        $        240.7
   Interest expense                                                55.7                 23.2            195.6                  93.4
   Income tax expense (benefit)                                   (13.1)                    4.5              2.5               58.3
   Depreciation and amortization                                  125.2                 51.4            428.5                 201.8
   EBITDA, as defined                                      $      274.3          $     126.0      $     964.1        $        594.2
   Restructuring and acquisition-related costs                     20.2                 22.2            110.7                  26.2
   Debt refinancing and redemption costs                              0.8                   __               3.5                    __

   Non-recurring items:
     Acquisition-related fair value inventory adjustment              __                    __           24.9                       __
      Other                                                           0.4                   __               (0.5)                 (1.0)
   Adjusted EBITDA                                         $      295.7          $     148.2      $    1,102.7       $        619.4
   As % of net sales                                               17.1 %               15.7 %           17.6 %                15.7 %

                                                                                                                                           37
Supplemental Data
                                     EBITDA and Adjusted EBITDA for the Trailing Twelve Months Ended December 31, 2017
                                                                       ($ in millions)
                                                                                                                                               Trailing Twelve
                                                                                        Quarter Ended                                          Months Ended
                                                             March 31,          June 30,         September 30,             December 31,         December 31,
                                                               2017              2017                   2017                  2017                  2017
Net income                                               $         78.4     $         66.3      $          86.3        $         106.5     $            337.5
Interest expense                                                   25.5               56.9                 57.5                   55.7                  195.6
Income tax expense (benefit)                                          7.5               2.4                    5.7                (13.1)                    2.5
Depreciation and amortization                                      56.1             124.6                 122.6                  125.2                  428.5
EBITDA, as defined                                       $        167.5     $       250.2       $         272.1        $         274.3     $            964.1
Restructuring and acquisition-related costs                        16.0               51.7                 22.8                   20.2                  110.7
Debt refinancing and redemption costs                                 __                2.7                    __                    0.8                    3.5
Non-recurring items:                                                                                                                                        __
   Acquisition-related fair value inventory adjustment                __              24.9                     __                    __                    24.9
   Other                                                              __                (3.8)                  2.9                   0.4                   (0.5)
Adjusted EBITDA                                          $        183.5     $       325.7       $         297.8        $         295.7     $          1,102.7
                                                                                  Pre-acquisition adjusted EBITDA from acquired entities                129.1
                                                                                                               Pro forma Adjusted EBITDA   $          1,231.8
                                                                                                                                                                   38
Supplemental Data
                                               Adjusted Earnings per Share Reconciliation
                                                                     Three Months Ended             Twelve Months Ended
                                                                        December 31,                   December 31,
                                                                    2017             2016           2017           2016
 Diluted earnings per share                                     $     0.93       $     0.59     $     3.21     $      3.06
 Restructuring and acquisition-related costs                          0.18             0.28           1.05            0.34
 Debt refinancing costs                                               0.01                __          0.03              __

 Non-recurring items:

                                                                        __                __                            __
    Acquisition-related fair value inventory adjustment                                               0.24
    Acquisition related tax adjustments                               0.01                __         (0.15)             __

    Adjustments related to the Tax Cuts and Jobs Act of 2017         (0.17)               __         (0.19)             __

    Other                                                               __                __          0.02            (0.01)
 Tax effect of adjustments                                           (0.07)            (0.09)        (0.46)           (0.09)
 Adjusted earnings per share                                    $     0.89       $     0.78     $     3.75     $      3.30

                                                                                                                               39
Supplemental Data
                                             Free Cash Flow and Adjusted Free Cash Flow Reconciliation
                                                                       ($ in millions)
                                                                                Three Months Ended                    Twelve Months Ended
                                                                                     December 31,                           December 31,
                                                                              2017                  2016             2017                  2016
Net cash provided by operating activities                               $        226.3      $         116.6      $     647.0       $         407.6

Less: Purchases of property, plant & equipment, net of proceeds from
sale of property, plant and equipment and from government grants                (198.2)                (63.3)          (475.2)               (218.5)
Free cash flow                                                          $         28.1      $          53.3      $     171.8       $         189.1

Cash payments for restructuring and acquisition-related costs           $         22.8      $              9.5   $     109.3       $              9.5
Acquisition-related settlement of pre-existing accounts payable                      __                    __                                     __
balances with acquired entities                                                                                          35.2
Interest payments upon settlement of acquired company debt                           __                    __            24.6                     __

Adjusted free cash flow                                                 $         50.9      $          62.8      $     340.9       $         198.6

                                                                                                                                                        40
Supplemental Data
                         Net Debt and Net Leverage Ratio
                                   ($ in millions)
                                                 Twelve Months Ended
                                                     December 31,
                                                        2017
             Current portion of long-term debt   $               5.9
             Long-term debt, net                            3,969.3
             Total debt, net                                3,975.2
             Less: Cash and cash equivalents                   376.8
             Net debt at end of period           $          3,598.4
             Pro forma Adjusted EBITDA           $          1,231.8

             Net Leverage Ratio                                  2.9

                                                                       41
Supplemental Data
           Pro forma EBITDA and Adjusted EBITDA Reconciliation for Fourth Quarter of 2016
                                                     ($ in millions)
                                                               AAM                MPG           PRO FORMA
Net income                                                $            46.9   $      16.8   $         63.7
Interest expense                                                       23.2          25.4             48.6
Income tax expense                                                      4.5          11.1             15.6
Depreciation and amortization                                          51.4          55.7            107.1
EBITDA                                                    $        126.0      $     109.0   $        235.0
Restructuring and acquisition-related costs, debt
refinancing and redemption costs and non-recurring                     22.2          13.4             35.6
Adjusted EBITDA                                           $        148.2      $     122.4   $        270.6

                                                                                                             42
Supplemental Data
               Pro forma EBITDA and Adjusted EBITDA Reconciliation for Full Year of 2016
                                                      ($ in millions)
                                                                AAM                MPG           PRO FORMA
 Net income                                                $        240.7      $      96.9   $        337.6
 Interest expense                                                       93.4         103.5            196.9
 Income tax expense                                                     58.3          38.4             96.7
 Depreciation and amortization                                      201.8            221.3            423.1
 EBITDA                                                    $        594.2      $     460.1   $      1,054.3
 Restructuring and acquisition-related costs, debt
 refinancing and redemption costs and non-recurring                     25.2          24.7             49.9
 Adjusted EBITDA                                           $        619.4      $     484.8   $      1,104.2

                                                                                                              43
Definition of Non-GAAP Measures
EBITDA and Adjusted EBITDA
We define EBITDA to be earnings before interest expense, income taxes, depreciation and amortization. Adjusted EBITDA is defined as EBITDA excluding the impact of restructuring and acquisition-related
costs, debt refinancing and redemption costs, and non-recurring items. We believe that EBITDA and Adjusted EBITDA are meaningful measures of performance as they are commonly utilized by management
and investors to analyze operating performance and entity valuation. Our management, the investment community and the banking institutions routinely use EBITDA and Adjusted EBITDA, together with other
measures, to measure our operating performance relative to other Tier 1 automotive suppliers. We also use Segment Adjusted EBITDA as the measure of earnings to assess the performance of each segment
and determine the resources to be allocated to the segments. EBITDA and Adjusted EBITDA should not be construed as income from operations, net income or cash flow from operating activities as
determined under GAAP. Other companies may calculate EBITDA and Adjusted EBITDA differently.
Other Non-recurring Items
For the three months ended December 31, 2017, other non-recurring items reflect the impact of a non-cash pension settlement charge related to one of our foreign entities. For the twelve months ended
December 31, 2017, other non-recurring items also reflect the impact of a gain related to the change of our method of accounting for indirect inventory and the interest expense for the debt drawdown period
prior to acquisition funding requirement. For the twelve months ended December 31, 2016, other non-recurring items reflect the impact of an investment gain related to the final distribution of the Reserve
Yield Plus Fund.
Adjusted Earnings per Share
We define Adjusted earnings per share to be diluted earnings per share excluding the impact of restructuring and acquisition-related costs, debt refinancing and redemption costs, and non-recurring items,
including the tax effect thereon. We believe Adjusted earnings per share is a meaningful measure as it is commonly utilized by management and investors in assessing ongoing financial performance that
provides improved comparability between periods through the exclusion of certain items that management believes are not indicative of core operating performance and which may obscure underlying
business results and trends. Other companies may calculate Adjusted earnings per share differently.
Free Cash Flow and Adjusted Free Cash Flow
We define free cash flow to be net cash provided by operating activities less capital expenditures net of proceeds from the sale of property, plant and equipment and from government grants. Adjusted free
cash flow is defined as free cash flow excluding the impact of cash payments for restructuring and acquisition-related costs, settlements of pre-existing accounts payable balances with acquired entities, and
interest payments upon the settlement of acquired company debt. We believe free cash flow and Adjusted free cash flow are meaningful measures as they are commonly utilized by management and investors
to assess our ability to generate cash flow from business operations to repay debt and return capital to our stockholders. Free cash flow and Adjusted free cash flow are also key metrics used in our
calculation of incentive compensation. Other companies may calculate free cash flow and Adjusted free cash flow differently.
Net Debt and Net Leverage Ratio
We define net debt to be total debt, net less cash and cash equivalents. We define Net Leverage Ratio to be net debt divided by the trailing 12 months of pro forma Adjusted EBITDA. Pro forma Adjusted
EBITDA includes AAM's Adjusted EBITDA and the pre-acquisition EBITDA of acquired entities. We believe that Net Leverage Ratio is a meaningful measure of financial condition as it is commonly used by
management, investors and creditors to assess capital structure risk. Other companies may calculate Net Leverage Ratio differently.
Liquidity
We define Liquidity as cash on hand plus amounts available on our revolving credit facility and foreign credit facilities.
US SAAR
                                                                                                                                                                                                                  44
We define US SAAR as the seasonally adjusted annual rate of light vehicle sales in the United States
You can also read