Commercial Real Estate Trends & Outlook - National Association of REALTORS Research Group - National ...
←
→
Page content transcription
If your browser does not render page correctly, please read the page content below
Commercial Real Estate
Trends & Outlook
National Association of REALTORS® Research Group
COMMERCIAL REAL ESTATE TRENDS & OUTLOOK
July 2020 Report

 The Commercial Real Estate Trends & Outlook Report discusses trends in the small
 commercial market (transactions that are typically less than $2.5 million) based on a
 survey of members of the National Association of Realtors® engaged in commercial
 real estate about their transactions in the second quarter of 2020.

 Across the multifamily, industrial, office, retail, and hotel sectors, REALTORS®
 reported a decline in sales and leasing transactions, a decline in sales prices, and an
 increase in vacancy rates, with retail and hotel suffering the heaviest blow from the
 coronavirus pandemic. Industrial and multifamily remain as the strongest legs of the
 commercial real estate market, in both transactions for structures and land. The
 office market is also impacted, but it is in the middle-of-the-pack in terms of the
 impact. Commercial sales among REALTORS® fell 5% year-over-year in in 2020 Q2.
 Sales prices were also down by 3%. Leasing volume fell by 4% , and construction was
 down 5%.

 Looking ahead in the next quarter, leasing volume in multifamily properties will likely
 remain unchanged or decline modestly in 2020 Q3 compared to the volume in the
 second quarter. Realtors® expect multifamily vacancy rates to hover at around 8%
 in the next three months. In metro areas where rental vacancy rates are low, rents
 will remain firm. In the office market, sales, leasing, and net absorption will likely
 contract mildly in 2020 Q3 given the massive loss in occupancy that has already
 occurred in the second quarter. Realtors® expect vacancy rates to continue to hover
 at 15% and will remain elevated until employment gets back to the pre-pandemic
 level. The industrial market is arguably the strongest leg of the commercial real
 estate market, and Industrial properties will remain in demand given the constant
 growth in e-commerce and as physical retail locations continue to attract and retain
 consumers via online shopping and delivery. REALTORS® expect vacancy rates in
 the warehouse spaces to average 8% in the coming quarter. Retail, after nearly
 coming to a complete stop, is starting to show signs of recovering, but some
 restrictions put in place to minimize human contact (i.e. operating at only 25%) will
 keep vacancy rates elevated. REALTORS® expect vacancy rates to remain elevated
 in the third quarter, at 20% among retail strip centers and free-standing stores, with
 much higher vacancy rates for malls, at 35%.

 Enjoy reading the latest report! Feel free to share and use the data with proper
 citation.
COMMERCIAL REAL ESTATE TRENDS & OUTLOOK
July 2020 Report

    Page   4    Commercial Sales and Prices

           6    Land Market

           7    Cap Rates

           8    Leasing

           9    Vacancy Rates

           10   Construction

           11   Multifamily Outlook

           12   Office Outlook

           13   Industrial Outlook

           14   Retail Outlook

           15   Realtors® Market Expectation

           16   About the Survey
1 | COMMERCIAL SALES
Commercial Sales of REALTORS® Declined
5% in 2020 Q2
Sales transactions volume among
Quarterly Sales Volume (YoY % Chg.)
REALTORS® fell on average by 5% year-
over-over in the second quarter of 2020
according to members of the National 150%
Association of REALTORS® who responded
to NAR’s 2020 Q1 Commercial Real Estate 100%
Quarterly Market Survey. NAR commercial
members’ transactions are typically below 50%
$2.5 million (small commercial market). -5%
Sales transactions volume of properties or 0%
portfolios of at least $2.5 million (middle to
large commercial market) plunged 68%
-50%
year-over-year, according to Real Capital
Analytics. -68%
-100%
2010
2012
2018
2019
2011
2013
2014
2015
2016
2017
2020.Q2
2009
2020.Q1
The largest pullback in sales of commercial
REALTORS® were in the office real estate
market (-7%), retail strip center and malls, REALTOR® CRE Markets
and hotel/hospitality properties. Sales of $2.5+M Market
apartment properties and industrial
properties were down year-over-year by 4%. Sources: National Association of REALTORS®, Real Capital Analytics
Land sales were down 3%.
Commercial Transactions of REALTORS® n 2020 Q2 by Property Type
(YoY % Chg.)
-2.6%
-3.9% -3.8%
-4.3% -4.3% -4.3%
-5.9%
-6.9% -6.7% -6.7%
-7.3% -7.0%
NATIONAL ASSOCIATION of REALTORS® | RESEARCH GROUP | www.nar.realtor/research-and-statistics
42 | COMMERCIAL SALES
Commercial Prices Fell 4% in Small Commercial
Real Estate Market
Commercial prices in markets where Commercial Sales Prices (YoY % Chg.)
commercial members of the National
Association of REALTORS® are engaged in 30%
declined 3% year-over-year in 2020 Q2. These
markets are typically below $2.5 million (small 20%
commercial market). Among transactions of at 10%
least $2.5 million, commercial prices were still 0%
3.6%
up nearly 4%, according to Real Capital -3.4%
Analytics, but this is a slower increase -10% -9%
compared to pre-coronavirus period (6% y/y in -20%
January 2020). Commercial properties held by
-30%
REITS declined in 9% year-over-year, according
to the Green Street Commercial Property Price -40%
2017.Q4
2016.Q2
2011.Q1
2011.Q4
2013.Q2
2018.Q3
2009.Q3
2015.Q3
2020.Q1
2010.Q2
2008.Q4
2017.Q1
2014.Q4
2012.Q3
2014.Q1
2019.Q2
Index.
Commercial property prices in the small
commercial market where REALTORS® REALTOR® CRE Markets
typically engage in were down across all
$2.5M+ Market
commercial property types, with the largest
Green Street Commercial Property Price Index
decline in hotel (-7%), retail (-6%), and office
(-5%). Price for apartments were typically down
by 2%. Industrial commercial real estate prices
fell the least by about 1% year-over-year.
Commercial Sales Prices in 2020 Q2 by Property Type
(YoY % Chg.)
-0.6% -0.4%
-1.6% -1.5% -1.3%
-2.9%
-3.4%
-4.5% -4.4%
-5.4%
-6.3%
-6.8%
NATIONAL ASSOCIATION of REALTORS® | RESEARCH GROUP | www.nar.realtor/research-and-statistics 53 | LAND MARKET
Residential and industrial land sales* up while office/retail/hotel land sales down
While sales of land for office/retail/hotel use have slumped, sales of residential and industrial
land each rose about 3% year-over-year in 2020 Q2. Sales of cultivable, irrigated, agricultural
and ranch lands were also about 1% to 2% year-over-year. However, recreation, timber, and
brownfield land sales declined compared to one year ago.
With strong demand for residential land, prices also rose the strongest, at 3%. Prices of land for
office/retail/hotel use were 1% below last year’s level.
Land Sales of REALTORS® in 2020 Q2 by Property Type (YoY % Chg.)
For Residential (developed) 3.4%
For Industrial (developed) 2.6%
Other types of land 2.5%
Agricultural, cultivable non-irrigated 1.5%
Agricultural, cultivable irrigated 1.1%
Ranch 1.0%
Recreation -0.3%
Development-Greenfield -0.5%
Timber -0.8%
For Office/retail/hotel (developed) -1.3%
Development-Brownfield -1.8%
Commercial Land Sales Prices in 2020 Q2 by Property Type (YoY % Chg.)
For Residential (developed) 3.3%
For Industrial (developed) 1.6%
Other types of land 1.6%
Ranch 1.5%
Agricultural, cultivable irrigated 1.4%
Recreation 1.3%
Timber 1.1%
Agricultural, cultivable non-irrigated -0.2%
Development-Greenfield -0.2%
Development-Brownfield -0.9%
For Office/retail/hotel (developed) -1.0%
* A land transaction is any transaction where the value of the land, including improvements that are agricultural in nature,
accounts for at least 51% of the total sale of the transaction.
NATIONAL ASSOCIATION of REALTORS® | RESEARCH GROUP | www.nar.realtor/research-and-statistics 64 | CAP RATES
Cap Rate T-bond Spread Rose to 6% in 2020 Q2
Cap Rates in 2020 Q2
Cap rates for transactions in the second quarter Office: Class A 7.0
of 2020 reported by NAR commercial members
averaged 6.9%. The average cap rate in the large Office: Class B/C 7.5
commercial market ($2.5 million or more Industrial: Warehouse 7.0
transactions) reported by Real Capital Analytics
Industrial: Flex 7.0
was 6.7%.
Apartment: Class A 5.5
In the small commercial real estate market Apartment: Class B/C 6.0
where most REALTORS® engage in, office
Hotel/Hospitality 7.5
properties had the highest cap rate, at 7 to 7.5%.
Apartment Class A had the lowest cap rate, at Senior housing 6.5
5.5%. Land 7.0
Source: 2020 Q2 NAR CRE Market Survey
The risk spread (cap rate less 10-year T bond
rate) increased to about 6% in the second For $2.5 million or less properties
quarter of 2020 from just 4% in the first quarter
of 2019 in both the small and medium-to-large
commercial real estate properties, an indication
of the perceived riskiness of holding commercial
Cap Rates Less 10-Year T-Bond
real estate.
8.0%
Lender Appraisal Values Fall Below REALTORS® 6.2%
6.0%
Market Assessment
4.0%
On average, REALTORS® reported that lenders
had a lower appraisal value compared to their 2.0%
market assessment of the value of these 0.7%
0.0%
properties. Retail and hotel appraised values
2010.Q1
2016.Q4
2017.Q3
2018.Q2
2011.Q3
2013.Q4
2015.Q2
2016.Q1
2013.Q1
2010.Q4
2014.Q3
2019.Q1
2019.Q4
2012.Q2
were on average 5% below the market value
assessment of REALTORS®, Industrial properties
and apartments were appraised by lenders at Less than $2.5M market
about 1% on average below market values $2.5M or more market
assessment of REALTORS®. The lower 10-yr T-bond
assessment values of lenders indicate a larger
perception of the riskiness of the asset among
lenders.
Average Difference Between Lender Appraisal Values and REALTORS® Assessment of
Market Values
-1% -1% -1% -1%
-1% -1%
-2%
-3% -2%
-3%
-5% -5%
NATIONAL ASSOCIATION of REALTORS® | RESEARCH GROUP | www.nar.realtor/research-and-statistics 75 | COMMERCIAL LEASING
REALTORS® Leasing Volume Fell 4% in
REALTORS® Commercial Leasing
2020 Q2
Volume (YoY % Chg.)
REALTORS® who responded to the 20%
survey reported that their gross leasing 15%
10%
volume (renewals and new leases)
5%
declined by 4% year-over-year in 2020 0%
Q2. -5%
-10% -4%
-15%
Leasing volume was down 7% to 10% at
-20%
retail malls and down 1% to 2% for -25%
apartment and industrial properties. -30%
Industrial warehouses had the least
2020.Q2
2012
2019
2010
2011
2013
2014
2015
2016
2017
2018
2009
2020.Q1
decline in leasing volume of 1%, as e-
commerce continues to make further
inroads into the brick-and-mortar Sources: National Association of REALTORS®, Real Capital Analytics
market.
Sales/leasing/development in a
Slightly more than half of respondents
suburban area compared to January
reported that they are not yet seeing any 2020 (distribution of responses)
suburban/urban area shift, but 23%
reported they are seeing more suburban
development.
More, 23% Less, 25%
About the
same, 53%
Leasing Volume in 2020 Q2 by Property Type (YoY % Chg.)
0%
-2%
-1%
-3% -3% -2%
-4%
-6% -5%
-5%
-8% -7%
-8%
-10%
-12% -10%
NATIONAL ASSOCIATION of REALTORS® | RESEARCH GROUP | www.nar.realtor/research-and-statistics 86 | VACANCY RATES
Average Vacancy Rate Reported by
REALTORS® Reported 25% Vacancy Rate in
REALTORS®
2020 Q2
30.0%
REALTORS® reported that vacancy rates 25%
25.0%
increased in all markets in 2020 20, to an
average of 25%. 20.0%
15.0%
On average, the hotel vacancy rate spiked
to 73%, retail vacancy rate to 20%, and 10.0%
office vacancy rate to 15%. The lowest
vacancy rates were in multifamily, at 8%, 5.0%
and industrial properties, at 10%. 0.0%
2011.Q3
2016.Q1
2016.Q3
2018.Q3
2011.Q1
2013.Q1
2015.Q1
2013.Q3
2015.Q3
2018.Q1
2020.Q1
2017.Q1
2017.Q3
2010.Q1
2010.Q3
2012.Q3
2014.Q1
2014.Q3
2019.Q3
2012.Q1
2019.Q1
Vacancy rates have increased In the office
market, with more workers working from
home. Seventy-three percent of
respondents reported observing an
increase in co-working, alternating, or Respondents Who Reported Observing
staggered job schedules. or Implementing Alternating, Staggered,
Work-from home Schedules
Less, 4%
About the
same, 25%
More, 71%
Vacancy Rates
73%
25%
20%
15%
10% 9% 9% 10% 8% 7%
5% 4%
Hotel Retail Office Industrial Multifamily Average
2020.Q1 2020.Q2
NATIONAL ASSOCIATION of REALTORS® | RESEARCH GROUP | www.nar.realtor/research-and-statistics 97 | CONSTRUCTION
Respondents Expect Project Delays
REALTORS® Reported 5% Decline in
Construction Activity in 2020 Q2 12% 16%
REALTORS® reported on average a 5%
year-over-year decline in their construction
activity (in square feet) in 2020 Q2.
22%
Eighty-four percent of respondents
reported that they expect their projects to
be delayed, with 12% reporting more than
six months. 50%
Half of respondents reported that getting
permits on time was the major cause of No delay Up to 3 months
delay, followed by obtaining construction Up to 6 months More than 6 months
materials. Issues with hiring workers was
cited by 39% of respondents. ‘Other’
causes of delay included work restrictions, Percent of Respondents Who Reported
sick workers, and physical constraints that These Causes of Delay
made social distancing impossible on the
construction site.
Getting permits 54%
Obtaining construction
43%
materials
Hiring workers 39%
Obtaining lender financing 36%
Other 14%
Construction Projects (in sq. ft) in 2020 Q2 by Property Type (YoY % Chg.)
4%
1%
-5%
-6%
-8% -8% -8% -7%
-9%
-11%
-12%
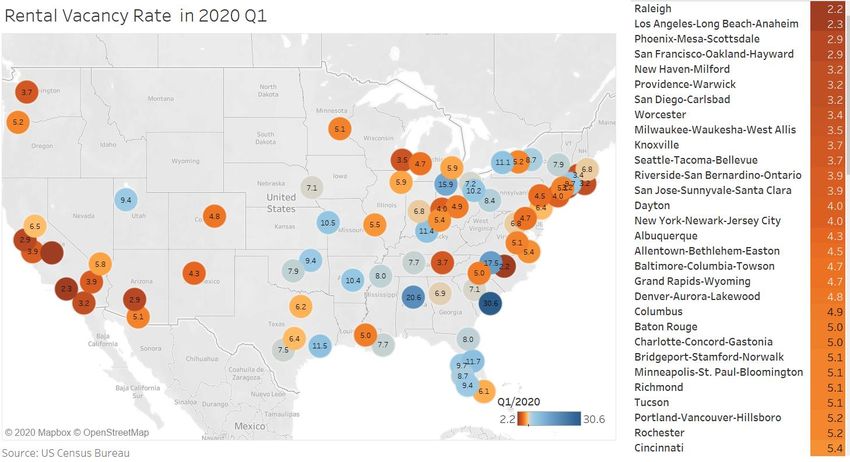
NATIONAL ASSOCIATION of REALTORS® | RESEARCH GROUP | www.nar.realtor/research-and-statistics 108 | COMMERCIAL OUTLOOK:MULTIFAMILY Leasing volume in multifamily properties will likely remain unchanged or decline only modestly in 2020 Q3 compared to the volume in the second quarter. Net absorption will also likely move sideways. Jobs have started to recover, but the recovery will face headwinds with the surge in coronavirus cases that will impact retail trade, food services, leisure and hospitality workers. Workers in these sectors tend to be renters than homeowners (51% of food service workers are homeowners and only 58% of housekeeping and personal care workers are homeowners, well below the national rate of 64%). The $600 weekly benefit has also helped make up for lost wages, but this expires on July 31 and there is ongoing discussion in Congress on the extension of this funding for this program and the amount of the funding, which includes replacing the $600 weekly benefit with an amount that is a fraction of lost wages to incentivize people to go back to work. The U.S. rental vacancy rate stood at 6.6% in 2020 Q2, but Realtors® reported on average an 8% vacancy rate on the properties they leased or managed. Realtors® expect multifamily vacancy rates to hover at around 8% in the next three months. Metro areas with low vacancy rates will see firm rent growth, Many areas have vacancy rates below 4%, such as Raleigh, Los Angeles , Phoenix, San Francisco, San Diego, Riverside, Worcester, New Haven, Providence, Seattle, Knoxville, Dayton, and New York. Realpage reported that among the nation’s 50 largest apartment markets, 34 recorded more new lease signings in June 2020 than in June 2019, such as in Atlanta, Boston, Chicago, Denver, Houston, Las Vegas, Los Angeles, Miami, New York, Orlando, Phoenix, San Diego and Washington, DC. Bottomline: the multifamily market will remain one of the strong legs of commercial real estate, along with industrial real estate. NATIONAL ASSOCIATION of REALTORS® | RESEARCH GROUP | www.nar.realtor/research-and-statistics 11
8 | COMMERCIAL OUTLOOK:OFFICE
Sales, leasing, and net absorption will likely contract mildly in 2020 Q3 given the massive loss in
occupancy that has already occurred in the second quarter, with negative net absorption of 8.4 million
square feet from January to May 20201 (roughly the size of 200 football fields, or 4 football fields, per
state). In 2020 Q2 alone, the net occupancy loss was 14 million square feet. Nearly 5 million square
foot of space for sublease became available. These subleases are for co-working spaces, with about a
third of the loss arising from the loss of technology occupiers in the metro areas of New York, San
Francisco, Orlando, Charlotte, Denver, and Pittsburgh.1

Office-using jobs have come back, but about half are in the day-to-day operations of maintaining
office buildings, while jobs in computer systems design and related services have not recovered.
Moreover, jobs that are created won’t necessarily be office-using if workers work from home. A
Gartner survey revealed that 74% of employers plan to shift at least 5% of their workforce to
permanently remote positions.

REALTORS® expect vacancy rates to continue to hover at 15%, unchanged from the level in the
second quarter.

In the short-term (no vaccine has been discovered), suburban office spaces are likely to be more in
demand than CBD office spaces, due to the price differential (office CBD is nearly twice as expensive
as suburban CBD), and the increasing preference for the suburban living. Suburban office spaces have
increasingly taken a larger share of the market since 2014, with CBD sales now accounting for just 36%.

Bottomline: Vacancy rates will remain elevated until jobs fully recover and depending on how much of
newly created jobs will be occupying office space. Demand for suburban office space is likely to be
stronger than demand for CBD office space, sustaining a trend even before the pandemic.

          Office-using Jobs ('000)                                                                                      466,000 Net New Office-Using Jobs in May and June
                                                                                                                                              2020

                                                                                                                                            211.6   Employment Services
34,000                                                                                                                              117.7           Services To Buildings & Dwellings
33,500                                                                                                                        51                    Accounting & Bookkeeping Services
33,000                                                                                                                       42.2                   Other Professional & Technical Services
                                                                                                                          18.1                      Management & Technical Consulting Services
32,500
                                                                                                                          16.4                      Architectural & Engineering Services
32,000                                                                                                                    14.5                      Legal Services
 31,500                                                                                                                  11.5                       Business Support Services
 31,000                                                                                                                  10.7                       Other Support Services
                                                                                                                         7                          Scientific Research & Development Services
30,500
                                                                                                                        5.6                         Specialized Design Services
30,000                                                                                                                  4.9                         Investigation & Security Services
29,500                                                                                                                  2.2                         Facilities Support Services
29,000                                                                                                                  1.9                         Advertising & Related Services
28,500                                                                                                                  1.8                         Office Administrative Services
                                                                                                                   -2                               Waste Management & Remediation Services
           Jan/2019

                                 May/2019

                                                       Sep/2019

                                                                                        Mar/2020
                                            Jul/2019
                      Mar/2019

                                                                  Nov/2019
                                                                             Jan/2020

                                                                                                   May/2020

                                                                                                                 -7.2                               Management of Companies & Enterprises
                                                                                                               -14.4                                Travel Arrangement & Reservation Services
                                                                                                              -27.5                                 Computer Systems Design & Related Services

                                                                                                                Source: BLS Establishment Survey

     1 JLL Research 2020 Q2 Outlook

 NATIONAL ASSOCIATION of REALTORS® | RESEARCH GROUP | www.nar.realtor/research-and-statistics                                                                                       12
8 | COMMERCIAL OUTLOOK:INDUSTRIAL
Industrial properties may remain in demand given the constant growth in e-commerce and as physical
retail locations continue to attract and retain consumers via online shopping and delivery. The
acceleration towards e-commerce via the coronavirus may be a permanent shift that can only be a
benefit to e-commerce sales which underpins the demand for warehousing space and employment.
The industrial sector displayed its durability and importance as it was not affected as much as other
sectors and was one of the strongest sectors throughout the pandemic. As the economy traverses the
coronavirus pandemic en route to an eventual complete recovery, the industrial sector’s growth
should continue.
REALTORS® expect vacancy rates in the warehouse spaces to average 8% in the coming quarter.
Warehousing and Storage Employees YTD, SA Thousands
1240
1220
1200
1194
1180
1160
1140
1134
1120
1100 1121
1080
1060
Jan/2020 Feb/2020 Mar/2020 Apr/2020 May/2020 June/2020
Nonstore Retailers, SA Millions
$90
$80 83
79
$70
$60
$50
$40
$30
$20
$10
$0
Jan-20 Feb-20 Mar-20 Apr-20 May-20 Jun-20
Nonstore Retailers Elect. Shopping & M/O Houses
NATIONAL ASSOCIATION of REALTORS® | RESEARCH GROUP | www.nar.realtor/research-and-statistics 138 | COMMERCIAL OUTLOOK:RETAIL
Retail, after nearly coming to a complete stop is starting to show signs of recovering as the economy
begins to reopen, albeit is phases according to various state guidelines. As retail reopens in phases,
there are some restrictions put in place to minimize human contact i.e. operating at only 25%, 50%, etc.
capacity. As states go deeper into various state reopening phases, retail foot traffic may increase. But,
the retail sales lost during the pandemic will not be recovered anytime soon. When retail does recover
it may not look the same as consumer spending habits changed through the pandemic. This coupled
with permanent retail closures, we could see vacant retail being repurposed as apartments,
warehousing or another use.
The increasingly popular food delivery sector, especially throughout the coronavirus pandemic, is
facing consolidation as Uber offered to purchase Postmates for $2.6 billion in June. This came off of
the heels of Uber’s failed attempt to acquire Grubhub for whom was acquired by Europe’s Just Eat
Takeaway for $7.3 billion in June as well. Should the deal be executed, it would add to Uber’s current
delivery business, Uber Eats which grew throughout the coronavirus pandemic.
Just as food delivery demand grew, the ghost kitchen concept gained further traction as well. Already
on the rise in deal amount and transactions in recent years, ghost kitchens offered operators a revenue
stream when traditional dine-in operations ceased as a result of the pandemic and as such, expansions
were realized. Ghost kitchen investment is increasing such as investment in Zuul, whom raised $9
million to expand operations in NYC or Wingstop, whom recently opened their first ghost kitchen in
Dallas, Texas as they pivoted from 80% to 100% off-premise operations originating from closing its
dining rooms in March 2020 which was at the beginning of COVID-19. In consideration of the realized
and expected growth of food delivery services, ghost kitchen investment shall continue provided the
demand for on-demand food delivery continues.
REALTORS® expect vacancy rates to remain elevated in the third quarter, at 20% among retail strip
centers and free-standing stores, with much higher vacancy rates for malls, at 35%.
2020 Total Monthly Sales for Retail and Food Services
600000
500000 524,306
531,643 527,273 487,708
483,476
Millions $
400000
412,766
300000
200000
100000
0
January February March April May June
NATIONAL ASSOCIATION of REALTORS® | RESEARCH GROUP | www.nar.realtor/research-and-statistics 148 | COMMERCIAL OUTLOOK
REALTORS® Expect Land, Industrial, and Apartment Real Estate Market to Perform Better than
Office, Retail, and Hotel
3-Month Sales Outlook 3-Month Commercial Price Outlook
(Y/Y Change) (Y/Y Change)
1% Land -1% Industrial: Warehouse
-1% Industrial: Warehouse -1% Industrial: Flex
-1% Apartment Class B/C -2% Land
-2% Industrial: Flex -2% Apartment Class B/C
-2% Apartment Class A -2% Apartment Class A
-3% Senior housing -2% Senior housing
-4% Office Class B/C -5% Retail: Free-standing
-4% Retail: Free-standing -5% Office Class B/C
-5% Office Class A -6% Office Class A
-5% Hotel/Hospitality -6% Retail: Strip Center
-6% Retail: Strip Center -8% Hotel/Hospitality
-7% Retail: Mall -8% Retail: Mall
Expected Vacancy Rates in 2020 Q3 3-Month Construction Outlook
(Y/Y Change)
Apartment Class B/C 7%
Industrial: Warehouse 7%
Industrial: Warehouse 8%
Industrial: Flex 7%
Apartment Class A 9%
Retail: Free-standing 1%
Industrial: Flex 10%
Apartment Class A 1%
Office Class B/C 15%
Retail: Strip Center -2%
Office Class A 15%
Apartment Class B/C -2%
Retail: free-standing 20%
Office Class A -5%
Retail: Strip Center Class A 20%
Office Class B/C -7%
Retail: Mall 35%
Retail: Mall -10%
Hotel 50%
NATIONAL ASSOCIATION of REALTORS® | RESEARCH GROUP | www.nar.realtor/research-and-statistics 159 | ABOUT THE SURVEY
NAR’s Quarterly Market Survey gathers information about the commercial transactions
of REALTORS® and members of affiliate organizations (CCIM, SIOR, RLI, IREM, and the
Counselors of Real Estate) and the opportunities and challenges facing commercial
practitioners.
The 2020 Q2 survey was sent to approximately 76,000 commercial REALTORS® and
members of affiliate organizations during July 5–16, 2020, of which 1,056 responded to
the survey. A Leasing Conditions Survey was also sent out to all 76,000 commercial
REALTORS® and members of affiliate organizations during July 1-13, of which 1,613 were
engaged in leasing and property management and filled out the survey.
Number of Respondents
1984
397
231
33 39 99
ALC: (REALTORS® CCIM: (The CCIM CPM®: (Institute of CRE™: (Counselor of SIOR: (Society of No designation from
Land Institute) Institute) Real Estate Real Estate™) Industrial and Office these NAR affiliated
Management) REALTORS®) councils, institutes,
societies
NATIONAL ASSOCIATION of REALTORS® | RESEARCH GROUP | www.nar.realtor/research-and-statistics 16COMMERCIAL REAL ESTATE TRENDS & OUTLOOK July 2020 NAR RESEARCH GROUP Lead Team Research and Analysis LAWRENCE YUN, PhD Chief Economist & Senior Vice President for Research GAY CORORATON Senior Economist & Director of Housing and Commercial Research BRANDON HARDIN Research Economist Editing, Survey Deployment, and Communication JESSICA LAUTZ, Doctor of Real Estate Vice President, Demographics and Behavioral Insights MEREDITH DUNN Manager, Research ANNA SCHNERRE Research Associate, Business Insights The NAR Research Group acknowledges the I/S/Cs for reaching out to their members to respond to the survey and developing the survey: Aubrie Kobernus, CEO, Realtors® Land Institute; Denise LeDuc-Froemming, CEO/EVP, IREM; Alexis Fermanis, Communications Director, SIOR; and Greg Fine, CEO/EVP, CCIM Institute. The Research Group also acknowledges Charlie Dawson, Vice-President, Engagement, and Rodney Gansho, Director of Engagement, in reaching out to CCIM, CRE, IREM, SIOR, and RLI designees to respond to the survey. ©2020 National Association of REALTORS® All Rights Reserved. May not be reprinted in whole or in part without permission of the National Association of REALTORS®. For question about this report or reprint information, contact data@realtors.org. Download report at: https://www.nar.realtor/commercial-real-estate-market-survey
The National Association of REALTORS® is America’s largest trade association,
representing more than 1.4 million members, including NAR’s institutes, societies and
councils, involved in all aspects of the real estate industry. NAR membership includes
brokers, salespeople, property managers, appraisers, counselors and others engaged in
both residential and commercial real estate. The term REALTOR® is a registered
collective membership mark that identifies a real estate professional who is a member of
the National Association of REALTORS® and subscribes to its strict Code of Ethics.
Working for America's property owners, the National Association provides a facility for
professional development, research and exchange of information among its members
and to the public and government for the purpose of preserving the free enterprise
system and the right to own real property.

NATIONAL ASSOCIATION OF REALTORS®
RESEARCH GROUP

The Mission of the NATIONAL ASSOCIATION OF REALTORS® Research Group is to
produce timely, data-driven market analysis and authoritative business intelligence to
serve members, and inform consumers, policymakers and the media in a professional and
accessible manner.

To find out about other products from NAR’s Research Group, visit
www.nar.realtor/research-and-statistics

500 New Jersey Avenue, NW
Washington, DC 20001
202.383.1000
You can also read