CAGE Conference March 20, 2017 - Cott Corporation

Page created by Jon Schwartz
 
CONTINUE READING
CAGE Conference March 20, 2017 - Cott Corporation
CAGE Conference
 March 20, 2017
CAGE Conference March 20, 2017 - Cott Corporation
Safe Harbor Statements
  Forward Looking Statements: This presentation contains forward-looking statements within the meaning of Section 27A of the Securities
  Act of 1933, Section 21E of the Securities Exchange Act of 1934 and applicable Canadian securities laws conveying management's
  expectations as to the future based on plans, estimates and projections at the time the Company makes the statements. Forward-looking
  statements involve inherent risks and uncertainties and the Company cautions you that a number of important factors could cause actual
  results to differ materially from those contained in any such forward-looking statement. The forward-looking statements contained in this
  presentation include, but are not limited to, statements related to expected future operating results of the Company, anticipated market
  trends, and the execution of the Company’s strategy. The forward-looking statements are based on assumptions regarding management's
  current plans and estimates. Management believes these assumptions to be reasonable but there is no assurance that they will prove to
  be accurate. Factors that could cause actual results to differ materially from those described in this presentation include, among others:
  (1) changes in estimates of future earnings; (2) expected synergies and cost savings are not achieved or achieved at a slower pace than
  expected; (3) integration problems, delays or other related costs; and (4) unanticipated changes in laws, regulations, or other industry
  standards affecting the companies. The foregoing list of factors is not exhaustive. Readers are cautioned not to place undue reliance on
  these forward-looking statements, which speak only as of the date hereof. Readers are urged to carefully review and consider the various
  disclosures, including but not limited to risk factors contained in the Company's Annual Report in the Form 10-K for the year ended
  December 31, 2016. The Company does not, except as expressly required by applicable law, undertake to update or revise any of these
  statements in light of new information or future events.

  Non-GAAP Measures: The Company routinely supplements its reporting of GAAP measures by utilizing certain non-GAAP measures to
  separate the impact of certain items from its underlying business results. In this presentation, we use non-GAAP measures such as
  EBITDA, adjusted EBITDA, leverage and adjusted free cash flow and certain ratios using these measures. Since the Company uses these
  non-GAAP measures in the management of its business, management believes this supplemental information, including on a pro forma
  basis, is useful to investors for their independent evaluation and understanding of the business. Any non-GAAP financial measures used by
  the Company are in addition to, and not meant to be considered superior to, or a substitute for, the Company's financial statements
  prepared in accordance with GAAP. In addition, the non-GAAP financial measures included in this presentation reflects management's
  judgment of particular items, and may be different from, and therefore may not be comparable to, similarly titled measures reported by
  other companies. A reconciliation of this non-GAAP measure may be found on www.cott.com.

  With respect to our expectations of performance of S&D and Eden as they are being integrated, reconciliations of first year free cash flow
  accretion and adjusted free cash flow accretion are not available, as we are unable to quantify certain amounts that would be required to
  be included in the relevant GAAP measures without unreasonable effort. We expect that the unavailable reconciling items, which
  primarily include transaction and integration costs and phasing of capital expenditures, could significantly affect our financial results.
  These items depend on highly variable factors and any such reconciliations would imply a degree of precision that would be confusing or
  misleading to investors. We expect the variability of these factors to have a significant, and potentially unpredictable, impact on our
  future GAAP financial results.
                                                                                                                                               1
CAGE Conference March 20, 2017 - Cott Corporation
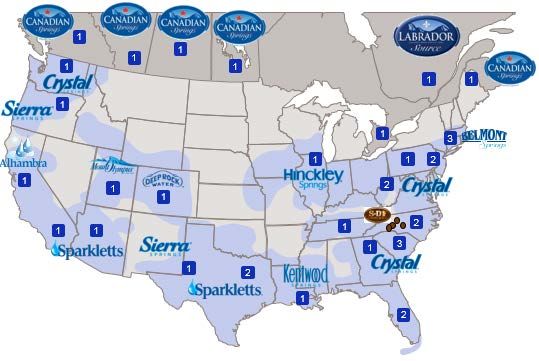
Management Attendees

                             Jerry Fowden
                         Chief Executive Officer

                                Jay Wells
                         Chief Financial Officer

                           Jarrod Langhans
                       Head of Investor Relations

                                                    2
CAGE Conference March 20, 2017 - Cott Corporation
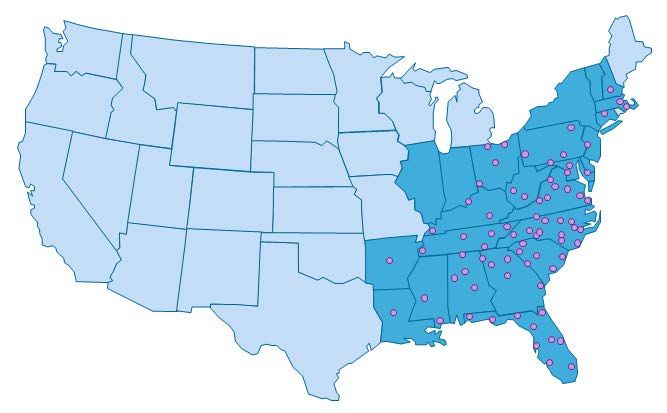
A Diversified Beverage Company Focused on Better-For-You
  Products and Broad Channel Penetration

Cott is a leading provider in the direct-to-consumer beverage services industry with 2017                                                                                                        Pro Forma 2016 (1)
            projected sales of over $3.7 billion and strong free cash flow growth.                                                                                                                Adjusted EBITDA

  The Company operates through two major business segments:                                                                                                                                                Product(1)
                                                                                                                                                                                                                           CSD
 1 Water and Coffee Solutions (“WCS”) Platform: provides bottled water, coffee, tea and                                                                                                               Other               11%
      water filtration services to customers across 20 countries. Segment includes DS Services,                                                                                                        13%                             Juice/Juice
                                                                                                                                                                                                                                         Drinks
      Aquaterra, Eden Springs and S&D business lines                                                                                                                                                                                       8%
                                                                                                                                                                                         Coffee &
                                                                                                                                                                                           Tea                                          Sparkling Water
               Growing products and channels associated with “Better-for-You” beverages                                                                                                  18%                                                 8%

                  including leading, scale platforms in home and office water delivery, coffee, tea and
                  filtration services within North America and Europe                                                                                                                          Water
                                                                                                                                                                                                8%
                                                                                                                                                                                                                                  HOD Water
                                                                                                                                                                                                                                    34%
               Large categories with low single digit growth across HOD Water, Custom Coffee
                   Roasting and Tea Blending
                                                                                                                                                                                                           Channel(1)
               Over 2.3 million customers providing a diverse customer base
 2                                                                                                                                                                                                                     Other
  Traditional Cott: produces beverages on behalf of retailers, brand owners and distributors.                                                                                             Contract Packaging
                                                                                                                                                                                                   7%
                                                                                                                                                                                                                        6%

      Focus on cash generation and cash extraction to grow our WCS platform and deleverage.                                                                                                 OCS
                                                                                                                                                                                            5%                                         Private Label
                                                                                                                                                                                                                                           Retail
                                                                                                                                                                                    Distribution                                           27%
               Volume stability through value-added and sparkling water product category growth                                                                                        4%
                  and growing contract manufacturing channel offsetting sugar sweetened beverage
                                                                                                                                                                                  Convenience
                  (“SSB”) (Carbonated Soft Drinks “CSDs” and Shelf Stable Juices “SSJs”) market                                                                                    Retailing
                                                                                                                                                                                                                                       Branded Retail
                  declines                                                                                                                                                            2%
                                                                                                                                                                                                                                           10%

                                                                                                                                                                                        Foodservice
                                                                                                                                                                                            5%
               Customer base includes the world’s leading brand owners and retailers in the                                                                                                                                   HOD Water
               grocery, mass-merchandise and drug store channels
___________________________
                                                                                                                                                                                                                                 34%

Note: Financials based on FY 2016. Source: Company information, Management estimates. Terms: Home and Office Delivery (“HOD”).
Other product category includes concentrates, filtration services and other. Sparkling waters includes mixers.
(1) 2016 Pro forma Adjusted EBITDA allocated based upon pro-rata 2016 revenues by product category and channel between DS Services (HOD Water, OCS, Water and Other), Traditional Cott (CSD, Juice/Juice Drinks, Sparkling Waters and Other), Eden (HOD
Water, OCS, Water and Other) and S&D (Coffee & Tea).
(2) Corporate costs allocated based upon management estimates                                                                                                                                                                                         3
CAGE Conference March 20, 2017 - Cott Corporation
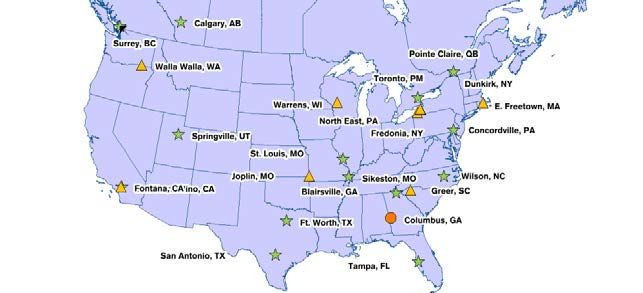
With a Track Record of Financial Growth Alongside the
 Diversification

    Scale revenue player supports operational                   Expected Mid teen compound growth in          Doubling of EBITDA over 3 year period
       and procurement leverage with low                             free cash flows 2016 to 2019
             customer concentration

                     Net Revenue                                        Adjusted Free Cash Flow                               Adjusted EBITDA
   ($ in millions)                                           ($ in millions)                               ($ in millions)

                                                    ~$3.7B

                                   $3,236                                                    $155 - $175
                                                                                      $150                                         $357         $373
                     $2,944
                                                                               $134
                                                                $107
     $2,103
                                                                                                                       $180

       2014          2015           2016            2017E       2014           2015   2016      2017E                  2014       2015      2016

___________________________
Source: Company information, Management estimates

                                                                                                                                                       4
CAGE Conference March 20, 2017 - Cott Corporation
Key Businesses Include: 1. DS Services (Including Aquaterra)
A leading US Direct-to-Consumer Services Provider Across HOD Water, Office Coffee
and Filtration Services
                                              Overview              Geographic Coverage and Brand Ownership(1)
   Leading bottled water, including many well-known
    brands, and coffee direct-to-consumer services
    provider to ~1.6mm customers locations through daily                         1
    operation of >2,000 routes that cover ~90% of the US
                                                                                           1               1
                                                                             1                         1
                                                                                                                                      1
                                                                                                                                                      1
         37 plants                                                      1                                                    1

         National DSD (direct-store-delivery) system                                                                             1               3

         Vast customer base of homes and small office                                                             1                  1       2

   Includes Aquaterra, the largest Canadian distributor of          1               1
                                                                                               1

    HOD water including well-known brands such as                        1                                                1
                                                                                                                                          2

    Labrador Source and Canadian Springs to ~70,000                                                                           1       3

    customers
                                                                                                   1       2

   Leading market share (~31%) in the 2015 U.S. HOD                                                                                  2

    bottled water category(2)

                                  Products & Services                                    Net Revenue Contribution
                                                                                                                        (3)
                                                                                          Other / Filtration Services
  Water Delivery Services                                                                             10%                       % of WCS: 53%
                                                                                                       $104mm
                                                                                                                              % of Total Cott: 28%

  Office Coffee                                                                          Retail
                                                                                         15%
  Services (“OCS”)                                                                                                                    Water Delivery
                                                                                     $165mm                                             Services
                                                                                                                                          64%
  Retail                                                                                 OCS                                              $681mm
                                                                                         11%
                                                                                     $118mm
  Filtration Services
___________________________
                                                                                 2016 Net Revenue(4): $1,067mm
(1) Figures represent regional market share
(2) Market share based on consumption volume
(3) Other net revenue included in Filtration Services net revenue
(4) Includes Aquaterra net revenue of $61mm
Source: Company information                                                                                                                               5
2. Eden Springs
Europe’s Leading Direct-to-Consumer (Home and Office) Water and Office Coffee
Services Provider

                                               Overview                                                                                                                        Geographic Coverage
  Europe’s largest office water and office coffee services                                                                                       Eden Springs geographic presence

        company with operations across 18 countries and                                                                                            BWC water position(1)

        ~800,000 customers                                                                                                                                                                   Norway 1               1 Finland
                                                                                                                                                                                                            2

  Meaningful scale across Europe with access to                                                                                                                                         Denmark 2
                                                                                                                                                                                                     Sweden     2 Estonia
                                                                                                                                                                                                                    Latvia
                                                                                                                                                                                                                    2
                                                                                                                                                                                                                                   Russia

                                                                                                                                                                                                                                   2
        attractive end-markets with positive growth outlook
                                                                                                                                                                                      1                     2
                                                                                                                                                                                         Netherlands             Lithuania
                                                                                                                                                                                    UK
                                                                                                                                                                                              1
        (A leading European player with multiple value-                                                                                                                                            2
                                                                                                                                                                                                Germany
                                                                                                                                                                                                       Poland 2

        creative tuck-in acquisition opportunities)
                                                                                                                                                                                             1
                                                                                                                                                                                        1
                                                                                                                                                                                    France       1 Switzerland

  Expands direct-to-consumer business – High-quality                                                                                                              1
                                                                                                                                                                             3

        and loyal customer base (Combination of DS Services,                                                                                                   Portugal Spain

        Aquaterra and Eden Springs has >2 million direct to                                                                                                                                                                                 1

        customer delivery points)                                                                                                                                                                                                 Israel

                                   Products & Services                                                                                                                   Net Revenue Contribution

  Water Services
                                                                                                                                                                                                 Filtration                 % of WCS: 19%
                                                                                                                                                                            Retail
                                                                                                                                                                                                     6%
                                                                                                                                                                                                 €22mm                    % of Total Cott: 10%
                                                                                                                                                                             12%
  Office Coffee                                                                                                                                                            €41mm
  Services                                                                                                                                                                                                                      Water Services
                                                                                                                                                                Office Coffee                                                       63%
                                                                                                                                                                  Services                                                        €224mm
  Filtration                                                                                                                                                         19%
                                                                                                                                                                  €66mm

  Retail
                                                                                                                                                                       2016 Net Revenue: €353mm
___________________________
(1) BWC represents total bottled water coolers but is not a market in and of itself as the HOD water business consists of coolers, bottled water as well as other products such as case pack water and single serve products
(2) Market share based on consumption volume
Source: Company information                                                                                                                                                                                                                      6
3. S&D Coffee and Tea
Leading U.S. Foodservice Coffee, Tea Manufacturing and Services Company

                                       Overview                                            Geographic Coverage
                                                                 Attractive Synergy and Distribution Opportunity with DS Services OCS
   One of the largest custom coffee roasters and                                              Business
        distributor of coffee and tea-based beverage solutions      Third-Party Distribution                  Direct Route & Third-Party Distribution
        to the U.S. foodservice industry
                                                                                         Direct route sales
                                                                                        accounted for ~20%
   Four facilities contain dedicated coffee and tea                                    of 2015 net revenue
        manufacturing capabilities, extract and ingredient
        technology, and over 625,000 total square feet of
        warehouse space
                                                                      3rd Party Distribution sales
   Serves over 24,000 blue-chip customers mainly in the             accounted for ~80% of total
                                                                           2015 net revenue
        foodservice industry, and delivers to over 102,000
        customer locations across U.S.

                             Products & Services                                      Net Revenue Contribution
                                                                                                              Other
                                                                                                               1%                % of WCS: 28%
  Coffee                                                                                                      $5mm             % of Total Cott: 15%

                                                                                  Distribution
                                                                                     32%
                                                                                   $181mm
                                                                                                                               QSR & Restaurants
  Tea                                                                                                                                48%
                                                                                                                                  $269mm
                                                                              Convenience
                                                                               Retailing
  Specialty extracts &                                                           19%
  Ingredients                                                                  $104mm
  (e.g. Cold Brew Coffee)
                                                                                   2016 Net Revenue: $558mm
___________________________
(1) Market share based on consumption volume
Source: Company information
                                                                                                                                                        7
4. Traditional Business
Leading Beverage Platform With Extensive Manufacturing Footprint for Private
Label, Contract Manufacturing and Own Brands
                Overview & Strategic Rationale                                           Geographic Coverage
   Industry-leading beverage manufacturer and distributor
      focused on private label, contract manufacturing and
      own brands                                                                                Canada
           Leader in private label shelf stable juices, CSDs
              and value-added and sparkling water in North                        U.S.
              America with a growing contract manufacturing
              business
     Fully integrated concentrate facility with strong R&D
      capabilities and vertical integration with high service,                                                                        Sangs(McDuff)
                                                                                                                                     Sangs
                                                                                                                                     Sangs
                                                                                                                                     Sangs
                                                                                                                                      Sangs
                                                                                                                                     Sangs
                                                                                                                                     Sangs
                                                                                                                                     Sangs   (McDuff)
                                                                                                                                            (McDuff)
                                                                                                                                            (McDuff)
                                                                                                                                           (McDuff)
                                                                                                                                             (McDuff)
                                                                                                                                            (McDuff)
                                                                                                                                            (McDuff)

      low-cost production model supplying quality
      concentrates and exports to customers outside of North                    Mexico
                                                                               MEXICO                                         U.K.
      America                                                                                                               Nelson
                                                                                                                            Nelson
                                                                                                                            Nelson
                                                                                                                            Nelson
                                                                                                                            Nelson
                                                                                                                            Nelson
                                                                                                                            Nelson
                                                                                                                            Nelson
                                                                                                                      Merseyside
                                                                                                                      Merseyside
                                                                                                                      Merseyside
                                                                                                                      Merseyside
                                                                                                                      Merseyside
                                                                                                                      Merseyside
                                                                                                                      Merseyside
                                                                                                                      Merseyside
                                                                                                                                         Bondgate
                                                                                                                                         Bondgate
                                                                                                                                         Bondgate
                                                                                                                                         Bondgate
                                                                                                                                         Bondgate
                                                                                                                                         Bondgate
                                                                                                                                         Bondgate
                                                                                                                                         Bondgate
                                                                                                                       Wrexham
                                                                                                                       Wrexham
                                                                                                                       Wrexham
                                                                                                                        Wrexham
                                                                                                                       Wrexham
                                                                                                                       Wrexham
                                                                                                                       Wrexham
                                                                                                                        Wrexham

  
                                                                                                                                         Kegworth
                                                                                                                                         Kegworth
                                                                                                                                         Kegworth
                                                                                                                                         Kegworth
                                                                                                                                         Kegworth
                                                                                                                                         Kegworth
                                                                                                                                         Kegworth
                                                                                                                                         Kegworth

      Customer relationships with over 500 leading retailers in                             Puebla
                                                                                            Puebla
                                                                                             Puebla      Cold Fill
                                                                                                         Hot Fill
      the grocery, mass-merchandise and drug store channels                                              Other

      and band owners
                          Products & Services                                       Net Revenue Contribution
 CSDs                                                                                Other                     % Better-for-You: 22%
                                                                                     24%                        % of Total Cott: 47%
                                                                                   $432mm

 Juice / Juice Drinks                                                                                                  CSD
                                                                                                                       31%
                                                                                Sparkling                            $559mm
                                                                                 Waters /
 Sparkling Waters / Mixers                                                       Mixers                       Juice / Juice
                                                                                  23%                            Drinks
                                                                                $401mm                            22%
                                                                                                               $392mm
 Other
                                                                                  2016 Net Revenue: $1,784mm
       The strong FCF from the Traditional Business enables us to delever quickly and invest in our growing “WCS” platform
___________________________                                                                                                                             8
Source: Company information
Cott’s Vision – To Become the Leading North American and European
Water, Coffee, Tea and Filtration Service Provider Within Home and
Office Delivery, Foodservice, Convenience and Hospitality

             • 2% to 3% Organic Growth Within Our Water and Coffee
      1        Solutions Segment

             • Accretive Small HOD Water, OCS and Filtration Tuck-In
      2        Acquisitions in North America and Europe

             • Synergy Capture and Integration Within Our Water and Coffee
      3        Solutions Businesses

             • Maintain Free Cash Flow Generation and Optimize Cash
      4        Extraction From Our Traditional Business

             • Strengthening Balance Sheet Through Strong Compound Free
      5       Cash Flow Growth, Interest Reduction, and Deleveraging

                         Vision Drives Shareholder Value Creation Via:
      Leading North American and European Water, Coffee, Tea and Filtration Service Provider
            With Higher Margins and Compound Growth in Revenue and Free Cash Flow
                                                                                               9
Key Investment Highlights

  1   Diversified Beverage Platform (low product, channel and customer concentration)

  2   “Better-for-You” Product Offerings (positioned against growing categories)

  3   Leading International HOD Platform (multiple accretive tuck-in opportunities)

  4   Recent Scale Acquisitions (meaningful synergies/cost savings opportunities)

      Strong Free Cash Flow Generation and De-leveraging (mid teen compound annual growth in
  5
      adjusted free cash flow)

                                                                                               10
Diversified Beverage Platform With Low Product, Channel and
1      Customer Concentration Increasingly Focused on Growing
       Categories of Water, Coffee, Tea and Filtration

                                                                                   2016 Pro Forma Adjusted EBITDA(1)

                                       Products                                                                                                                                          Channels
                                                     CSD
                                                     11%                                                                                                      Contract Packaging                Other
                          Other                                                                                                                                                                  6%
                          13%                                                                                                                                        7%
                                                                   Juice/Juice Drinks                                                                       OCS
                                                                          8%                                                                                5%                                                          Private Label Retail
                                                                                                                                                                                                                                27%
                                                                                                                                                 Distribution
    Coffee & Tea                                                                                                                                     4%
        18%                                                               Sparkling Water
                                                                                8%

                                                                                                                                          Convenience Retailing
                                                                                                                                                  2%
                                                                                                                                                                                                                               Branded Retail
               Water                                                                                                                                                                                                               10%
                8%                                                                                                                                     Foodservice
                                                                 HOD Water                                                                                5%
                                                                   34%                                                                                                                                          HOD Water
                                                                                                                                                                                                                  34%
                                                                                                         Better For You(2)

                                                                                            Other
                                                                                            32%

                                                                                                                                                          Better For You
                                                                                                                                                               68%

___________________________
(1) Corporate costs allocated based upon management estimates. Adjusted EBITDA is a non-GAAP financial measure. See appendix for reconciliation
(2) Other product category includes concentrates, filtration services, energy and other. Sparkling water includes mixers. Better For You platform includes HOD Water, OCS, Coffee & Tea, Water and Sparkling Waters / Mixers
Source: Company information, Management estimates                                                                                                                                                                                               11
“Better-For-You” Product Offering Increasingly Positioned
 2
             Against Growth Categories
                                         HOD Water Category                                                                                                                         Filtration Market
     HOD Water Volume (gallons in millions)                                                                                                Point of Use Units (units in millions)

                                                      CAGR: 3.0%                                                                                                                                  CAGR: 9.0%
                                                                                                                                                                                                                                                          2.1
                                                                                                              1,338                                                                                                                    1.9
                                                                     1,225               1,285                                                                                                                     1.8
        1,156               1,174                1,204                                                                                                                                         1.6
                                                                                                                                                                          1.5
                                                                                                                                                      1.4

                                                                                           891                 916
         819                  835                 852                 863

         337                  339                 352                 362                  394                 422

        2010                 2011                2012                 2013                2014                2015                                   2015               2016E               2017E                2018E               2019E             2020E
                                                   DSS                Other
    Source: Beverage Marketing Corporation, The Automatic Merchandiser                                                                     Source: Zenith International

                                        Out of Home Coffee(1)                                                                                                                       Hospitality Tea(2)
     ($ in billions)                                                                                                                       ($ in billions)

                                                                                                                  $17.5
                                                                                                        $16.6
                                                                                             $15.8                                                                                                                                                 $8.2    $8.5
                                                                                  $14.9                                                                                                                                                 $7.9
                                                                       $13.9                                                                                                                                      $7.3       $7.6
                                                            $12.9                                                                                                                                      $7.1
                                       $11.9                                                                                                                                                $6.7
                                                                                                                                                                      $6.1       $6.3
                           $10.7 $11.3                                                                                                          $5.5        $5.7
                 $9.5
      $7.9

     2010       2011       2012       2013       2014 2015E 2016E 2017E 2018E 2019E 2020E                                                      2010         2011      2012       2013       2014 2015E 2016E 2017E 2018E 2019E 2020E
   Source: Mintel Group, Ltd.                                                                                                                Source: Mintel Group, Ltd.
___________________________
(1) Includes roasted, single-cup, instant, ready-to-drink and cold-brew, and refrigerated cold-brew / concentrate U.S. coffee retail sales at current prices; projections exclude refrigerated cold-brew / concentrate coffee retail sales. Excludes
      wholesale net revenue
(2) Includes canned / bottled, refrigerated, bagged / loose leaf, and single-cup U.S. tea sales at current prices. Excludes wholesale net revenue
                                                                                                                                                                                                                                                                12
Leading International HOD Platform With Regional Scale and
3
          Multiple Accretive Tuck-in Opportunities

                                                                                                                                                                           Norway 1                1 Finland
                                                                                                                                                                                          2
                                                                                                                                                                                                            Estonia   Russia
                                                                                                                                                                                       Sweden       2
                                                                                                                                                                                                            Latvia
                                                                                                                                                                        Denmark 2                          2           2
                                                                                                                                                                1
                                                                                                                                                                        Netherlands           2          Lithuania
                                                                                                                                                              UK
                                                                                                                                                                             1
                                                                                                                                                                                   2    Poland
                                                                                                                                                                                               2
                                                                                                                                                                                Germany
                                                                                                                                                                            1
                                                                                                                                                                    1
                                                                                                                                                              France             1 Switzerland

                                                                                                                                                          3
                                                                                                                                             1
                                                                                                                                         Portugal Spain

                                                                                                                                          Eden geographic presence                                                             1

                                                                                                                                                                                                                      Israel
                                                                                                                                          BWC water position(3)

                        DS Services – U.S. Market Leader                                                                                  Eden Springs – European Market Leader

                  HOD Water(1)                                                  OCS(2)                                                      HOD Water                                                             OCS
                                                                                                                                                                                                                 Company A
                                                                                         DS Services                                                           Eden                                                 6%
                                                                                            ~3%                                                                20%
                                          DS Services                                                                                                                                                                          Eden
                                            ~31%                                                                                                                          Company A                                                4%
      Smaller
                                                                                                    Remainder of                                                             3%
    Competitors
                                                                                                       Top 5
       ~39%                                                                                                                                                                                      Other
                                                                                                       ~17%
                                                                                                                                 Other                                                           89%
                                                                                                                                 61%                                      Company B
                                                                                                                                                                             3%

                                                               Smaller                                                                                                  Next 5
                                                             Competitors                                                                                                 13%
                                       Nestle                   ~80%
                                       ~30%

___________________________
Note: 2015 market shares based on management estimates; market share figures represent regional market share
(1) Source: Beverage Marketing Corporation. Category size of $1.7 billion reflects only bottled water and excludes items such as cooler rent, cups, etc.
(2) Source: ‘Coffee sales rise, so do costs: State of the Coffee Service Industry’, Automatic Merchandiser, September 2015
(3) BWC represents total bottled water coolers but is not a market in and of itself as the HOD water business consists of coolers, bottled water as well as other products such as case pack water and single serve products
Source: Company information, Management estimates
                                                                                                                                                                                                                                        13
Recent Acquisitions Provide Meaningful Cost Savings
         Opportunities
4

                           Scales business and meaningfully        Improves product and channel mix,          Provides scaled growing coffee and
                            enhances margin profile                  while reducing exposure to “Big             tea production and delivery platform
                                                                     Box” retail and input costs

                           Diversifies product mix and improves                                                Furthers Cott’s platform
                            growth                                  Creates an international HOD                diversification strategy across
    Strategic                                                        platform with leading market share          multiple products and channels
                                                                     across all regions, with significant
    Rationale                                                        consolidation opportunities
                           Broadens channel mix
                                                                                                                Significant synergies with existing
                                                                                                                 coffee business
                           Meaningful synergies and new            Increases scale, margin and growth
                            revenue opportunities generated          profile
                            from new channel and new routes to
                            market
                                                                        Eden Springs and S&D Coffee acquisitions are expected to generate total
                           Expected to generate $25mm of                cost synergies of $23mm(1) by 2020
                            synergies over 3 years
                                                                     ($ in millions)                                                     $23
                                                                                                                   $21
      Cost
                             $21mm of $25mm realized to-date
    Synergies
                                                                                                $12

                           Expected to achieve run-rate                      $4
                            synergies by the end of FY2017

                                                                            2017               2018                2019                 2020

___________________________
(1) Eden Springs synergies converted from EUR to USD using 1.102
Source: Company information, Management estimates                                                                                                      14
5
           Strong Free Cash Flow Generation and Compound Annual Growth in
           Adjusted Free Cash Flow Supports Rapid De-Leveraging

                          Adjusted Free Cash Flow (1)(2)                                                                                                        Free Cash Flow Drivers
($ in millions)

                                        $134
                                                                     $150
                                                                                          $155 - $175
                                                                                                                                                     Maintain free cash flow generation and optimize
                                                                                                                                                      cash extraction from our traditional business

            $107
                                                                                                                                                    Organic growth of 2% to 3% from our Water, Coffee
                                                                                                                                                     & Tea service businesses

            2014                        2015                         2016                       2017E
                                                                                                                                                     Full-year impact and associated free cash flow from
                                                                                                                                                      Eden Springs and S&D Coffee & Tea

                                                                                                                                                      ~$23mm of synergy generation from Eden Springs

($ in millions)
                             Adjusted Free Cash Flow (1)                                                                                             and S&D Coffee & Tea as these businesses become
                                                                                                                                                      fully integrated
                                                                                  $225 -
                                                                                   $275
                                                                                                                                                      Continue to execute-on highly accretive, synergistic
                         $155 -
                          $175                                                                                                                       and deleveraging tuck-in acquisitions in the HOD
                                                                                                                                                      water, office coffee and filtration industries

                                                                                                                                                     Opportunistically refinance high coupon debt at
                         2017E                                                    2019E                                                             lower rates and better terms in 2017, subject to
                                                                                                                                                     market conditions

    ___________________________
    (1) Adjusted free cash flow calculated as cash flow from operations (excluding acquisition, integration and transaction costs) less capital expenditures
    (2) See appendix for adjusted free cash flow reconciliation
    Source: Company information                                                                                                                                                                         15
Strong Free Cash Flow Generation and Compound Annual Growth in Adjusted
5
         Free Cash Flow Supports Rapid De-Leveraging - Continued

        Proven track-record of quickly deleveraging after acquisitions
        Significant free cash flow conversion allows for accelerated deleveraging
        Additional deleveraging through cash extraction from traditional business (e.g. sale leasebacks, tight capital
           control, various monetization options)

        Capital deployment strategy assessed upon reaching 3x range

                                                                               Pro Forma Net Debt to Adj. EBITDA
                    High 4x(1)

                                                                                                                                                                ~3.0x

                     PF2016                                     2017E                                     2018E                                     2019E    Long-term net
                                                                                                                                                            leverage target

    (1) Pro Forma Leverage subsequent to closing Eden Springs and S&D Coffee and Tea in August 2016. See modeling deck presented August 17, 2016.
    Source: Company information

                                                                                                                                                                              16
Strong Free Cash Flow Generation and Compound Annual Growth in
   Adjusted Free Cash Flow Supports Rapid De-Leveraging - Continued

                                          Shareholder Value Creation Via:
           Leading North American and European Water, Coffee, Tea and Filtration Service Provider With Higher
                           Margins and Compound Growth in Revenue and Free Cash Flow

 Highly diversified product, package and channel mix.
 Strong and growing adjusted free cash flow that drives returns to shareholders through a more balanced scale
     business with a goal of $225 plus million in adjusted free cash flow by the end of 2019.

 Rapid deleveraging results in transfer of value from debt to equity holders.
                                                                                                 FREE CASH FLOW YIELD
                                                         9.5%

                                                                                               7%

                                                                                                                                    5%
                                                                                                                                                                        4%

                                                                                                                   (a)                          (b)                                       (c)
                                                          Cott                     High Cash Flow                               Bottlers                       Route Based
                                                                                      Consumer                                                                  Services

Note: Adjusted free cash flow yield defined as cash flow from operations less capital expenditures / market capitalization. Market data as of December 31, 2016 (Cott share price: $11.33).
(a)    High cash flow consumer peer group includes B&G Foods, Campbell, Pinnacle Foods, Post Holdings, JM Smucker, Snyder’s-Lance, Spectrum Brands and TreeHouse Foods
(b)    Bottlers peer group includes National Beverage, A.G. Barr, Britvic, Coca-Cola Amatil, Coca-Cola European Partners and Coca-Cola Femsa
(c)    Route base services peer group includes G&K Services, Unifirst, ABM Industries, Chemed, ServiceMaster, Cintas and Aramark                                                                17
Source: Company filings, Factset
Questions and Answers
                        18
Appendix
           19
Cott's Diversified Business Platform

                                                                           Water and Coffee Services                                                                  Traditional

                                    DS Services
                                                                    Eden Springs                                     S&D Coffee
                                 (incl. Aquaterra)

                                                                                                                                                      Leading SSJ, CSD, and sparkling water /
                                                                                                                                                        mixer manufacturer and distributor with a
                                                                                                                                                        focus on private label and contract
                                                                                                 Leading custom coffee roaster and                     manufacturing
                               Direct-to-consumer providers of HOD                                    services company in the U.S. that              Customers include leading grocers, drug
                                  water and filtration services across the                             provides vertical integration benefits           stores, mass-merchandisers and global
                                  U.S. (DS Services), Europe (Eden
                                  Springs) and Canada (Aquaterra)                                Improves overall growth profile by                    brand owners
     Description
                                                                                                       providing access to new customers,             High cash flow generation through 4C’s
                               Provides access and leadership position                                channels and growing categories                  (strong customer relationships, low
                                  in the growing HOD water and filtration
                                  services industry                                              Provides a leadership position within the             operating costs, rigorous capex
                                                                                                       growing “On-the-Go” coffee category              management and strong free cash flow)
                                                                                                                                                      Cash generation and extraction used for
                                                                                                                                                        Water and Coffee Solutions growth and
                                                                                                                                                        deleveraging

  2016 Pro Forma
                               $1,067mm                        $389mm(1)(2)                    $558mm(2)                                           $1,784mm
   Net Revenue

                               Largest or second-largest HOD water                              Four production facilities: two dedicated
                                  provider in 39 of 43 largest U.S. cities and                         coffee facilities, one tea facility and one
                                  market leader in Canada                                                                                             Global manufacturing footprint with over
                                                                                                       extract and ingredient facility
                                                                                                                                                        30 facilities in the U.S., Canada, UK and
                               Leading European market player across                            Production space: 625,000 ft.2 with the               Mexico
                                  18 countries via the Eden Springs platform                           ability to add multiple roasters over the
                                                                                                                                                      High service levels and low freight costs
                               Strong platform for accretive tuck-ins                                 coming years as necessary
       Footprint                                                                                                                                      Fully integrated concentrate facility with
                                  across geographies in both North America                       Capable of producing 130-150 million
                                  and Europe at attractive multiples                                                                                    strong R&D capabilities and vertical
                                                                                                       pounds of coffee and 40-50 million pounds
                                                                                                                                                        integration
                               37 plants and 15 water sources in the U.S.                             of tea annually
                                                                                                                                                      Customer relationships with over 500
                                  and Canada                                                     Since 2010, S&D has invested over
                                                                                                                                                        leading retailers and global brand owners
                               27 water sources across 18 countries in                                $50mm to expand and upgrade its
                                  Europe (~1/3 owned)                                                  production facilities

___________________________
(1) Eden Springs figures translated using EUR to USD FX rate of 1.102
(2) See appendix for reconciliation of Eden Springs and S&D Coffee reported to pro forma net revenue
Source: Company information                                                                                                                                                                     20
Cott has Successfully Built a “Better-for-You” Beverage
   Platform
   Transformed the Business Through Strategic Acquisitions

    Acquisition Date                December 2014                                   January 2016                       August 2016                      August 2016

                                    Leading bottled water and
                                                                                     Largest Canadian distributor
                                        coffee direct-to-consumer
                                                                                        of HOD water including well-     Europe’s largest office water    One of the largest custom
                                        services provider to ~1.5mm
                                                                                        known brands such as              and office coffee services        coffee roasters and
                                        customer locations through
  Business Overview                                                                     Labrador Source and               company with operations           distributor of coffee and tea-
                                        daily operation of >2,000
                                                                                        Canadian Springs to ~70,000       across 18 countries and           based beverage solutions to
                                        routes with well known
                                                                                        customers and ~C$80 million       ~800,000 customers                the U.S. foodservice industry
                                        brands such as Sparkletts,
                                                                                        in annual net revenue
                                        Hinckley and Crystal Springs

 2016 PF Net Revenue                $1,006mm                                        $61mm(1)                           $389mm(2)(3)                     $558mm(3)

   Geographic Focus                 United States                                   Canada                             Primarily Europe                 United States

                                    Market leader in the U.S.                       Leading player in the              Creates a international home     Provides scaled growing
                                        home and office water                           Canadian home and office          and office water delivery         coffee & tea production and
                                        delivery category                               water delivery category           platform with leading market      delivery platform
                                                                                                                          shares across regions
                                    Improves Cott’s growth                          Provides Canadian platform                                           Further improves Cott’s
                                        profile and diversification                     for further tuck-in              Further improves Cott’s           product and channel mix
                                                                                        acquisitions similar to DS        product and channel mix
   Strategic Rationale
                                    Enhances margin profile and                        Services                                                           Significant synergies with
                                        accretive to adjusted FCF                                                        Substantial cost and revenue      existing coffee business
                                                                                     Attractive multiple due to          synergies with DS Services
                                    Provides platform for                              significant synergies with DS
                                        accretive tuck-in acquisitions                  Services

                                The Creation of the “Better-for-You” Platform has been Accretive to Free Cash Flow
___________________________
(1) Aquaterra figures translated using CAD to USD FX rate of 0.755
(2) Eden Springs figures translated using EUR to USD FX rate of 1.102
(3) See appendix for reconciliation of Eden Springs and S&D Coffee reported to pro forma net revenue
(4) Market share based on consumption volume                                                                                                                                             21
Source: Company information
You can also read