First Quarter 2019 Conference Call - April 26, 2019 - Goodyear Corporate

Page created by Russell Reese
 
CONTINUE READING
First Quarter 2019 Conference Call - April 26, 2019 - Goodyear Corporate
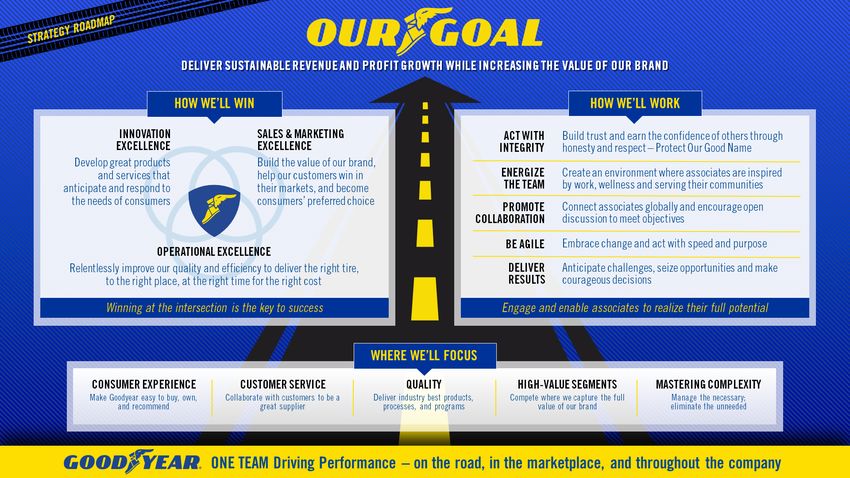
First Quarter 2019 Conference Call
April 26, 2019
First Quarter 2019 Conference Call - April 26, 2019 - Goodyear Corporate
Forward-Looking Statements

Certain information contained in this presentation constitutes forward-looking statements for purposes of the safe
harbor provisions of The Private Securities Litigation Reform Act of 1995. There are a variety of factors, many of which
are beyond our control, that affect our operations, performance, business strategy and results and could cause our
actual results and experience to differ materially from the assumptions, expectations and objectives expressed in any
forward-looking statements. These factors include, but are not limited to: our ability to implement successfully our
strategic initiatives; actions and initiatives taken by both current and potential competitors; increases in the prices paid
for raw materials and energy; a labor strike, work stoppage or other similar event; foreign currency translation and
transaction risks; deteriorating economic conditions or an inability to access capital markets; work stoppages, financial
difficulties or supply disruptions at our suppliers or customers; the adequacy of our capital expenditures; our failure to
comply with a material covenant in our debt obligations; potential adverse consequences of litigation involving the
company; as well as the effects of more general factors such as changes in general market, economic or political
conditions or in legislation, regulation or public policy. Additional factors are discussed in our filings with the Securities
and Exchange Commission, including our annual report on Form 10-K, quarterly reports on Form 10-Q and current
reports on Form 8-K. In addition, any forward-looking statements represent our estimates only as of today and should
not be relied upon as representing our estimates as of any subsequent date. While we may elect to update forward-
looking statements at some point in the future, we specifically disclaim any obligation to do so, even if our estimates
change.

                                                                                                                             2
First Quarter 2019 Conference Call - April 26, 2019 - Goodyear Corporate
Of
First Quarter 2019 Conference Call - April 26, 2019 - Goodyear Corporate
Reflecting on Q1 2019 Results
                 Positives                                    Negatives
 • Global revenue per tire increased 4%       • Higher raw material costs (including
 • U.S. consumer replacement volume growth      costs driven by stricter enforcement of
   of 6%, led by outperformance in ≥17”         environmental regulations in China)
 • Improving U.S. supply                      • Volatility in emerging markets, including
                                                China and Brazil
 • U.S. and EMEA commercial truck
   businesses                                 • Currency weakness in key markets
 • Announced plans to restructure/modernize   • Soft consumer demand in Europe
   two manufacturing facilities in Germany
 • Expanding portfolio of mobility and
   technology partners

          Making progress in a challenging environment
                                                                                            4
First Quarter 2019 Conference Call - April 26, 2019 - Goodyear Corporate
Consumer Replacement
Industry Fundamentals: ≥17”
               U.S. Replacement Industry                                  Europool & Turkey Replacement Industry
              2019 vs. 2018 Growth Rate (a)                                    2019 vs. 2018 Growth Rate (b)

                                                                 Q1 19                                 Q1 19
USTMA Members (>17”)                                              8%     ETRMA Members (>17”)           6%
USTMA Members (17”)             7%

 (a) Source: U.S. Tire Manufacturers Association
 (b) Source: European Tyre & Rubber Manufacturer’s Association                                                 5
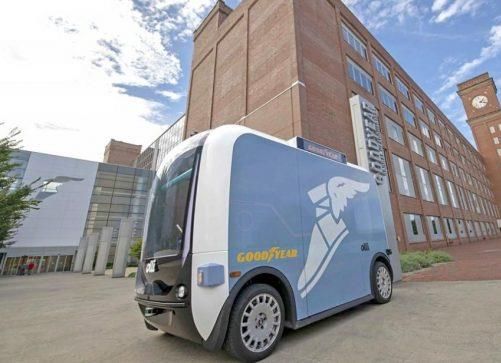
First Quarter 2019 Conference Call - April 26, 2019 - Goodyear Corporate
U.S. Market Share
                                                                      U.S. Consumer Replacement Volume
       108                                                                                           Trailing 4 Quarters
       107
       106
       105
       104
       103
       102
       101
       100
         99
                                                                                                     (b)                                   Impact of relative
         98                                                                                                                                 pricing in 2017
                Q4 2014                                                                                                                                                                                  Q1 2019
                                                                                                                                                                                   (b)
                                                                     Industry             (a)
                                                                                                                                                           Goodyear

        Strong execution continues to drive market share gains
(a) Source: U.S. Tire Manufacturers Association
(b) Goodyear U.S. consumer replacement volume excludes ATD sales volume and volume associated with ATD acquisitions. ATD delivery volume is included. Q3 18 – Q1 19 adjusted for transition to TireHub        6
First Quarter 2019 Conference Call - April 26, 2019 - Goodyear Corporate
EMEA Consumer Product Launches

                               Significant advances in wet braking and dry handling.
                              Award winning performance in 4 out of 4 magazine tests

 Superior wet braking and                                                              1st category refresh in a
dry handling vs competition     1st           2nd             2nd           2nd             number of years

               Driven by continued market back innovation
                                                                                                          7
First Quarter 2019 Conference Call - April 26, 2019 - Goodyear Corporate
EMEA Commercial Product Launches

 Regional Haul service tire with focus on mileage   Long Haul service tire with focus on fuel economy

    Innovative products strengthen value proposition
                                                                                                   8
First Quarter 2019 Conference Call - April 26, 2019 - Goodyear Corporate
Expanding Mobility and Technology Partners
    Envoy Technologies                                     Local Motors                               YourMechanic

    Pilot program launched in early 2019        •   Partnership revolves around autonomous    •   Goodyear.com added to YourMechanic’s
•                                                   shuttle                                       platform of mobility service and repair
•   Envoy Technologies will leverage
                                                    Olli creates new learning opportunities       solutions
    Goodyear’s predictive tire servicing        •                                                 YourMechanic enhances global innovation
    solution to minimize operational downtime
                                                •   Goodyear selected as exclusive fitment    •   network

           Collaborative partnerships driving innovation
                                                                                                                                    9
First Quarter 2019 Conference Call - April 26, 2019 - Goodyear Corporate
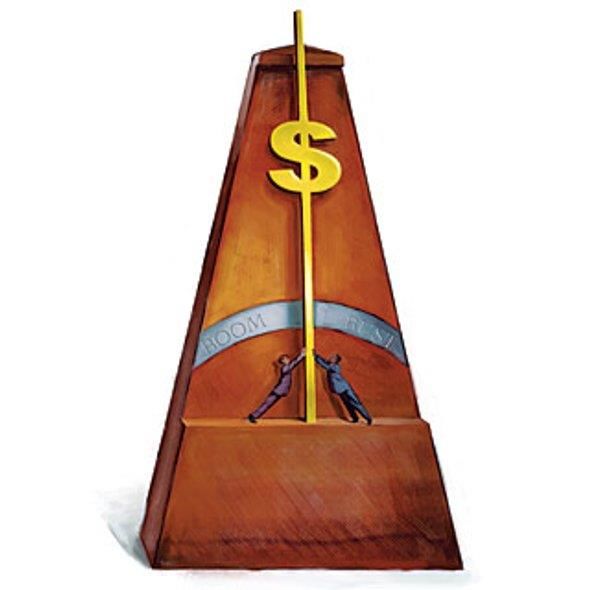
Strengthening the Business for the Future
• Advancing distribution and retail
    -   Leverage TireHub to fully capture the value of the Goodyear brand
    -   Enhance distributor alignment in key markets outside of the U.S.
    -   Challenge traditional retail tire business with innovative new concepts
•   Advancing technology for the emerging mobility landscape
•   Scaling commercial fleet solutions
•   Building strong OE pipeline for 2020+
•   Announced German modernization & restructuring program
    -   Increases ≥17” capabilities
    -   Significant conversion cost savings

Continuing to build fundamental earnings power of our business
                                                                                  10
Financial Review
First Quarter 2019
Income Statement
   Terms: US$ millions
      (except EPS)                                                                                        Three Months Ended
                                                                                                      March 31,         March 31,
                                                                                                        2019              2018           Change
                               Units                                                                            38.0              39.0      (3)%
                               Net Sales                                                          $           3,598  $          3,830       (6)%
                               Gross Margin                                                                  20.0%              22.3%    (2.3) pts
                               SAG                                                                $            547     $          591        (7)%
                                                                           (a)
                               Segment Operating Income                                           $            190     $          281      (32)%
                                                                          (a)
                               Segment Operating Margin                                                       5.3%                7.3%   (2.0) pts
                               Goodyear Net Income (Loss)                                         $             (61)   $           75

                               Goodyear Net Income (Loss) Per Share
                                Weighted Average Shares Outstanding                                            232                 240
                                  Basic                                                           $           (0.26)   $          0.31
                                  Weighted Average Shares Outstanding - Diluted                                232                 244
                                  Diluted                                                         $           (0.26)   $          0.31
                               Cash Dividends Declared Per Common Share                           $            0.16    $          0.14
                                                                                            (b)
                               Adjusted Diluted Earnings Per Share                                $            0.19    $          0.50

(a) See Segment Operating Income and Margin reconciliation in Appendix on page 31
(b) See Adjusted Diluted Earnings Per Share reconciliation in Appendix on pages 32 and 33                                                            12
First Quarter 2019
Segment Operating Results
   Terms: US$ millions

            $281                    ($20)                    $18                   ($137)
             Q1
            2018                 Volume               Unabsorbed                                                                     $55           ($45)
            SOI                                       Fixed Cost
                                                                                                                                                                ($14)      $10       $190
                                                                                                              $42
                                                                                                                                   Cost         Inflation(b)                          Q1
                                                                                                                                                               Currency   Other(c)
                                                                                                                                  Savings                                            2019
                                                                                 Raw                     Price/Mix                                                                   SOI
                                                                               Materials(a)

                                            ($2)                                            ($95)                                          $10
                                    Total Volume Impact                                Net P/M vs Raws                               Net Cost Savings

(a) Raw material variance of ($137) million excludes raw material cost saving measures of $26 million, which are included in Cost Savings
(b) Estimated impact of inflation (wages, utilities, energy, transportation and other)                                                                                                      13
(c) Includes the impacts of other tire-related businesses, advertising and R&D
First Quarter 2019
Balance Sheet
   Terms: US$ millions

                                                                                                      March 31,     December 31,      March 31,
                                                                                                        2019            2018            2018
                    Cash and cash equivalents                                                       $        860    $        801    $        837

                    Accounts receivable                                                                    2,446           2,030           2,509
                    Inventories                                                                            2,940           2,856           2,895
                    Accounts payable - trade                                                              (2,737)         (2,920)         (2,850)
                                    (a)
                    Working capital                                                                 $      2,649    $      1,966    $      2,554

                                          (b)
                    Total debt                                                                      $      6,506    $      5,763    $      6,259
                                       (b)
                    Net debt                                                                        $      5,646    $      4,962    $      5,422

(a) Working capital represents accounts receivable and inventories, less accounts payable – trade
(b) See Total Debt and Net Debt reconciliation in Appendix on page 35
                                                                                                                                                    14
First Quarter 2019
Free Cash Flow
   Terms: US$ millions
                                                                                                               Three Months Ended                                          Trailing Twelve
                                                                                                                    March 31,                                              Months Ended
                                                                                                             2019                            2018                          March 31, 2019

                       Net Income (Loss)                                                            $                    (44)       $                     80          $                             584
                           Depreciation and Amortization                                                                193                             199                                        772
                           Change in Working Capital                                                                   (589)                           (449)                                      (260)
                           Pension Expense                                                                               34                              28                                        116
                           Pension Contributions and Direct Payments                                                    (18)                            (21)                                       (71)
                           Provision for Deferred Income Taxes                                                          (23)                            (17)                                       125                      Includes impact of
                           Rationalization Payments                                                                     (18)                           (106)                                       (86)                       non-cash gain
                                                                                                                                                                                                                                on TireHub
                           Other(a)                                                                                     101                            (103)                                      (239)
                                                                                                                                                                                                                                transaction
                       Cash Flow from Operating Activities (GAAP) $                                                    (364)        $                  (389)          $                             941
                           Capital Expenditures                                                                        (221)                           (248)                                      (784)
                       Free Cash Flow (non-GAAP)                                                    $                  (585)        $                  (637)          $                             157

                       Cash Flow from Investing Activities (GAAP) $                                                    (244)        $                  (248)          $                           (863)
                       Cash Flow from Financing Activities (GAAP) $                                                     645         $                   399           $                              3

(a) Other includes amortization and write-off of debt issuance costs, net pension curtailments and settlements, net rationalization charges, net (gains) losses on asset sales, compensation and benefits less pension expense, other
    current liabilities, other assets and liabilities, operating lease expense and payments under the new accounting standard, and gain on TireHub transaction, net of transaction costs                                                  15
First Quarter 2019 - Segment Results
Americas
Terms: US$ millions
  Units in millions

                       First Quarter
                      2019      2018    Change    • Volume flat, with strong replacement
                                                    shipments in U.S., offset by weakness in
  Units                16.7     16.7       -        Brazil and U.S. consumer OE
                                                     • U.S. consumer replacement up 6%
Net Sales             $1,876   $1,929   (2.7%)
                                                     • Strong commercial growth
Operating                                         • SOI decline driven by higher raw material
                       $89      $127    (29.9%)
 Income
                                                    costs, lower earnings on third-party
 Margin               4.7%      6.6%
                                                    chemical sales, and currency

                                                                                            16
First Quarter 2019 - Segment Results
Europe, Middle East & Africa
Terms: US$ millions
  Units in millions

                       First Quarter              • Volume decline driven by weaker
                      2019      2018    Change
                                                    consumer replacement demand,
                                                    partially offset by strong commercial
  Units                14.4     14.7    (2.5%)      truck performance

                                                  • Favorable momentum in fleet services
Net Sales             $1,221   $1,330   (8.2%)
                                                    and freight trends contributing to
Operating                                           commercial truck growth
                       $54      $78     (30.8%)
 Income
                                                  • SOI decline driven by higher raw
 Margin               4.4%      5.9%                material and transportation costs,
                                                    and lower volume

                                                                                            17
First Quarter 2019 - Segment Results
Asia Pacific
Terms: US$ millions
  Units in millions

                      First Quarter
                      2019     2018    Change    • Volume declines driven by continued
  Units               6.9       7.6    (8.7%)
                                                   weakness in China and weak OE in
                                                   India
Net Sales             $501     $571    (12.3%)

Operating                                        • SOI decline driven by higher raw
                      $47      $76     (38.2%)     material costs, lower volume and lower
 Income
                                                   factory utilization
 Margin               9.4%     13.3%

                                                                                     18
2019 Segment Operating Income Outlook

                Positives                                      Negatives
 + New Americas Plant – At full capacity         – Raw Materials – Cost increases will
                                                   continue at least into Q3
    by year end (High-value/low-cost capacity)
                                                 – FX – Continued negative impact at
 + TireHub – Reversal of 2018 volume loss          current spot rates
 + Price – Full-year benefit of 2H18 pricing     – OE – 2-3M unit volume reduction from
    increases                                      fitments we chose to exit (low value)
 + Mix – Continued growth in ≥17”                – China – Continued year-over-year decline
                                                   at least through 1st half (tough
 + Net cost savings – Savings continue,            comparison period)
    but at a lower rate than recent years
                                                 – Latin America – Continued volatility

      Macro challenges continue, volume environment remains a risk
                                                                                           19
Second Quarter Puts and Takes

         Americas                              EMEA                    Asia Pacific

(-) Price/Mix < Raw Materials    (-) Foreign Exchange           (-) Price/Mix < Raw Materials

(-) Other Tire-Related Businesses (-) Volume                    (-) Volume

                                 (-) Cost / Inflation (wages,
(+) Overhead Absorption                                         (-) Overhead Absorption
                                     energy, transportation)

                           Challenges continue in Q2
                                                                                                20
Raw Material Overview
      Terms: US$ millions                       Raw Material Costs(a)

                                     $300
                                                                                                                                     • Expecting raw material cost
                      $189                          $194                                                                               increases of ~$300M in 2019
                                                                                                                       $137            based on forecasted rates
                                                                                                               $128
           +4%
                                                                    $93                                                        $80      • Feedstock ~$60M
         $42                                                                       $43                                                  • Transactional FX ~$120M
                                                                                                   $2                                   • Non-feedstock ~$120M
          Q1             Q2             Q3             Q4            Q1             Q2             Q3             Q4    Q1      Q2
                   Full Year = $725                                           Full Year = $266

                              2017                                                        2018                               2019

             Raw material costs will remain a significant headwind in Q2
(a)     Impact to cost of goods sold versus prior period, excluding the impact of raw material cost saving measures                                             21
2019 Full-Year Industry Outlook

                                                                                                            Full-Year 2019 Guidance

                                                                                                   United States            Western Europe (a)

                                      Consumer Replacement                                          ~Flat – 2%                  ~Flat – 2%

                                                Consumer OE                                        ~(4)% – Flat                 ~(3) – 1%

                                    Commercial Replacement                                          ~(2) – Flat                  ~1 – 3%

                                               Commercial OE                                        ~(2) – 3%                    ~1 – 4%

(a) For replacement, Western Europe is Europool and Turkey; for OE, Western Europe is total EMEA                                                 22
2019 Outlook – Other Financial Assumptions

                                                                                                    Current 2019 FY Assumption
                              Interest Expense                                                                  ~$350 million
                                                                                                         Financing fees: ~$40 million
                        Other (Income) Expense
                                                                                       Global pension related (excluded from SOI)(a): $95 - $120 million
                                                                                            Expense: ~25% of global pre-tax operating income;
                                   Income Tax
                                                                                           Cash: ~20% - 25% of global pre-tax operating income(b)

                    Depreciation & Amortization                                                                 ~$775 million

               Global Pension Cash Contributions                                                              $25 - $50 million

                               Working Capital                                                          Use of less than $100 million

                                                                                                               ~$900 million;
                           Capital Expenditures
                                                                                                     Driving >17” growth in volume & mix

                        Restructuring Payments                                                                   ~$50 million

                               Corporate Other                                                                  ~$100 million

(a) Excludes one-time charges and benefits from pension settlements and curtailments
(b) Excludes one-time items                                                                                                                                23
Looking Beyond the                                                           Cyclicality (a)

$ in Billions

                 Great Recession                                                                 Earnings Power                                               Current Raw Mat Cycle
                          2008 – 2009                                                                   2014 – 2016                                                2017 – 2018

 • Average SOI                                                 $0.6             • Average SOI                                                 $1.9 • Average SOI                 $1.4
 • Average SOI margin                                           3%              • Average SOI margin                                          12% • Average SOI margin            9%
 • Average Adj EBITDA                                          $1.1             • Average Adj EBITDA                                          $2.3 • Average Adj EBITDA          $2.1

          Profitability will benefit as we work through the raw material cycle
(a) For 2008-2009 and 2014-2018 see Segment Operating Income and Margin reconciliation in Appendix on page 31 and Adjusted EBITDA reconciliation on page 34                           24
Appendix
Strategy Delivering Strong Results
                                                                                    Segment Operating Income(a)
                 $2.5                                                                                                                                             14%

                                       Update for 2018                                                                                                            12%
                 $2.0
                                                                                                                                                                  10%
 (in billions)

                 $1.5
                                                                                                                                                                  8%

                                                                                                                                                                  6%
                 $1.0

                                                                                                                                                                  4%
                  $.5
                                                                                                                                                                  2%

                  $-                                                                                                                                              0%
                        2003     2004         2005         2006         2007        2008   2009   2010   2011    2012   2013   2014   2015   2016   2017   2018
                                                                             Americas        EMEA        Asia Pacific   SOI Margin

                   Generating stronger earnings throughout the earnings cycle
(a) See Segment Operating Income and Margin reconciliation in Appendix on page 31                                                                                 26
Modeling Assumptions
                 Volume Sensitivities                                                                             Pricing                                                        Translational Foreign Currency
               (Impact on Goodyear's Annual Units in 000's)                                        (Annual Impact of Effective Pricing Yield)                                               (Annual Impact on FX portion of SOI Walk)
• 1% Δ in U.S. Consumer OE Industry                                       ~120     • 1% Δ in U.S. Consumer Replacement                                  ~$36M''     • +/- 0.01 Δ USD/BRL      (e.g. R$3.79 to R$3.78 is favorable by 0.01)   +/-$0.3M
• 1% Δ in U.S. Consumer Replacement Industry                              ~355     • 1% Δ in U.S. Commercial Replacement                                ~$12M''     • +/- 0.01 Δ USD/CNY      (e.g. ¥6.75 to ¥6.74 is favorable by 0.01)     +/-$0.2M
• 1% Δ in U.S. Commercial OE Industry                                      ~10     • 1% Δ in European Consumer Replacement                              ~$31M''     • +/- 0.01 Δ USD/EUR      (e.g. €0.87 from €0.86 is favorable by 0.01)   +/-$3.1M
• 1% Δ in U.S. Commercial Replacement Industry                             ~30     • 1% Δ in European Commercial Replacement                            ~$10M''     • +/- 0.01 Δ USD/TRY      (e.g. ₺5.42 from ₺5.41 is favorable by 0.01)   +/-$0.1M
• 1% Δ in European Consumer OE Industry                                   ~130
• 1% Δ in European Consumer Replacement Industry                          ~370
• 1% Δ in European Commercial OE Industry                                  ~10
• 1% Δ in European Commercial Replacement Industry                         ~30

    Approximate Profit Margin Per Tire                                                            Tire Raw Material Spend                                                       Transactional Foreign Currency
                             (Industry Estimate)                                                                 (Annual Impact)                                                     (Annual Impact on Raw Material portion of SOI Walk)
• Consumer OE ≥17"                                                        ~$19     • 1% Δ in Synthetic Rubber Prices (3 to 4 month lag)                  ~$9M''     • +/- 0.01 Δ USD/BRL    (e.g. R$3.79 to R$3.78 is favorable by a 0.01)   +/- $0.9M
                                       ~$25 Average
• Consumer Replacement ≥17"                                               ~$28     • 1% Δ in Natural Rubber Prices (4 to 6 month lag)                    ~$6M''     • +/- 0.01 Δ USD/CNY (e.g. ¥6.75 to ¥6.74 is favorable by a 0.01)        +/- $0.2M
• Consumer OE
First Quarter 2019 – Liquidity Profile
    Terms: US$ billions

                                                                                                                        $3.5(a)

                                                                                   Available
                                                                                  Credit Lines

                                                                                    Cash &
                                                                                  Equivalents

(a) Total liquidity comprised of $860 million of cash and cash equivalents, as well as $2,683 million of unused availability under various credit agreements   28
First Quarter 2019 – Maturity Schedule
   Terms: US$ millions

                                                                                                                                                                        Undrawn Credit Lines
                                                                                                                                                                        Funded Debt

                                                                                        $1,715 (a)

                                                                                                                                            $113 (b)
                                                                                                                                                                                          $2,150

                                                                                                                                            $1,527                   $759 (c)

                                         $-
                                                                  $278                     $285                                                                        $140

                                      2019                      2020                     2021                     2022                     2023                     2024                 ≥ 2025

Note: Based on March 31, 2019 balance sheet values and excludes notes payable, finance and operating leases and other domestic and foreign debt
(a) At March 31, 2019 our borrowing base, and therefore our availability, under the U.S. revolving credit facility was $382 million below the facility’s stated amount of $2.0 billion
    At March 31, 2019 there were $285 million of borrowings and $37 million of letters of credit issued
(b) At March 31, 2019 the amounts available and utilized under the Pan-European securitization program totaled $246 million (€219 million)                                                         29
(c) At March 31, 2019 there were $140 million (€125 million) of borrowings and no letters of credit issued under the €800 million European revolving credit facility
Use of Historical and Forward-Looking
Non-GAAP Financial Measures
This presentation contains historical and forward-looking non-GAAP financial measures, including Total Segment Operating Income and Margin, Adjusted EBITDA, Free Cash Flow, Adjusted Net
Income and Adjusted Diluted Earnings Per Share (EPS), which are important financial measures for the company but are not financial measures defined by U.S. GAAP, and should not be
construed as alternatives to corresponding financial measures presented in accordance with U.S. GAAP.

Total Segment Operating Income is the sum of the individual strategic business units’ (SBUs’) Segment Operating Income as determined in accordance with U.S. GAAP. Total Segment
Operating Margin is Total Segment Operating Income divided by Net Sales as determined in accordance with U.S. GAAP. Management believes that Total Segment Operating Income and
Margin are useful because they represent the aggregate value of income created by the company’s SBUs and exclude items not directly related to the SBUs for performance evaluation
purposes. The most directly comparable U.S. GAAP financial measures to Total Segment Operating Income and Margin are Goodyear Net Income and Return on Net Sales (which is calculated
by dividing Goodyear Net Income by Net Sales).

EBITDA, as adjusted, represents Goodyear Net Income, as determined in accordance with U.S. GAAP (the most directly comparable U.S. GAAP financial measure to EBITDA), before interest
expense, income tax expense, depreciation and amortization expense, rationalization charges, and other (income) and expense. Management believes that Adjusted EBITDA is widely used by
investors as a means of evaluating the company’s operating profitability.

Free Cash Flow is the company’s Cash Flows from Operating Activities as determined in accordance with U.S. GAAP, less capital expenditures. Management believes that Free Cash Flow is
useful because it represents the cash generating capability of the company’s ongoing operations, after taking into consideration capital expenditures necessary to maintain its business and
pursue growth opportunities. The most directly comparable U.S. GAAP financial measure is Cash Flows from Operating Activities.

Adjusted Net Income is Goodyear Net Income as determined in accordance with U.S. GAAP adjusted for certain significant items. Adjusted Diluted EPS is the company’s Adjusted Net Income
divided by Weighted Average Shares Outstanding-Diluted as determined in accordance with U.S. GAAP. Management believes that Adjusted Net Income and Adjusted Diluted EPS are useful
because they represent how management reviews the operating results of the company excluding the impacts of rationalizations, asset write-offs, accelerated depreciation, asset sales and
certain other significant items.

It should be noted that other companies may calculate similarly-titled non-GAAP financial measures differently and, as a result, the measures presented herein may not be comparable to such
similarly-titled measures reported by other companies.

We are unable to present a quantitative reconciliation of our forward-looking non-GAAP financial measures, other than Free Cash Flow, to the most directly comparable U.S. GAAP financial
measures because management cannot reliably predict all of the necessary components of those U.S. GAAP financial measures without unreasonable effort. Those forward-looking non-GAAP
financial measures, or components thereof, would be reconciled to Goodyear Net Income, which includes several significant items that are not included in the comparable non-GAAP financial
measures, such as rationalization charges, other (income) expense, pension curtailments and settlements, and income taxes. The decisions and events that typically lead to the recognition of
these and other similar non-GAAP adjustments, such as a decision to exit part of our business, acquisitions and dispositions, foreign currency exchange gains and losses, financing fees, actions
taken to manage our pension liabilities, and the recording or release of tax valuation allowances, are inherently unpredictable as to if or when they may occur. The inability to provide a
reconciliation is due to that unpredictability and the related difficulty in assessing the potential financial impact of the non-GAAP adjustments. For the same reasons, we are unable to address
the probable significance of the unavailable information, which could be material to our future financial results.

                                                                                                                                                                                            30
Reconciliation for Segment Operating
Income/Margin   (a)

      Terms: US$ millions
                                                       Three Months Ended                                                                        Twelve Months Ended
                                                              March 31,                                                                              December 31,
                                                         2019          2018     2018      2017    2016    2015    2014    2013    2012    2011    2010    2009    2008    2007    2006    2005    2004    2003
  Total Segment Operating Income                       $     190     $    281 $   1,274 $ 1,556 $ 1,996 $ 2,020 $ 1,706 $ 1,577 $ 1,248 $ 1,368 $ 917 $ 372 $ 804 $ 1,230 $ 710 $ 1,060 $ 946 $ 419
    Rationalizations                                        (103)          (37)      (44)   (135)   (210)   (114)    (95)    (58)   (175)   (103)   (240)   (227)   (184)    (49)   (311)     (7)    (56)   (291)
    Interest expense                                         (85)          (76)    (321)    (335)   (372)   (438)   (444)   (407)   (385)   (350)   (335)   (311)   (320)   (468)   (447)   (408)   (369)   (296)
    Other Income (expense)                                   (22)          (37)     174      (70)    (25)    141    (286)    (82)   (111)    (53)   (167)    (40)    (59)     (9)     77     (62)    (23)   (317)
    Asset write-offs and accelerated depreciation              -            (1)       (4)    (40)    (20)     (8)     (7)    (23)    (20)    (50)    (15)    (43)    (28)    (37)    (88)     (4)    (10)   (133)
    Corporate incentive compensation plans                    (1)           (4)      (13)    (33)    (76)   (103)    (97)   (108)    (69)    (70)    (71)    (41)      4     (77)    (66)    (28)     (3)      -
    Pension curtailments/settlements                           -             -         -       -       -    (137)    (33)      -       1     (15)      -       -      (9)    (64)      -       -       -       -
    Intercompany profit elimination                            4             3        (4)     (2)     (2)     (3)      9       7      (1)     (5)    (14)    (13)     23     (11)     (9)     13      (6)     14
    Loss on deconsolidation of Venezuelan subsidiary           -             -         -       -       -    (646)      -       -       -       -       -       -       -       -       -       -       -       -
    Retained expenses of divested operations                  (3)           (3)       (9)    (13)    (18)    (14)    (16)    (24)    (14)    (29)    (20)    (17)      -     (17)    (48)    (52)    (12)      -
    Other                                                    (18)          (13)      (42)    (50)    (66)    (90)    (50)    (69)    (34)    (75)    (47)    (37)    (45)    (53)    (20)    (60)    (86)    (53)
  Income (Loss) from Continuing Operations
                                                       $      (38)   $      113    $    1,011 $   878 $ 1,207 $ 608 $ 687 $ 813 $            440 $     618 $        8 $ (357) $ 186 $          445 $ (202) $       452 $      381 $ (657)
  before Income Taxes
  United States and Foreign Tax Expense (Benefit)               6            33           303     513     (77)  232 (1,834)   138            203       201    172       7    209               255     60          233        208    117
  Less: Minority Shareholders Net Income                       17             5            15      19      20    69      69    46             25        74     52      11     54                70    111           95         58     33
  Income (Loss) from Continuing Operations             $      (61)   $       75    $      693 $   346 $ 1,264 $ 307 $ 2,452 $ 629 $          212 $     343 $ (216) $ (375) $ (77) $            120 $ (373) $       124 $      115 $ (807)
  Discontinued operations                                       -             -             -       -       -     -       -     -              -         -      -       -      -               463     43          115          -      -
  Cumulative effect of account change                           -             -             -       -       -     -       -     -              -         -      -       -      -                 -      -          (11)         -      -
  Goodyear Net Income (Loss)                           $      (61)   $       75    $      693 $   346 $ 1,264 $ 307 $ 2,452 $ 629 $          212 $     343 $ (216) $ (375) $ (77) $            583 $ (330) $       228 $      115 $ (807)

  Net Sales (as reported)                                  $3,598         $3,830       $15,475 $15,377 $15,158 $16,443 $18,138 $19,540 $20,992 $22,767 $18,832 $16,301 $19,488 $19,644 $18,751 $18,098 $18,353 $15,102
  Return on Net Sales (as reported)                         (1.7)%          2.0%          4.5%    2.3%    8.3%    1.9% 13.5%      3.2%    1.0%    1.5%   (1.1)% (2.3)% (0.4)%     3.0%   (1.8)%   1.3%    0.6%   (5.3)%
  Total Segment Operating Margin                              5.3%          7.3%          8.2%   10.1% 13.2% 12.3%        9.4%    8.1%    5.9%    6.0%     4.9%   2.3%    4.1%    6.3%     3.8%   5.9%    5.2%     2.8%

(a)   2010 – 2015 have been restated for the new guidance on the presentation of debt issuance and amortization costs effective in 2016, 2003 – 2009 have not been restated. 2016 – 2017 have been restated in alignment with the
      new pension accounting standard adopted in 2018, 2003 – 2015 have not been restated. 2003 - 2012 have not been restated for the Americas consolidation. In July 2007, the Engineered Products business was sold; in 2005 -      31
      2007 results from Engineered Products have been included in discontinued operations, 2003 - 2004 includes income from Engineered Products in income from continuing operations. 2014 and prior includes results from
      Venezuela. Venezuela was deconsolidated in 2015
First Quarter 2019 Significant Items
(After Tax and Minority Interest)

  Terms: US$ millions,
   Terms: US$ millions,
      (except EPS)
       (except EPS)

                                                           Rationalizations,     Indirect Tax       Legal Claims
                                                                                                                                        Brazil
                                                           Asset Write-offs, Settlements and         Related to                            Net Insurance
                                        As         Discrete Tax                       Insurance    Transaction                      Transportation       Pension
                                     Reported As      Itemsand Accelerated
                                                                     Asset Sales Discrete  Tax
                                                                                      Recovery     Discontinued
                                                                                                      Costs      Hurricane Effect         Recovery from
                                                                                                                                        Strike         Settlement     As Adjusted
   Net Sales                       $         Reported
                                          3,841   $          -Depreciation
                                                                   $           -   $ Items -      $ Operations
                                                                                                             -   $     Asset-Sales $         Hurricanes
                                                                                                                                               -     $         As
                                                                                                                                                                - Adjusted
                                                                                                                                                                     $      3,841
   Cost ofNet Sales
           Goods Sold                      $
                                          2,949  3,598 $-                - - $               --   $          - -     $        -   -       $      (7)    -      $-    3,598 2,942
   Gross Margin
          Cost of Goods Sold                892 2,879        -           - -                 --              - -              -   -               7     -       -    2,879 899
         Gross Margin                               719                  -                   -                 -                  -                     -              719
   SAG                                     588             -                 -               -              -                -                      -                 -                 588
   Rationalizations                         (2)            -                 -               -              -                -                      -                 -                  (2)
          SAG                                       547                -                   -                    -                    -                        -                   547
   Interest Expense                         78             -                 -               -              -                -                      -                 -                  78
          Rationalizations
   Other (Income) Expense                   45
                                                    103    -
                                                                      (103) 2              - 2              (11)
                                                                                                                -                (8)
                                                                                                                                     -              -
                                                                                                                                                              -           (3)
                                                                                                                                                                                  -      27
          Interest
     Pre-tax  IncomeExpense                183       85    -           -      (2)          - (2)              11-                 8 -                   7     -            3        85  208
   Taxes Other (Income) Expense             19       22      28        -      (1)          - (1)               3 (5)         -             5            2        3         1        25   51
   MinorityPre-tax
             Interest Income (Loss)          7      (38)   -           103 -               --               -     5          -            (5)       -           (3)   -             62    7
   Goodyear
          TaxesNet Income           $      157    $ 6      (28)   $      18 (1) $             (1) $
                                                                                            (7)                8 1$              8        $
                                                                                                                                          (1)           5   $ (1)         2     $ 16    150
         Minority Interest                           17                -                   (16)               -                       -                       -                      1
   EPS                         $          0.65    $
         Goodyear Net Income (Loss)       $         (61) (0.10)
                                                          $       $
                                                                         85(0.01)$ $      (0.01) $
                                                                                            23 $           0.03
                                                                                                                  4$ $      0.03          $
                                                                                                                                          (4)   $ 0.02      $
                                                                                                                                                                (2)   0.01
                                                                                                                                                                      $         $
                                                                                                                                                                                    45 0.62

         EPS                              $       (0.26)   $          0.36       $        0.10    $          0.02      $             (0.02)     $           (0.01)    $          0.19

                                                                                                                                                                                          32
First Quarter 2018 Significant Items
(After Tax and Minority Interest)

  Terms: US$ millions,
     (except EPS)
                                              Rationalizations,
                                             Asset Write-offs,                            Pension             TireHub
                                   As         and Accelerated        Discrete Tax         Standard          Transaction         Hurricane
                                Reported        Depreciation            Items              Change              Costs             Effect           As Adjusted
     Net Sales                $      3,830   $               -       $         -        $        -         $         -        $         -         $     3,830
     Cost of Goods Sold              2,976                     (1)             -                 -                   -                  -               2,975
     Gross Margin                      854                      1              -                 -                   -                  -                 855

     SAG                              591                    -                -                  -                  -                   -                591
     Rationalizations                  37                    (37)             -                  -                  -                   -                -
     Interest Expense                  76                    -                -                  -                  -                   -                  76
     Other (Income) Expense            37                    -                -                      (9)                (4)                 (3)            21
       Pre-tax Income                 113                      38             -                       9                  4                   3           167
     Taxes                             33                      11                 (7)                 2                  1              -                  40
     Minority Interest                  5                    -                -                  -                  -                   -                   5
     Goodyear Net Income      $        75    $                 27    $            7     $            7     $            3     $             3     $      122

     EPS                      $      0.31    $              0.11     $       0.03       $       0.03       $       0.01       $        0.01       $      0.50

                                                                                                                                                                33
Reconciliation for Adjusted EBITDA

              ($ in millions)
                                                                                                                              Year Ended December 31,
                                                                                2018                  2017                  2016                 2015(b)               2014(b)               2009(b)               2008(b)
              Goodyear Net Income (Loss)                                             $693                  $346               $1,264                   $307               $2,452                  ($375)                   ($77)
              Interest Expense                                                        321                   335                  372                    438                  444                    311                     320
              Income Tax Expense (Benefit)                                            303                   513                  (77)                   232               (1,834)                     7                     209
              Depreciation and Amortization                                           778                   781                  727                    698                  732                    636                     660
              Other(a)                                                               (130)                  205                  235                    619                  381                    267                     243
              EBITDA, as adjusted                                                 $1,965                $2,180                $2,521                $2,294                $2,175                    $846              $1,355

(a) Other includes rationalization charges, other income and expense and the loss on the deconsolidation of our Venezuela subsidiary effective December 31, 2015
(b) 2009-2008 have not been restated for the guidance on the presentation of debt issuance and amortization costs effective in 2016. 2015-2014 and 2009-2008 have not been restated for the pension accounting standard adopted in 2018   34
Reconciliation for Total Debt and Net Debt
 Terms: US$ millions

                                                                  March 31,    December 31,       March 31,
                                                                    2019           2018             2018

      Long-Term Debt and Finance Leases                       $        5,545   $      5,110   $        5,600
      Notes Payable and Overdrafts                                       495            410              332
      Long-Term Debt and Finance Leases Due Within One Year              466            243              327
       Total Debt                                             $        6,506   $      5,763   $        6,259
      Less: Cash and Cash Equivalents                                    860            801              837

      Net Debt                                                $        5,646   $      4,962   $        5,422

                                                                                                               35
You can also read