Analyst Meeting No. 3/2020
     14 October 2020
←
→
Page content transcription
If your browser does not render page correctly, please read the page content below
Analyst Meeting No. 3/2020
14 October 2020
Agenda
•   Economic growth and inflation projections
•   Monetary policy decisions, financial and credit measures
•   Key factors affecting outlook of the Thai economy

                                                               2/23
Outlook of the Thai economy
The Thai economy is expected to contract
2019* 2020E 2021E significantly in 2020 as a result of the COVID-19
GDP Growth 2.4 -7.8 3.6 outbreak and is likely to expand moderately in 2021
(-8.1) (5.0) due to limitation in admitting foreign tourists.
Headline Inflation 0.7 -0.9 1.0 Headline inflation in 2020 is expected to be less
(-1.7) (0.9) negative as oil prices increase and would turn
Core Inflation 0.5 0.3 0.2 positive in 2021 while being close to the lower bound
(0.0) (0.1) of the target range.
Going forward, economic growth and inflation
* Outturn, E Estimated projections remain highly uncertain with risks of being
( ) Monetary Policy Report, June 2020
below the baseline scenario.
Source: Monetary Policy Report, September 2020
3/23
Details of the economic forecasts
2020E 2021E
(% YoY) 2019* The impacts of the worldwide COVID-19
Jun 20 Sep 20 Jun 20 Sep 20
GDP Growth 2.4 -8.1 -7.8 5.0 3.6 pandemic are severe. The recoveries of tourism
- Private Consumption 4.5 -3.6 -3.5 2.5 2.0
and merchandise exports remain highly
- Private Investment 2.8 -13.0 -11.4 5.6 4.2
- Government Consumption 1.4 3.8 3.4 3.1 5.1 uncertain.
- Government Investment 0.2 5.8 8.8 14.1 11.4
- Exports of Goods and Services -2.6 -22.7 -21.2 8.4 4.3
Domestic demands both in terms of private
- Imports of Goods and Services -4.4 -18.9 -16.6 7.3 4.4 consumption and private investment are
Current Account (Billion USD) 37.0 15.5 14.0 20.2 14.6 expected to improve slightly while employment
- Value of Merchandise Exports -3.3 -10.3 -8.2 4.5 4.5 and income remain weak which will take some time
- Value of Merchandise Imports -5.6 -16.2 -13.7 4.1 4.4
Headline Inflation 0.7 -1.7 -0.9 0.9 1.0
to recover.
Core Inflation 0.5 0.0 0.3 0.1 0.2
The recovery will be greatly uneven among
Assumptions
economic sectors, regions, and firms in different
- Number of Tourists (Million) 39.8 8.0 6.7 16.2 9.0
- Dubai Oil Price (USD/Barrel) 63.5 35.1 41.5 37.0 45.8
segments.
Note: * Outturn, E Estimated
Source: Monetary Policy Report, September 2020
4/23
Thai economic recovery remains highly uncertain and depend primarily on the
                                                                                         re-opening of the country to foreign tourists.
  Number of daily foreign tourist arrivals through 5 major airports*
Persons  China ordered travel agencies to suspend
140,000 tourism-related operations on Jan 24, 2020.
                                                                     2019                  2020
                           On Mar 26, the Emergency
120,000                                               From Jul 1, eleven categories of non-leisure
100,000
                           Decree became effective.   visitors have been allowed to enter Thailand.           • The outbreak situation abroad is more
 80,000                                                                                                         prolonged than expected owing to second
 60,000
                                                                                      From Jul 22, four
                                                                                                                waves of the outbreak in several countries as
 40,000                                                                               categories of foreign
                                                                                      visitors have been        well as uncontainable pandemic situations in
 20,000                                                                               allowed to enter
                                                                                      Thailand.                 some countries .
      0
          15 Feb
          24 Feb

          13 Aug
          22 Aug
          31 Aug
             8 Jul
           17 Jul
           26 Jul
            1 Jan
           10 Jan
           19 Jan
           28 Jan

            4 Mar
          13 Mar
          22 Mar
          31 Mar
            9 Apr
          18 Apr
          27 Apr

            2 Jun
          11 Jun
          20 Jun
          29 Jun
           6 May
          15 May
          24 May
            6 Feb

            4 Aug                                                                                             • The re-opening of the country to foreign
     Note: * 5 major airports include Suvarnabhumi, Donmuang, Chiang Mai, Hat Yai and                           tourists is likely to be gradual and is expected
     Phuket International Airports
     Source: TAT Intelligence Center                                                                            to be opened more widely during the second
   Projected number of foreign tourists                                                                         half of 2021.
                                                              2020                      2021
                (Million)
                      June 20                                  8.0                       16.2
                  September 20                                 6.7                       9.0
                                                                                                                                                                   5/23
Thai exports experienced a slower recovery compared to other countries in the region
and recorded a 12 percent contraction due to structural factors
Percent (2019) Share of export products compared to other regional countries
100
Changes in export values compared to regional countries , seasonally adjusted 1/ 80
(compared 4th quarter 2019 with trough during COVID crisis and July 2020) 60
Percent 40
9
10 7 20
-2 -2 -5
0 -6 -9
0
-12 -13 TH KR ID TW PH VT MY SG HK
-10 -6 -3 Others Petroleum product Chemical
Machinery transports Electrical appliance
-20 -18 -20 -19 Electronics Agro manu. Agriculture
-30 -23
-27 -28
-40 Share of Thai export market compared to other regional countries
Percent (2019)
100
-50
-50 80
-60
60
40
trough during the COVID-19 crisis the latest data as of Jul 20 20
0
Note: 1/ Thai export excludes gold. Hong Kong and Singapore exports exclude re-export MYASEAN SG ChinaTH ID
Japan USKR EUTW Middle
PH East VT OthersHK
Source : Trade map, Customs Department, calculated by Bank of Thailand 6/23Thai economic recovery would take at least two years before returning to
the pre-pandemic level while many risk factors remain and warrant close monitoring.
Projection of Thai economic growth in various cases
Real GDP seasonally adjusted, Projection period
natural log Vulnerable period Factors that could delay the recovery
• Re-opening country to foreign
Base case visitors could not be commenced
until vaccines become widely
available.
Case of long delay in re-opening • The global economy could
country to foreign tourists
significantly contract again due to
occurrences of a more severe
outbreak that could trigger stricter
Q1 Q2 Q3 Q4 Q1 Q2 Q3 Q4 Q1 Q2 Q3 Q4 Q1 Q2 Q3 Q4 Q1 Q2 Q3 Q4 Q1 Q2 Q3 Q4
containment measures.
2017 2018 2019 2020 2021 2022
7/23Headline inflation would gradually rise in line with economic recovery
and stay close to the lower bound of the target range in 2021
Contribution of headline inflation
3 %YoY
2
1 Aug 20 • Headline inflation projection for 2020 is
0
-1 -0.50% less negative due mainly to upward revision
-2
-3
in oil prices assumption.
-4
Jan Jul Jan Jul Jan Jul Jan Jul Jan Jul Jan Jul Jan Jul • Core inflation projection is revised upward
14 15 16 17 18 19 20
as government measures in reducing utility
Raw food (15.69%) Energy (11.75%) Core Inflation (72.56%) Headline Inflation
Sources: Ministry of Commerce calculated by Bank of Thailand, () Share in Headline Inflation expenses exhibit smaller-than expected
Projection of inflation rates impacts on inflation. Nevertheless, overall
% YoY 2019* 2020 2021 core inflation is expected to remain at a low
Headline inflation -0.9 1.0 level.
0.7
(-1.7) (0.9)
Core inflation 0.3 0.2
0.5
(0.0) (0.1)
* Outturn, ( ) Monetary Policy Report, June 2020 8/23Risks to the Thai financial system remain high following
a sharp economic contraction caused by the COVID-19 outbreak.
The economic recovery will take some time and is likely to be highly uneven.
Risks to the Thai financial system remain high due to a sharp economic contraction this
year which could result in the following:
• Deterioration of households and businesses’ balance sheet and increased risk of defaults.
Financial stability remains sound in several aspects.
• Financial institution stability: high levels of capital fund and loan loss provision which are
preserved to withstand economic uncertainties.
• External stability: high level of international reserves and low external debt to GDP
• Fiscal stability: low level of pre-COVID public debt with long average maturity while most of
the debt is denominated in Thai baht.
The Thai economic recovery would take at least two years before returning to the pre-pandemic
level while facing many uncertainties. Moreover, the recovery would be highly uneven among
economic sectors, regions and firms in each segment. This could affect the long-term potential
economic growth.
9/23The MPC pro-actively implemented accommodative monetary policy
since the beginning of the COVID-19 outbreak.
The policy rate was cut three times from 1.25 percent to a historically low record of 0.50 percent
MPC Meeting No.1 (Feb 5) Early signs of risks from the COVID-19 outbreak were observed
Special MPC Meeting (Mar 20) The COVID-19 outbreak would severely affect the
GDP forecast economy, liquidity as well as the functioning of the Thai
MPC Meeting No. 2 (Mar 25) in 2020 – 5.3% financial markets.
BOT announced a reduction in the FIDF Global economic activities were disrupted by the containment
contribution by 0.23 percent (Apr 7) measures, which led to a-more-severe-than-expected impacts on the
economy, employment and financial stability.
MPC Meeting No. 3 (May 20) Several measures pro-actively implemented should be evaluated
GDP forecast
MPC Meeting No. 4 (Jun 24) in 2020 – 8.1% before implementing additional measures.
MPC Meeting No. 5 (Aug 5) Limited monetary policy space should be preserved
GDP forecast and used only in the most effective timing.
MPC Meeting No. 6 (Sep 23) in 2020 – 7.8%
The MPC stands ready to use additional appropriate monetary policy tools if necessary.
10/23Financial conditions in Thailand continued to be accommodative as reflected by
low policy interest rate and low short-term rates in the financial market
together with declining new loan rates.
Policy interest rates in emerging markets Government bond yields Reference loan rates of commercial banks
Percent Percent Percent
per year per year per year
Dec-19 Oct-20 1.75 policy interest rate 9
6 MLR 1/ NLR 2/ policy interest rate
2-year government bond 8
5 1.50 3-month government bond Oct 7, 2020
7
4 1.25 6
5 5.36
3 1.00 4
2 0.75 Oct 7, 2020 3 3.52*
1 2
0.50 1
0 0 0.50
0.25
ID IN PH MY KR TH
Jan-06
Jan-08
Jan-10
Jan-12
Jan-14
Jan-16
Jan-18
Jan-20
Jan-20
Mar-20
Apr-20
Jul-20
Oct-20
Feb-20
Jun-20
Aug-20
Sep-20
May-20
Source: Bloomberg
Note: Policy interest rate as of Oct 7, 2020 1/ Calculated by averaging the monthly minimum lending rates (MLR)
Source: ThaiBMA
of 5 largest commercial banks
2/ The new loan rate (NLR) published in the table FM_RT_001_S2
interest rates in the financial markets (2005-present) latest data in Aug 2020
* Latest NLR data is in Aug 2020
Article in the box: the new loan rates: true lending costs of businesses Monetary Policy Report, September 2020 11/23Thai baht depreciated from the previous quarter in line with
the declining current account surplus. If the baht were to appreciate rapidly,
the economic recovery would be affected. The MPC would assess the necessity of
implementing additional appropriate measures.
Percentage change of regional currencies from the end of the previous year Current account balance to GDP
percent percent
6% 12%
4.8% 4.8% Forecast
4% 10%
2.9%
Average between 2017 – 2019
2% 8% 7.3 percent
0% -0.3%
6%
-0.8%
-2% -1.2% Average between 2020 – 2021
4% 2.8 percent
Depreciation against the U.S. dollar -2.7%
-4%
-4.1% 2%
-6% -5.2%
0%
PHP
KRW
TWD
SGD
CNY
THB
MYR
INR
IDR
2017 2018 2019 2020F 2021F
Source: Bank of Thailand and Reuters (as of October 7, 2020) Source: Bank of Thailand
12/23Government should continuously implement policies in a targeted and
timely manner to facilitate appropriate adjustments of businesses and households.
Policies should also be coordinated, coherent and consistent.
H1/20 COVID-19 (lockdown) H2/20 . . . . .
The economy gradually recovered
The economy was affected by the COVID-19 • It would take at least two years before returning to
outbreak, especially the implementation of strict the pre-pandemic level.
Excessive
containment measures which led to disruptions • The economy would face many high uncertainties.
production
of economic activities. • The recovery would be greatly uneven among capacity
economic sectors, regions and firms in each segment.
Broad-based and timely Continuously, targeted and timely
Policy Focus to facilitate appropriate adjustments of businesses and households
implemented pro-active
Monetary policy monetary policy accommodation Continue to be accommodative
since the beginning of the year
Financial and credit promptly introduced a broad-based Distribute liquidity in a targeted manner and pro-actively implement debt
debt moratorium, liquidity injection
measures and lessen debt servicing burden restructuring to support changing business structure.
implemented temporary relief Fiscal and supply-sided policies should take a greater roles to address excessive production
Fiscal and supply- measures to alleviate and remedy capacity, support the changing economic structure, patterns of business operation and
sided policies those affected by the outbreak labor skill development to be consistent with the post-COVID environment.
13/23Government should continue to implement financial and credit measures
with more emphasis on targeted measures.
Distribute liquidity Pro-active debt restructuring
to affected households and businesses that is consistent with changing business structures and
in a targeted and timely manner borrowers’ flow of income
• Enhance the effectiveness of the BOT’s soft loan program
Business-sector borrowers
through the special credit guarantee facility called PGS Soft
Loan Plus totaled 57,000 million baht. • “The DR BIZ program” helps solve existing debt problems of
• Revise framework of credit measures previously announced businesses with multiple creditors as well as provides new
to be more targeted as well as covering more affected credits to potential borrowers.
groups, especially small SMEs in tourism-related businesses. Retail borrowers
• Establish a certain standard regarding credit term to speed up • Debt restructuring for retail borrowers by implementing debt
payments from the suppliers and increase liquidity to SMEs. consolidation that does not ruin credit history, lessen debt
• Encourage digital lending and digital factoring for households servicing burden with no additional cost while remaining credit
and SMEs to provide them an easier access to financial lines remain usable.
services.
Article in the box: Additional financial and credit measures from the government, Monetary Policy Report, September 2020
14/23Government should accelerate job creation, especially sectors that are severely affected
but have good potential and these measures should be region-specific in line with their economic activities.
The number of unemployed and underemployed increased Each economic sector was affected differently, while those Workers moved to their domicile and some got employed locally
significantly, although the figures slightly improved following relying heavily on foreign demand were severely affected. but concentrated in the low-paid sectors.
the relaxation of containment measures. The number of working hour missing due to the temporary
suspension of business (section 75) Unemployed and underemployed
Million people (3-month moving average, seasonally adjusted) Missing an-Month (1,000 Man-Month) workers (persons)
6 400 Motor
Underemployed workers (working less than 4 hours per day)
Rubber and plastic 1,046 319,386
5 Unemployed workers
300 Electronics Top two provinces with the highest
4 Aug 2020 Other manufacturing unemployment are Nakhon Ratchasima and
Restaurant and recreation Nakhon Si Thammarat.
3 200
Hotel and tourism share of each economic sector in absorbing workers
2 Commerce
100 Transportation
1 Others 6%
commerce 9% agriculture
0 0 13% 50%
Aug-19
Aug-20
Feb-20
Mar-20
Sep-19
Jul-20
Apr-20
Oct-19
May-20
Jun-20
Dec-19
Jan-20
Nov-19
Jan-14
Jan-15
Jan-16
Jan-17
Jan-18
Jan-19
Jan-20
Jul-13
Jul-14
Jul-15
Jul-16
Jul-17
Jul-18
Jul-19
Jul-20
7%
15%
Source: Department of Labor Protection and Welfare, calculated by Bank Source: National Statistical Office,
Source: Social Security Office, calculated by Bank of Thailand
of Thailand calculated by Bank of Thailand
Should accelerate job creation both Should encourage potential business sectors to Should design area-based policy to match
maintain employment and develop labor skills. region-specific economic activities
full-time and part-time job
15/23Appendix
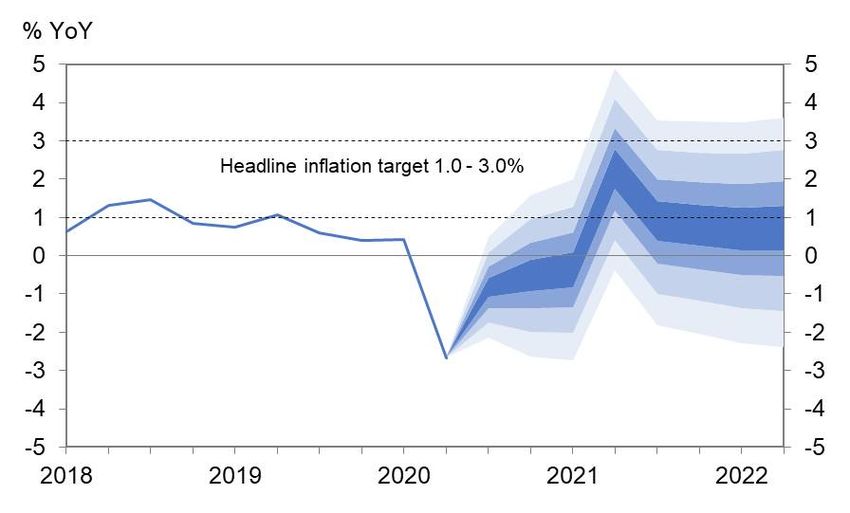
16/23Risks to growth and inflation projections tilt downward.
Growth forecast
Note: Fan chart covers 90% of the probability distribution
Headline inflation forecast Core inflation forecast
Note: Fan chart covers 90% of the probability distribution Note: Fan chart covers 90% of the probability distribution
17/23Forecast assumptions
%YoY 2019* 2020 2021
Trading partners’ GDP growth (% YoY)2/ 2.7 -4.5 (-4.6) 4.4 (4.2)
Fed funds rate (% year end) 1.50 - 1.75 0.00 - 0.25 (0.00 - 0.25) 0.00 - 0.25 (0.00 - 0.25)
Regional currencies per USD (excl. RMB)3/ 156.6 158.2 (159.5) 156.6 (159.5)
Dubai oil price (USD per barrel) 63.5 41.5 (35.1) 45.8 (37.0)
Farm income (% YoY) 2.4 -1.7 (-3.7) 3.4 (5.7)
Government consumption (billion baht)1/ 2,723 2,833 (2,871) 3,038 (3,028)
Government investment (billion baht)1/ 966 1,051 (1,029) 1,182 (1,184)
Note: 1/assumption includes spending on infrastructure investment plans
2/weighted by each trading partner’s share in Thailand’s total exports
3/increasing index represents depreciation. Decreasing index represents appreciation.
* Outturn
( ) previous assumptions in Monetary Policy Report, June 2020
18/23Assumptions on trading partner’s GDP growth
%YoY Weight
2019* 2020 2021
(%)
United States 18.2 2.2 -5.4 (-7.0) 3.4 (3.2)
Euro area 9.9 1.3 -7.8 (-10.0) 4.5 (4.2)
Japan 14.3 0.7 -5.9 (-5.4) 2.0 (1.7)
China 17.0 6.1 2.1 (0.9) 8.4 (8.9)
Asia (excluding Japan and China)** 32.4 2.7 -5.6 (-3.9) 4.2 (3.6)
Total*** 100 2.7 -4.5 (-4.6) 4.4 (4.2)
Note: *Outturn
**weighted by 7 trading partners’ shares in Thailand’s exports in 2019: Singapore (5.1%) Hong Kong (6.8%)
Malaysia (6.1%) Taiwan (2.3%) Indonesia (5.3%) South Korea (2.7%) and the Philippines (4.0%)
***weighted by proportion of Thai exports to 13 trading partner’s countries in 2019 (including the UK and Australia)
( ) previous assumptions in Monetary Policy Report, June 2020
19/23Changes in Dissemination Frequency of the Financial Account in the Balance of Payment (BOP)
from Monthly basis to Quarterly basis
20/23Changes in dissemination frequency of the financial account in the balance
of payment from a monthly basis to a quarterly basis
Rationale for changing Improvements
dissemination frequency Reduce user confusion induced by frequent
Discrepancy between preliminary and actual data revision and large revision
leads to large revision which could mislead users.
BOT publishes Key BOP data as indicative
Loss of main data source due to the relaxation of estimates with one-month lag time.
regulation regarding cross-border transactions and the
BOT’s policy to lessen data reporting burden. New practice is comparable to
other countries’ standard
Cross-border transactions become more complex as
payments could be settled through electronic IMF recommended to disseminate BOP data on
payment rather than settling through commercial quarterly basis. This new practice is adopted by
banks. most countries.
21/23New BOP and FA data dissemination practice will start from October 30, 2020 onward.
New data dissemination practice will start from October 30, 2020 onward.
Summarized BOP data will be released on a monthly basis, called “partial BOP”:
Current Account (CA) - maintain similar level of detail and release with 1-month lag
Financial Account (FA) – release only FA of Central Bank, General government and Other depository corporations
BOP
Balance of Payments
with 1-month lag
Detailed BOP data will be released on a quarterly basis:
CA & FA – maintain similar level of detail and release with 1-month lag to be in line with the survey results
Frequency of data adjustments will be reduced.
FA data will be released on a monthly basis, called “partial FA”:
Indicative estimates of FA in the nonbank sector will be released with (1) the recent 2
FA to 4 months estimates (2) 1-month lag and (3) only 6 key components
(i.e. direct investment, portfolio investment, currency and deposits and loans)
Financial Account
Cancel the previous format of monthly FA time series
Read additional details in the Stat Horizon article titled “Ease of doing business and policy trade-offs: Reconsidering Dissemination Frequency for the Balance of Payments” retrieved from
https://www.bot.or.th/Thai/Statistics/Articles/Pages/HorizonPage.aspx
22/23Example of new dissemination format
Balance of Payment (summary) Monthly economic indicators: Balance of Payment
Reduce some categories Add balance of payment table
2020 E 2563 E
2562 p 2020 E
… Jul E Aug E Sep E 2019 P ก.ค. E ส.ค. E ก.ย. E
Q1P Q2P
1. Exports (f.o.b.) JulE AugE SepE
General government
2. Imports (f.o.b.)
Central bank
3. Trade balance
Other depository corporations
4. Net services, primary income and secondary income
Other sectors:
5. Current account balance
6. Capital account Foreign Direct Investment
7. Financial account - Exclude Trade credits and Reinvested earnings
8. o/w: Central bank
- Include Trade credits and Reinvested earnings
9. General government
Thai Direct Investment Abroad
10. Other depository corporations
- Exclude Trade credits and Reinvested earnings
11. Other sectors
- Include Trade credits and Reinvested earnings
12. Other financial corporations
Portfolio investment (Assets)
13. Nonfinancial corporations, households, and NPISHs
Portfolio investment (Liabilities)
14. Net errors & omissions
Currency and deposits
15. Overall balance
Loans
23/23You can also read