The National Skills Academy for Rail (NSAR) Skill, planning and productivity - Albert Island
←
→
Page content transcription
If your browser does not render page correctly, please read the page content below

The National Skills Academy for Rail (NSAR) Skill, planning and productivity
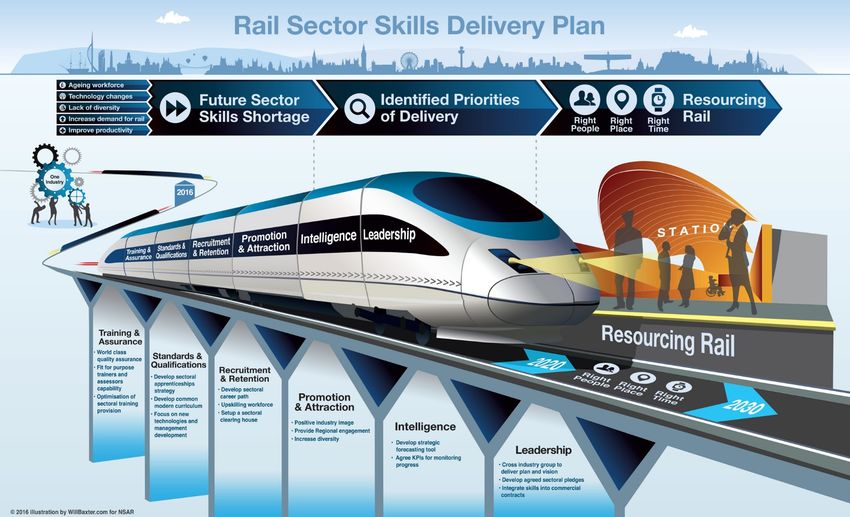
CONTEXT
 Skills shortages across all infrastructure sectors
 are putting at risk the National Infrastructure
 Plan – cost and schedule.

 Skills are not an end in their own right but one of
 the drivers of productivity

 Government has announced:
 - a productivity plan where skills is one of the
 principal drivers
 - a target of 3m apprenticeships
 - a levy to help pay for this
 - 30,000 transport apprentices
 - DfT transport skills strategy
 - RSG leading ‘sector strategy’ (productivity)

 DfT, organisations and individual business all
 recognise and are addressing the skills
 shortages. A s tro n g c ollective re s p o n s e will
 require co-ordination and support.

 Not just engineering skills.

Update summary

Skills forecasting underway at
national and now company level          What does this mean for me?

Strategic workforce planning eg route
                                        • Have I got a clue about
Procurement changes                       what my workforce looks
                                          like in 5 years?
Sector deal                             • How can I prove I will be
                                          productive?
Productivity scorecard and pilots
                                        • How do I know if I am
Wider economic impact - treasury
                                          ticking the right boxes at
                                          tendering?
Apprenticeship levy, service and        • Am I influencing the right
forecasts
                                          things/people?
Today’s Workforce (1) – Population of 223,856

                                  Gender imbalance is decreasing, from
                                  approximately 4% in rail engineering
                                  four years ago, the figure is now closer
                                  to 10%. More needs to be done though.
                                  Operations figures contain all TOCs.
                                  There are more staff at Level C than B,
                                  indicating multiple management layers
                                                                             5
Today’s Workforce (2) – Population of 223,856

Asset Type                       Region

                                                6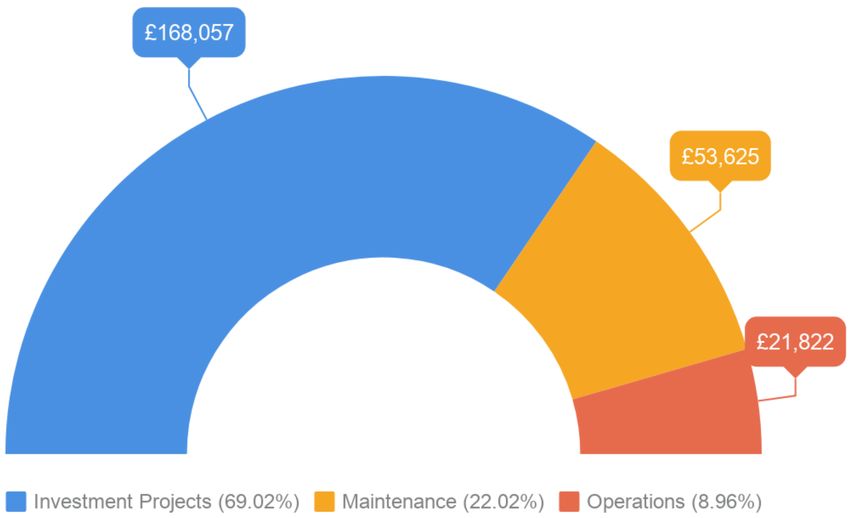
Today’s Workforce (3) – Population of 223,856

                                                                                                  Minimum Age   16

                                                                                                    Mean Age    42

                                                                                                   Median Age   42

                                                                                                  Maximum Age   90

                                                                                                     At 65+     2.7k

    The age profile shows the mean and the median to be the same, at 42. The 46-50 age category
    depicts the highest proportion of the workforce, with 14%. Just over one quarter of the workforce are
    over 50. These workers will need to be replaced as they retire between now and the close of CP8.
Investment Plans (1)

                              Σ Investment (£millions)         By Region (£millions)
Investment (£millions)

                         By Work Type
                         (£millions)

                                                         These charts show total planned investment until
                                                         end of CP8 depicted over time, then proportions
                                                         of investment by organisation, work type and
                                                         asset. DfT is Rolling Stock

                                                                                                      8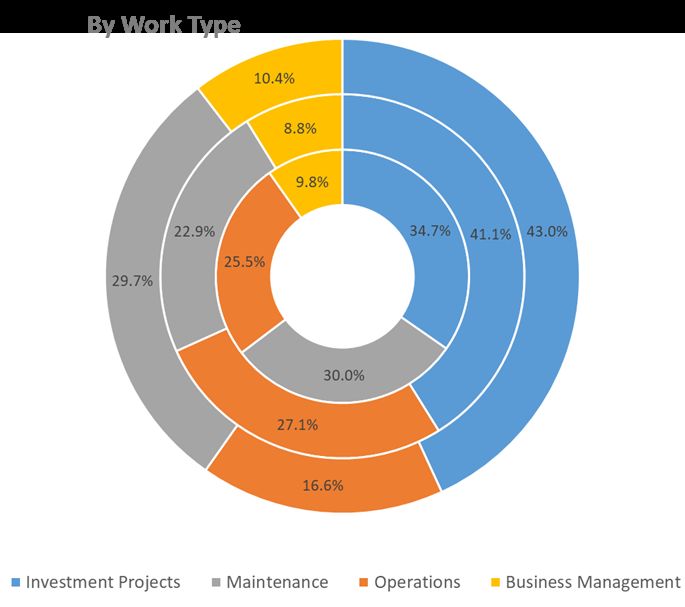
Investment Plans (2)

By Investor (£millions)

                                                   By Asset Type

                                                                   9
                          Investment (£millions)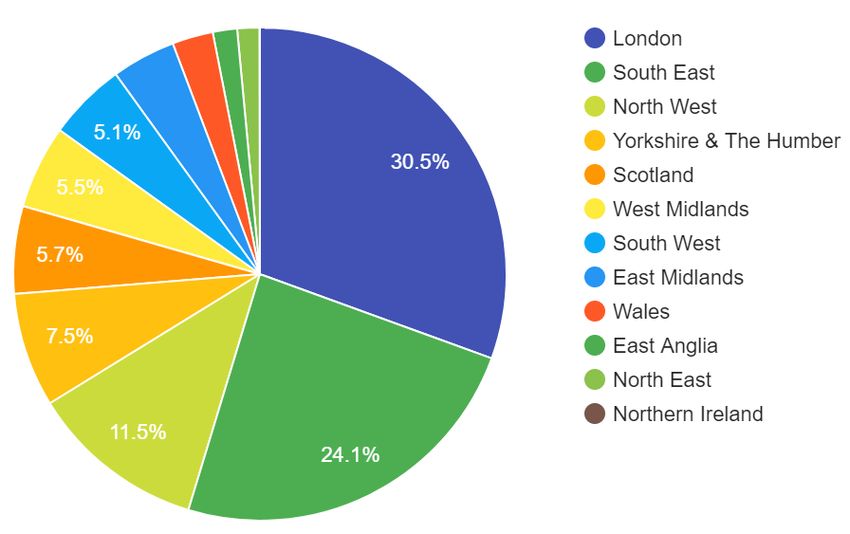
Future Workforce (1) : Outputs : 2020 = 226,563;
and 2024 = 203,038

     Graph showing the total future workforce required in 2020 & 2024 factoring in the cumulative
     number of retirees in these years also. Over these years, an average of 217,819 will be required.
                                                                                                         10
Future Workforce (2) : Outputs : 2020 = 226,563;
and 2024 = 203,038
By Skill Level
Today
2020
2024
Charts showing the total predicted workforce for 2020 and 2024 compared to
today’s workforce presented by skill level (left), and proportionally by work type
(right). 11Future Demand
12Construction unlike Transport & Storage has failed to
return to trend productivity suggesting over capacity
Construction Transport & Storage
Construction GVA (£Bn) Actual vs Extrapolation Transport & Storage
GVA (£Bn) Actual vs Extrapolation
160
80
140
70
120
60
100
50
80
40
60
30
40 20
20 10
0 0
Jan 00
Jan 01
Jan 02
Jan 03
Jan 04
Jan 05
Jan 06
Jan 07
Jan 08
Jan 09
Jan 10
Jan 11
Jan 12
Jan 13
Jan 00
Jan 01
Jan 02
Jan 03
Jan 04
Jan 05
Jan 06
Jan 07
Jan 08
Jan 09
Jan 10
Jan 11
Jan 12
Jan 13There is evidence of significant wage inflation in rail construction; a
significant contrast with construction as a whole. This would be unlikely
to occur if sufficient, trained resource was available.
Avg Employee Cost Notes:
90.00 • In the construction sector overall the cost per
80.00 worker only went up by 5% between 2008
70.00 and 2014.
60.00 • In rail construction the average employee
50.00 cost rose by 85% over this same timeframe.
40.00 • This could be due to a lack of skills planning
30.00 (so demand exceeding supply and driving up
20.00 wages) or due to outsourcing the lowest cost
10.00 2008 roles (thereby shifting up the average).
0.00 • If it were due to outsourcing lower cost roles
2014
we would expect the margin to increase, as
no organization would outsource low cost
roles so that they cost more.
• All things being equal, if the employee cost
had stayed flat, the productivity uplift (ie the
efficiency component) would only have been
15% in Rail.The study suggests that there are opportunities to avoid
significant (10-30%) over-run capital costs and deliver (10-40%)
efficiencies
£300 Billion of Infrastructure Spend
50%-60% Optimally Excess
Efficiencies Missed
Spent Costs
A: Avoid the cost of conflict and the cost of poor
capability and create an environment for efficiency 6
B: Avoid the costs of skills shortages 9
C: Stop restarting the learning curve on people,
processes, products, contracts and technology 4
D: Take the right risks and stop paying for excessive
design redundancy and unrealistic risk transfer 4
E: Use “digital / don’t build” to get the outcome without
concrete 3
F: Use our scale for robust asset data, manufacturing,
R&D and asset standards 4
15C: Stop restarting the learning curve on people, processes,
products, contracts and technology
“We actually had “negative certainty” we all
20%-40%+ knew [department] would cancel the project
but they and the minister were refusing to
Value blink … so £100m was wasted.” It was “their
10-20% risk” [the supply chain’s] but that money still
needs to be recovered somewhere .”
5-10%
“It is like turning up on the station every day
Timeframe 0-18 18-36 36-48 48+
and demanding the cheapest single … when
People Team Dynamics Workforce leveling, Long term career Culture change you could have just bought a season ticket
Training development
and saved a boatload.”
Processes Explicit method Documented Continuous process ISO standards for
reuse processes improvement continuous delivery “I remember building 5 terminals in
Azerbaijan to exactly the same standard. It
Designs Design templates Repeat building Standard Assets DfMA
was hard work avoiding changes but the fifth
same asset Asset Standards came in 30% under budget.”
Contracts Heavy lifting to Reuse / extend Small changes Repeatable
document intent same framework standard call off
Technology Project tools and Automated design Whole life asset Digital replicas of
templates and reporting management assets
Resourcing Consultants, contractors & sub Employees, trainees and long term-
contracts supplier relationships and talent
development
16F: Use our scale for robust asset data, manufacturing,
R&D and asset standards
Picture 1 Picture 1 Picture 1 Picture 1
Typ. % Maturity Level
Lever
Impact 0 Level 1 – Initial 2 Level 3 - Developing 4 Level 5 - Mature
More than 50% of asset There is a national set of standard asset The QMS is well established and the supply
Standard value is procured from a components and more than 50% of asset value is chain is building compliant products that are
Assets & 10%-30% set of regional standard spent on these items. There is a Quality designed, assembled and commissioned
DfMA assets (above the base Management System and Product Management efficiently.
component level) System in place.
Periodic attempts to The value of asset data is defined and asset data Collection of asset data is embedded in the
systematically collect is systematically collected and asset data quality organisation’s processes. The data quality is
Asset Data 10%-20% asset data for projects. is defined. assured and the organisation is confident to
act on the basis of asset data. The expected
value is being delivered.
Asset Standards are Asset Standards are “delayered” to provide a “Principle based” asset standards are in
Asset systematically collated for single coherent reference with no inconsistency place where designers have the mandate to
5-10%
Standards asset types for major asset types innovate to provide same outcomes with
different approaches.
Regional or local National sharing of R&D results or national R&D shared nationally, with portfolio of
innovation focused on 1-3 portfolio or national integration with horizon 3 horizon 1 (1-3yr) and horizon 2 (3-5yr)
R&D 5-10%
year horizon with results (5yr+) innovation research targets. Tight integration with
shared locally sources of horizon 3 (5yr+) innovation.
17C: Policy vs Reality: The erosion of the investment time
horizon
A Policy certaintythe global situation (research from McKinsey Global Institute in May 2018)
• Automation will accelerate the shift in required workforce skills we have seen over the past 15 years.
• Research finds that the strongest growth in demand will be for technological skills.
• This surge will affect demand for basic digital skills as well as advanced technological skills such as programming.
• Demand for social and emotional skills such as leadership and managing others will rise by 24 percent
• Basic cognitive skills, which include basic data input and processing, will decline by 15 percent
• Demand for physical and manual skills, which include general equipment operation, will also drop, by 14 percent
• Companies will need to make significant organisational changes at the same time as addressing these skill shifts to stay
competitive
• Competition for high-skill workers will increase
• All stakeholders will need to work together to manage the large-scale retraining and other transition challenges ahead.
Firms can collaborate with educators to reshape school and college curricula. Industry associations can help build talent
pipelines, while labour unions can help with cross-sector mobility.
19the rail industry demand
• The rail industry, and particularly the Digital
Artificial
Railway, will need everything from basic Robotics
Intelligence
Rail Specific
digital skills to cyber security and resilience (AI)
Automation, ETCS, Traffic
predictability,
capabilities Intelligent
Off- site management,
manufacturing Signalling, etc
infrastructure
• These skills are largely sector agnostic and CDAS etc
etc
are increasing in their demand across the
economy
Cyber security and resilience
• In addition, there are some other specific
areas in AI (such as CDAS and Intelligent) Systems Engineering
infrastructure) where the applicability of
Data analytics and analysis
technology will be critical.
• Finally there will be the rail specific Software development and engineering
requirements – Traffic Management, ETCS,
Generic Digital skills common across all
etc that will require heavy sector and sectors and industries
operational knowledge
20what type of jobs and skills do and will we need?
• New jobs, in the areas of:
• Software development and engineering
• Data analytics and analysis
• Systems engineering
• Cyber security and resilience
• Diagnostics and monitoring
• However, almost every existing role in the railway will require new skills:
• Better IT skills
• Better analytical skills
• Better communication skills
• Skills on the application of digital information to customers
• Better and more agile management and leadership skills
21current digital apprenticeships
Apprenticeship Title (Approved)
Digital Apprenticeship Title (in development) Level
Level
Cyber Intrusion Analyst 4 Community Coordinator/Associate Community Manager 4
Cyber Security Technical Professional Degree 6
Cyber Security Technologist 4
Data Scientist Degree
6
Data Analyst
4 Digital Technology Solutions Specialist Degree 7
Digital and Technology Solutions Degree 6 Digital Applications Technician
Digital Marketer 3 3
Digital Marketer Degree
Infrastructure Technician 3
6
IS Business Analyst 4
Digital User Experience (UX) Professional Degree 6
IT Technical Salesperson 3 IT Solution Technician
Network Engineer 4 3
Network Cable Installer
Software Developer 4
3
Software Development Technician 3
Software Tester 22 4
Unified Communications Technician 3
Unified Communications Troubleshooter 4What’s the scale of the challenge?
• How many people will be affected?
• In excess of 200,000 workers (Includes operations (both train and infrastructure), asset maintenance, and relevant parts of
corporate services and renewals / enhancements)
• Assume all need either:
• Upskilling (modest training - 55% of the requirement ) or
• Reskilling (more training - 40% of the requirement ) or
• As a new entrants (apprenticeships - 5% of the requirement)
• So 110,000 need upskilling, 80,000 need re-skilling and 10,000 new Apprenticeships
• Which equates to approximately £600m of training and education cost to the industry, however
up to £200m could be recoverable through the Apprenticeship Levy
23The train driver academy and the digital rail academy
• Both virtual – no more bricks and mortar!!
• Both operate using a virtual hub and spoke model
• Both use existing training facilities (‘spokes’) for delivery
• Both are looking at virtual learning environment software as part of the ‘hub’
• Both use technology in a way that controls, standardises and delivers training materials
• Both enable online resource utilisation – centres, room, trainers, kit etc
• Both look at novel ways of training delivery – Virtual Reality, Augmented Reality etc
• Both link training to common competency management frameworks
24so what is NSAR doing?
• We are actively supporting RDG with their thinking and development of the Train Drivers Academy with
the TOCs and FOCs
• We are actively working with Network Rail on the development of their future workforce numbers and
skills requirements
• We are actively working with the Digital Railway team to understand what skills will be needed, where and
when to support the programme
• We have Skills Live – a programme with TfL designed to support NEETs to secure new digital based roles in
rail
• We are reviewing existing Apprenticeship Standards in Digital Skills to determine what is applicable in rail
• Our role is to support industry – please use us!!
25HMT – as predicted Budget Nov 2017 Procuring for Value In the months ahead the sector and the government will work to ensure construction projects across the public and private sectors are procured and built based on their whole life value, rather than just initial capital cost. The sector will aim to develop a procurement standard and work with the Infrastructure and Projects Authority to develop cost and performance benchmarks for assets and contractors and monitor outcomes including increased housing capacity, productivity and pre- manufactured value among other initiatives. Industry-led Innovation A joint commitment to invest in a transformative programme which brings together the construction, digital technology, manufacturing, materials and energy sectors to develop and commercialise digital and offsite manufacturing technologies. This will accelerate change in the infrastructure and construction sector, ensuring new technologies that can help deliver the government’s planned investments in infrastructure and its 2015 commitment to deliver a million homes by the end of 2020 and half a million more by the end of 2022 are commercialised as quickly as possible. Skills for the Future The construction sector, with support from the government, will work closely in the coming months to drive increased investment in skills development, whilst adopting a more strategic and coordinated approach to recruitment, and equipping workers with the skills that they will need for the future. This will be achieved through a joint commitment to implement reforms to the Construction Industry Training Board to make it more strategic and industry led, and to enable the sector to make best use of funding from the Apprenticeship Levy.
Policy 2017

1. TISS one year on - June           1. More apprenticeships and more
                                        quality
2. SoS letter to regulator - july    2. Productivity and efficiency

3. Sofa - October
                                     3. Efficiency and skills
4. Budget - November
                                     4. Productivity and apprenticeships
5. Industrial strategy - November
                                     5. Productivity and apprenticeships
6. SoS strategic vision – November
                                     6. Efficiency and skills

7. TIES – December
                                     7. Efficiency
8. TIP - December                    8. Productivity and a little skills
Future
Alignment of skills and other rsg
strands into scorecard • How do we backfill after
brexit?
Strategic workforce planning at • How do we get 20%
project level productivity gains in 5
years?
Procurement changes • Is 2.5% apprenticeships in
the workforce enough?
Sector deal • Is it 50/50 upskilling / new
right?
Productivity scorecard and pilots • How can tier 1s help their
supply chain?
Wider economic impact - treasury
• How can I use nsar
connect?
Social inclusion and brexitYou can also read