No Days Off! Celebrating The Everyday Communal Experience Of Sports - AWS
←
→
Page content transcription
If your browser does not render page correctly, please read the page content below
No Days Off! Celebrating The Everyday Communal Experience Of Sports
Lineup
Game Plan                                                     3

The Passion For Sports Never Rests                            4-11

“Wide World Of Sports” Omnichannel Ecosystem                  12-16

TV Is The Heart Of The Sports Ecosystem                       17-23

Sports TV’s Current Winning Streak                            24-31

Complementary Content Through Supplementary Screens           32-38

Collective Experiences Through Online & Offline Socializing   39-43

Sports Wrap Up                                                44-47

Contact Information                                           48

                                                                      2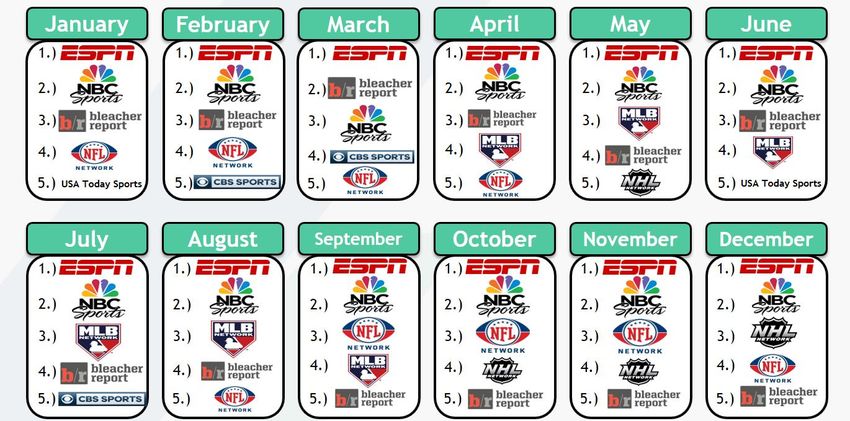
Game Plan

To some, sports is life. To many others, it’s a central passion point. And to almost all, it represents
compelling, engaging and consistent content fueled by the combination of real-life action and drama
(the intersection of which we colloquially refer to as “score-ylines”) unfolding before their eyes.

With almost 11,000 national live sporting events airing annually, TV viewers have the opportunity to
indulge in one of their favorite passions – sports - literally every single day of the year. Whether it’s
football, baseball, basketball or international cricket, there is always something live on TV with an
average of 8 major sports, along with countless niche ones, active in any month.

It’s the “No Days Off” programming calendar that places TV at the heart of the sports ecosystem.
Television feeds a virtually never-ending stream of content to mobile apps and alternative devices;
it creates limitless conversations on social media, blogs and sports-related websites; and it brings
friends, soon-to-be friends, family, fellow alumni and people who share common interests together
in a communal experience where passion elicits emotion on any given day.

People have an insatiable appetite for content of any kind that surrounds their passions and, for
sports, it all begins with TV and multi-screen TV brands.

NO DAYS OFF!

                                                                                                            3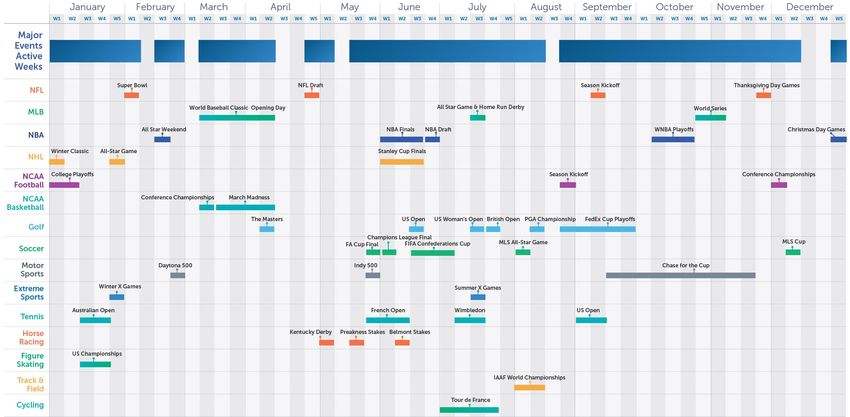
The Passion For Sports
Never Rests
                         4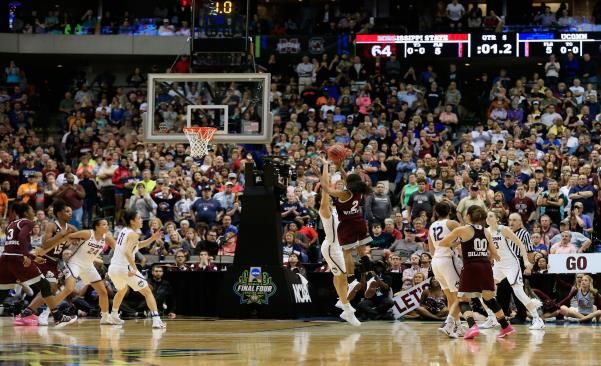
Sports Are Almost Universally Watched & Followed, To At Least
           Some Extent, By Most Of The Population
    Within this universe, almost one-quarter (24%) of respondents consider themselves an
                                     “intense” sports fan
                                       Persons 15-74                Males 15-74               Females 15-74

                                                                        92%
                                     86%
                                                                                                              80%

                                                         Are You A Sports Fan?

NO DAYS OFF!

Source: #SCORE 2016 Sports Fan Behavior Study 2016; Center for the Digital Future at Annenberg/ThePostGame.         5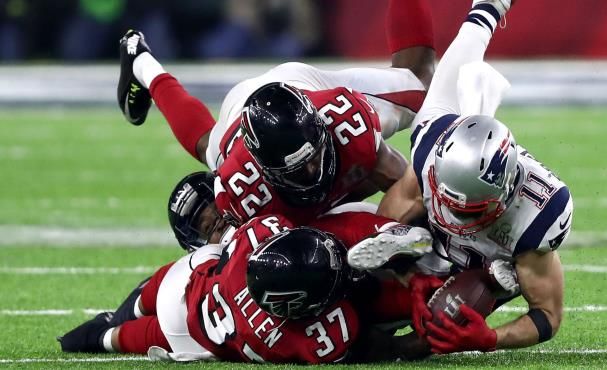
Although The NFL Remains King, Several Other Sports Draw A
                  Rather Significant Following
       Eight different sports are followed regularly by at least 20% of American sports fans

                                                    Which Sports Do You Follow?

(NFL Football)        (Baseball)         (College Football)      (NBA Basketball)      (College Basketball)      (Ice Hockey)      (Boxing)

   81%                  54%                    48%                    46%                     35%                   23%             22%

   (NASCAR)               (Tennis)                 (Golf)           (Extreme Sports)             (MMA)              (Gymnastics)   (MLS Soccer)

    20%                    17%                    17%                    16%                     16%                  13%            11%

  NO DAYS OFF!

  Source: #SCORE 2016 Sports Fan Behavior Study 2016; Center for the Digital Future at Annenberg/ThePostGame. Excludes Olympics.                  6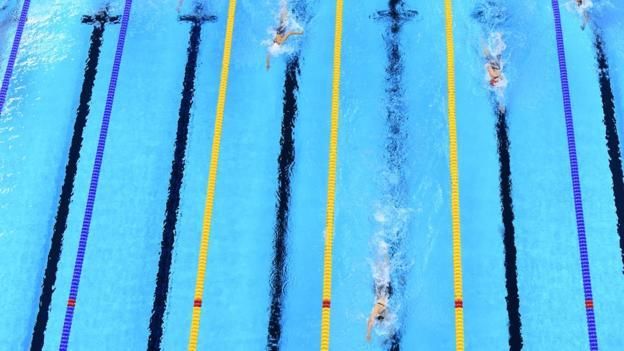
People Are Passionate About Sports And Fans’ Passion Is Driven
                     By Several Factors
      Traditional Powerhouses           Contemporary Winners

Wily Veterans & Dynamic Youngsters   Team, School & Athlete Rivalries

                                        vs.

NO DAYS OFF!

                                                                        7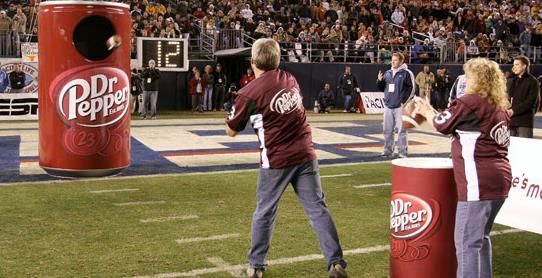
This Passion Around Sports Is Further Fueled By “Score-ylines”
    Which Engage Viewers Well Beyond Just The Numbers
“Score-ylines” sit at the intersection of outcomes and interests; they humanize an event’s
        results to engage even the most casual of sports fans (i.e., “the masses”)

                        Scores                                                        Storylines
   Chicago Cubs win Game 7 of the World Series 8-7 in extra      The victory ended 108 years of championship futility for one of
                          innings                                                  the most iconic pro teams

    Cleveland Cavaliers defeat Golden State in Game 7 of       Cleveland, led by returning hometown star Lebron James, came back
                    the NBA Finals 93-89                          from down 3-1 against the winningest regular season team ever

   Sergio Garcia wins the 2017 Masters in a one-hole playoff     Garcia’s win finally ends his 0-73 drought in majors tournaments

NO DAYS OFF!

                                                                                                                                    8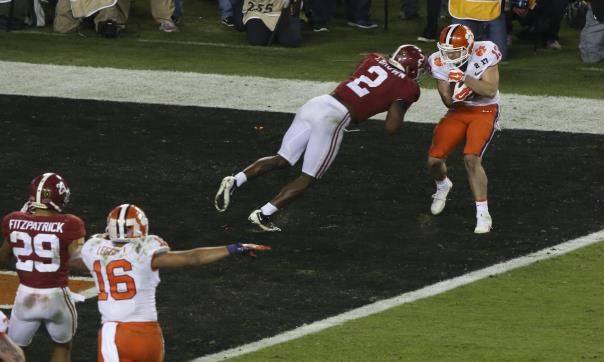
Beyond The Historic World Series Or Epic NBA Finals, The Past
  Year Has Featured A Never Ending Stream Of “Score-ylines”
Patriots overcomes the largest deficit in Super   Leicester City’s beats 5000-1 odds to win the      Mississippi State stuns UCONN in the Final
  Bowl history to defeat the Atlanta Falcons                 English Premier League                 Four, ending their 111 game winning streak

Former walk-on wide receiver scores winning        American swimmer Katie Ledecky obliterates         Kobe Bryant scores 60 points in his final
     TD in Clemson’s thrilling National              the competition at the Summer Olympics,         game on the same night that Golden State
    Championship victory over Alabama             winning the 800m freestyle by almost 12 seconds      wins their record-breaking 73rd game

  NO DAYS OFF!

                                                                                                                                                  9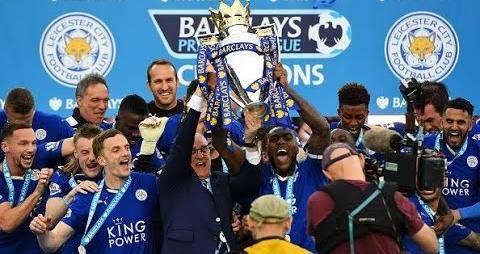
Looking At This Year’s Sports Calendar, Memorable
“Score-ylines” Can, And Will, Happen On Any Day Of The Year
Several major sports overlap each other throughout the year, culminating in November when
                               all the top sports are active.

                                                       Calendar For 10 Major Sports

Since 89% of sports fans follow more than one team and 88% follow more than one sport, there’s plenty of
                            action to keep a fan satisfied no matter the month.

 NO DAYS OFF!

 Source: #SCORE 2016 Sports Fan Behavior Study 2016; Center for the Digital Future at Annenberg/ThePostGame.   10
Especially When You Consider That Almost Every Week
Features A Premier, Signature Event From A Major Sport
Signature events in major sports are scheduled during at least 45 weeks of the 2017 broadcast calendar
NO DAYS OFF!
Note: Some post-season dates are still tentative 11“Wide World Of Sports”: Omnichannel Ecosystem
Fans Predominately Watch Sports Live At Home, Although
 About One-Quarter Will Catch Games At A Bar Or On The Go

                                        Where Do You Typically Watch Sports?
             93%

                                           25%
                                                                          22%                           21%
                                                                                                                      16%

      Live at Home                 At a Sports Bar            On a Mobile Device                In-Person at a   Pre-recorded at
                                                                                                   Stadium            Home

NO DAYS OFF!

Source: #SCORE 2016 Sports Fan Behavior Study 2016; Center for the Digital Future at Annenberg/ThePostGame.                        13
It’s No Surprise That Television Dominates Sports, But Half The
Population Also Gets Content From Alternate Devices
How Do You Access Sports?
88%
51% 49%
25% 24% 24%
12% 4%
8%
Television Computer Mobile Radio Newspaper Tablet Email Gaming Podcasts
Phone System
NO DAYS OFF!
Source: #SCORE 2016 Sports Fan Behavior Study 2016; Center for the Digital Future at Annenberg/ThePostGame. 14But Still, Television Is The Overwhelming Preference For People
To Consume Sports Video Content
How Do You Prefer To Receive Sports Video Content?
73%
15%
9% 3%
Television Mobile Phone Computer Tablet
NO DAYS OFF!
Source: #SCORE 2016 Sports Fan Behavior Study 2016; Center for the Digital Future at Annenberg/ThePostGame. 15“Wide World of Sports”: The Omnichannel Ecosystem
Sports Ecosystem
Center Ring: Live TV
Second Ring: second-screen
viewing, streaming players &
time-shifted devices
Third Ring: TV-branded digital
platforms & websites
Fourth Ring: social media
platforms & secondary sports
websites
Outer Ring: Out-Of-Home
Viewing
NO DAYS OFF!
16TV Is The Heart Of The Sports Ecosystem
TV Networks Spent Over $20 Billion On Sports Programming In
       2016; A $6 Billion Increase Over The Last Four Years
       Programmers are projected to spend almost another $6 billion more on sports in the next
              four years in order to deliver consumers even more live sporting events.

                                              Sports Programming Costs Trend
                                                                       (millions)
                                                                                                         $25,859.4

                                                                       $20,074.2

                            $13,972.6

                                 2012                                      2016                            2020

      NO DAYS OFF!

Source: SNL Kagan, 2017: programming cost estimates reflect ad-supported cable TV, broadcast TV & RSNs               18
Almost 11,000 Live Sporting Events Are Shown On National TV
Annually, With 86% Of Them Airing On Ad-Supported Cable
Live Sporting Events in 2016
Broadcast TV vs. Cable TV
1,468
14%
9,406
86%
Nat'l Broadcast TV Ad-Supported Nat'l Cable TV
NO DAYS OFF!
Source: Nielsen NPower, Total Day, live originals/premieres only, January 1, 2016 – December 31, 2016; excludes Regional Sports
Networks and local broadcast airings. 19No Days Off: There Were At Least Two Live Sporting Events
Airing Every Single Day of The Year On National TV In 2016
A live sporting event aired on ad-supported cable TV every day (366 days) in 2016 while
national broadcast TV aired live sports on 221 days.
# of Live National TV Sporting Events Aired Daily
2-9 live events
50-76 live events aired on 16 days of the year
aired on 52 days of the year (4%)
(14%)
10-19 live events
aired on 110 days of the
year (30%)
20-49 live events
aired on 188 days of the year
(51%)
How to read: In 2016, 16 days featured between
2-9 live sporting events airing on national TV.
NO DAYS OFF!
Source: Nielsen NPower, Total Day, live originals/premieres only, January 1, 2016 – December 31, 2016; includes Spanish language
networks; excludes Regional Sports Networks and local broadcast airings. 20In Fact, On Average There Are At Least Ten Live Sporting Events
Airing On National TV Each Day Throughout The Year
Average # of Live Sporting Events Each Day
2016
Nat'l Broadcast TV Ad-Supported Nat'l Cable TV
60
42
47
30
21 23 33
19
14 27
20 22
18
13 13 9
1 1 1 1 3
Monday Tuesday Wednesday Thursday Friday Saturday Sunday
NO DAYS OFF!
Source: Nielsen NPower, Total Day, live originals/premieres only, January 1, 2016 – December 31, 2016; excludes Regional Sports
Networks and local broadcast airings. 21Each Day Is Anchored By Several Signature Sports Series Airing
On National TV Throughout The Year
Sampling of Signature Sports Series
Monday Tuesday Wednesday Thursday Friday Saturday Sunday
NO DAYS OFF!
22Complementing National Sports Are RSNs Which Air In-Market
Sports & Provide Comprehensive Coverage Of Local Teams
RSNs, which consist of live professional & collegiate sports broadcast and ancillary programming, cover all
major DMAs and also key, sports-fanatical “college town” markets
NO DAYS OFF!
23Sports TV’s Current Winning Streak
Sports Are Ubiquitous Among The TV Viewer Given The Daily
      Availability Of Live Events & Related Programming

                                       Annual Cume National Sports TV Reach (Live)
                                                                          CY 2016

                                     95.8%          96.3%                                  92.0%          93.1%

                                               P2+                                                 P18-34
                                                 Sporting Events                 All Sports-Related

NO DAYS OFF!
Source: Nielsen NPower R&F Program Report, Total Day, Live, P2+ & P18-34, ad-supported cable TV + broadcast TV, January 1st –
December 31st 2016; excludes Regional Sports Networks and local broadcast airings. Sports-related programming includes live sports,
sports news, sports commentary, etc.                                                                                                  25
National Sports TV Monthly Reach Is Fairly Consistent But Has
A Slight Increase During The Football Season
On average, almost 80% of P2+ watch sports-related TV programming live each month
Monthly Cume National Sports-Related Programming Live TV Reach
CY 2016
P2+ P18-34
81% 82% 81% 82% 80%
79% 78% 78%
75% 75% 75%
71% 72% 70% 70% 70%
67% 67% 66% 67%
64% 63% 64%
58%
January February March April May June July August September October November December
Note: Summer is dominated by the MLB, a sport that has the vast majority of its games airing on RSNs which are not reflected in the above chart.
NO DAYS OFF!
Source: Nielsen NPower R&F Program Report, Total Day, Live, P2+ & P18-34, ad-supported cable TV + broadcast TV, based on calendar
months; includes Olympics and excludes Regional Sports Networks and local broadcast airings. Sports-related programming includes live
sports, sports news, sports commentary, etc. 26Sports Also Delivers Significant Simultaneous Reach For Many
Events Throughout The Year
In the last year, there were 20 live sporting events that delivered an average audience of over
10 million TV viewers, spanning across seven different sports
NO DAYS OFF!
Source: Nielsen Year In Sports Media Report 2016, based on 2/21/16 – 2/5/17 time period. For the Masters, the figure is based on the final day of the
tournament (Sunday). 27Average Time Spent Watching TV Sports Has Increased For
The Total Population & Millennials Over The Last Eight Years
Sports-Related National TV Programming: Average Annual Minutes Viewed Comparison
CY 2008 vs. CY 2016
8,450 +14%
+2%
7,387 7,264 7,382
P2+ P18-34
2008 2016
NO DAYS OFF!
Source: Nielsen NPower R&F Program Report, Total Day, Live+7, P2+ & P18-34, ad-supported cable TV + broadcast TV, based on calendar
year; excludes Regional Sports Networks and local broadcast airings. Sports-related programming includes live sports, sports news, sports
commentary, etc. Comparison based on years with Summer Olympics. 28Over 33 Billions Hours Of Sports-Related Programming Were
Collectively Viewed On Ad-Supported National TV In 2016
Total TV sports viewing has increased across each major stream over the last eight years
Sports-Related National TV Programming: Total Cume P2+ Hours Viewed Comparison
2008 vs. 2016
+7% +8%
33.1 33.5
+3%
30.4 31.2 31.0 31.2
Billion Billion Billion
Hours Hours Hours
Live Live+Same Day Live+7
2008 2016
NO DAYS OFF!
Source: Nielsen NPower R&F Program Report, Total Day, P2, ad-supported cable TV + broadcast TV, based on calendar year; excludes
Regional Sports Networks and local broadcast airings. Sports-related programming includes live sports, sports news, sports commentary, etc.
29Even With The Increase In DVR Penetration, Sports Remains
Almost Exclusively A “Live” Or “Near Live” Viewing Experience
Sports-Related National TV Programming: Viewership By Stream
% of Total Viewing Hours
Live Live+Same Day Live+7
2016 93% 6% 1%
P2+
2008 97% 2%
1%
2016 93% 6% 1%
P18-34
2008 96% 3%1%
NO DAYS OFF!
Source: Nielsen NPower R&F Program Report, Total Day, P2+ & P18-34, ad-supported cable TV + broadcast TV, based on calendar year;
excludes Regional Sports Networks and local broadcast airings. Sports-related programming includes live sports, sports news, sports
commentary, etc. 30Along With The Increase In “Time Spent Viewing” Has Come
Many Ratings Victories For Big Sporting Events
NO DAYS OFF!
31Complementary Content Through Secondary Screens
TV Brands Extend Their Reach & Engagement Through Live
Streaming Which Allows Additional Sports Viewing Everywhere
    Live event streaming from sports programmers & providers gives flexibility to cable
                 subscribers, allowing them to view content across devices.

                            Sampling of Live Streaming Mobile Apps

NO DAYS OFF!

                                                                                          33
TV-Branded Sports Platforms Reach A Majority Of The Digital
Population & Almost Everyone Within The Online Sports Universe
TV-Branded Sports Platform Cume Unique Visitors Coverage
Dec ‘16
P2+ P18-34
93% 90%
75%
65%
% of Total Digital Population % of Sports Category Digital Universe
NO DAYS OFF!
Source: comScore Audience Duplication; multiplatform (web+mobile), December 2016, unduplicated unique visitors based on a custom
created Sports TV Branded Website subcategory which includes digital platforms such as ESPN.com, Fox Sports, CBS Sports & NBC Sports.
comScore MediaMetrix, multiplatform media trend data, December 2016, total digital population & sports category. 34A Vast Majority Of Time Spent Online With Sports Content Is
Through TV-Branded Digital Platforms
Sports Category: % of Total Minutes Viewed Online
2016
P2+ P18-34
TV-Branded All The Rest
TV-Branded
All The Rest Websites
23% Websites 22%
77% 78%
Note: “All The Rest” reflects non-premium TV-related websites like USA Today Sports, SB Nation, Scout.com, Reddit Sports, Deadspin.com, Big Lead Sports, etc
NO DAYS OFF!
Source: comScore MediaMetrix, multiplatform media trend data, January-December 2016; comScore-defined sports category vs. custom
created Sports TV Branded Website subcategory which includes digital platforms such as ESPN.com, Fox Sports, CBS Sports & NBC Sports. 35Millennials’ Time Spent On Sports TV-Branded Digital Platforms
Have Increased By Double Digits Over The Last Two Years
Sports TV-Branded Digital Platforms: Average Monthly Minutes Spent Per Visitor
Dec '14 Dec '16
126.2 +16%
+5%
116.2
110.7
108.9
P2+ P18-34
NO DAYS OFF!
Source: ComScore Audience Duplication; multiplatform (web+mobile), unduplicated Avg Mins per Visitor based on a custom created Sports
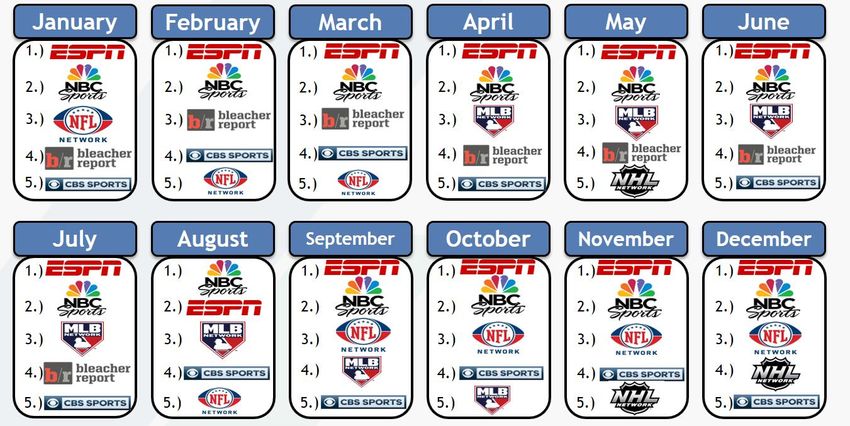
TV Branded Website subcategory which includes digital platforms such as ESPN.com, Fox Sports, CBS Sports & NBC Sports. 36TV-Related Brands Make Up The Top 5 Most Trafficked Digital
Platforms In The Sports Category Throughout The Year
Top 5 Sports Digital Platform Rank By Total Minutes Viewed (P2+)
NO DAYS OFF!
Source: comScore MediaMetrix, multiplatform media trend data, January-December 2016; sports category, P2+, excludes non-sports media
brands. 37TV-Related Brands Also Make Up Almost All Of The Top 5
Monthly Digital Sports Platforms Among Millennials
Top 5 Sports Digital Platform Rank By Total Minutes Viewed (P18-34)
NO DAYS OFF!
Source: comScore MediaMetrix, multiplatform media trend data, January-December 2016; sports category, P18-34, excludes non-sports
media brands. 38Collective Experiences
Through Online & Offline
Socializing
39There’s A Consistent Stream Of Heavy Social Conversation
Centered Around Televised Sporting Events
Social TV Interaction Highlights By Major Sporting Event
1/1 3/17-3/18 5/15–5/25 7/10 9/20 11/24 1/15
NHL Winter Classic March Madness – NHL Eastern UEFA Euros Final World Cup of NFL Thanksgiving NFC Divisional
(NBC) Round of 64 Conference Finals (ESPN, ESPND) Classic Playoff Game
Hockey: USA vs.
55K interactions* (CBS, TBS, TNT, (NBCSN) 681K interactions* Canada (FOX) (FOX)
TruTV) 710K interactions* (ESPN) 11.4MM 52.9MM
2.0MM interactions* 146K interactions interactions interactions
4/4 5/30–6/12
2/14 March Madness – Stanley Cup 8/27 10/25-11/2 12/31 2/5
NBA All-Star Champ. Game Finals UFC Fight Night World Series Fiesta Bowl Super Bowl LI
Game (TNT, TBS) (TBS, TNT, TruTV) (NBC, NBCSN) (FOX) (FOX) (ESPN, ESPN2) (FOX)
1.4MM 1.8MM 1.34MM 227K 31.6MM 5.7MM 190.8MM
interactions* interactions* interactions* interactions interactions* interactions interactions
Jan Feb Mar Apr May Jun Jul Aug Sep Oct Nov Dec Jan Feb
‘16 ‘16 ‘16 ‘16 ‘16 ‘16 ‘16 ‘16 ‘16 ‘16 ‘16 ‘16 ‘17 ‘17
2/21 4/10 6/2-6/19 8/21 10/2 12/25 1/22
Daytona 500 The Masters NBA Finals Boxing Ryder Cup NBA Christmas AFC Champ.
(FOX) (CBS) (ABC) (NBC) (NBC) Day (ABC) Game (CBS)
439K 385K 18.9MM 34K 1.1MM 4.9MM 26.4MM
interactions* interactions* interactions* interactions interactions interactions interactions
5/16–5/30 9/8 11/20 1/9
1/31 4/3 NBA Western 7/12 NFL Thursday Night NASCAR: Homestead- CFP National
NHL All-Star Game MLB Opening Day Conference Finals MLB All-Star Game Kickoff Miami Speedway Championship Game
(NBCSN) (ESPN, ESPN2) (TNT) (FOX) (NBC) (NBC, NBCSN) (ESPN)
326K interactions* 266K interactions* 7.2MM interactions* 370K interactions* 6.8MM interactions 1.4MM interactions 18.7MM interactions
NO DAYS OFF!
Source: Nielsen Year In Sports Media Report 2016. For series, social interactions were added up across all games. *Reflects Twitter social interactions
only, excludes Facebook. 40Nationally Televised Sports Almost Automatically Spur Some Of The
Top Online Social Conversations During Their Airings
Almost 9 out of 10 nationally televised NFL, MLB, NBA and evening college football games across the major TV networks
trend in the top 10 primetime Twitter topics on their respective nights during the monitoring period
NFL: 100% (12 out of 12 games) MLB: 91% (21 out of 23 games)
Four-Week Time Period
(Primetime: Oct-Nov ‘16)
Top 10 Trending Topics
88%
(53 out of 61 games)
NBA: 71% (10 out of 14 games) NCAA Football: 83% (10 out of 12 games)
Excerpted from the VAB’s #TVisSocial report: http://www.thevab.com/wp-content/uploads/2017/01/TVisSocial-Report.pdf
Source: VAB custom analysis of Top 10 trending Twitter Topics each night (8:15p, 9:15p, 10:15p, 11:15p) during 4-week time period (10/10-2016 – 11/6/2016). Results include both
“direct” and “related” TV topics. NFL: Sunday Night Football on NBC – 10/16, 10/23, 10/30, 11/6; ESPN Monday Night Football – 10/10, 10/17, 10/24, 10/31; Thursday Night Football –
10/13, 10/20, 10/27, 11/3. NCAA Football: ESPN Friday Night Football – 10/14, 10/21, 10/28, 11/4; ABC Saturday Night Football – 10/15, 10/22, 10/29, 11/5; ESPN 10/15, 10/22,
10/29, 11/5. NBA: ESPN – 10/26, 10/28, 11/2, 11/4; TNT – 10/25, 10/27, 11/3. MLB: MLBN – 10/10; TBS – 10/10, 10/14, 10/15, 10/17, 10/18, 10/19; FS1 – 10/10, 10/11, 10/13,
10/15, 10/16, 10/18, 10/19, 10/20, 10/22; FOX – 10/25, 10/26, 10/28, 10/29, 10/30, 11/1, 11/2
41At Least One Ad-Supported TV Sporting Event Tends To Trend In The
Twitter Top 10 At Some Point During Each Night
# of Sporting Events Trending In The Top 10 During Each Night
Four-Week Time Period (Primetime: Oct-Nov ‘16)
6
5 5 5 5
4 4 4 4 4
3 3 3 3 3 3 3
2 2 2 2 2 2 2 2 2 2
1
10/10 10/11 10/12 10/13 10/14 10/15 10/16 10/17 10/18 10/19 10/20 10/21 10/22 10/23 10/24 10/25 10/26 10/27 10/28 10/29 10/30 10/31 11/1 11/2 11/3 11/4 11/5 11/6
NO DAYS OFF! Excerpted from the VAB’s #TVisSocial report: http://www.thevab.com/wp-content/uploads/2017/01/TVisSocial-Report.pdf
Source: VAB custom analysis of Top 10 trending Twitter Topics each night (8:15p, 9:15p, 10:15p, 11:15p) aggregated during 4-week time period (10/10-2016 –
11/6/2016). Results include both “direct” and “related” TV topics. 42In The “Physical” Social Realm, Sports Is A Big Driver Of Out-Of-
Home TV Viewing Which Can Add Substantial Reach
Whether it’s to:
• Just get out of the house and go to a local establishment for the game
• 51% go to a bar or restaurant on a regular basis
• Meet up with friends for the “social camaraderie” aspect
• More people participate in March Madness brackets for social camaraderie (42%) than to win money (39%)
• Socialize with your sports fanatic friends or alumni away from your home
• 10% of people (6% of males / 15% of females) who don’t identify as a sports fan are a “friend of a sports fan”
• Have the opportunity to watch live action “out-of-market” games
• A large number of traditional powerhouses and contemporary winners’ fanbases are located out of their
home market; for instance 61% of the Golden State Warriors fans’ are outside the West Region; 54% of the
Cleveland Cavaliers’ fans are outside the Midwest
• 60% of Daily Fantasy Sports participants watch games involving teams they don’t usually follow because they
are following their fantasy players
Out-Of-Home Viewing can significantly extend the reach of televised live sporting events:
• ABC received a 17% lift in average P6+ viewership across the seven games of the 2016 NBA Finals between
Golden State & Cleveland; the lift jumped to 25% among P18-34
• Among March Madness bracket participants, 12% said their top way of following the games was viewing on
TV in a public location
NO DAYS OFF!
Source: MRI GfK 2016 Doublebase; Nielsen Year In Sports Media Report 2016; #SCORE 2016 Sports Fan Behavior Study 2016; Center for
the Digital Future at Annenberg/ThePostGame; DraftKings company eeports. 43Sports Wrap-Up
As The Catalyst For Sports, It’s No Surprise That National
  Advertisers Are Spending Almost $20 Billion Annually On TV
  Excluding Olympics, advertisers have spent 33% more on sports-related TV programming
                             annually over the last four years.

                             Sports-Related National TV Advertising Spend
                                                                    (millions)

                                                                                                               $19,386.3
                                                                   $18,123.4

                        $14,605.1

                            2012                                        2014                                        2016

NO DAYS OFF!
Source: Nielsen Ad Intel, reflects national cable TV, Spanish language cable TV, broadcast TV, Spanish language broadcast TV. Excludes
Olympics.                                                                                                                                45
Sports TV’s Ubiquitous Reach Makes The Genre Truly Desirable
For Advertisers In Any Category
With major categories including automotive, telco, QSRs, financial / insurance and home;
advertisers turn to sports to reach any desired lifestage from youth to mature adults.
Top 5 Advertisers By Major Sport
NCAA NCAA
NFL NBA MLB NHL MLS Golf UFC Basketball Football
NO DAYS OFF!
Source: Nielsen Year In 2016 Sports Media Report. NFL reflects Q4’15 – Q3’16; all other sports reflect advertiser spend in their last full
season. 46The Highly Engaged Sports Ecosystem Allows Brands To
Implement Successful & Innovative TV-Heavy 360 Integrations
Dr. Pepper & College Football Playoffs Taco Bell & NBA / Taco Bell & MLB
Bud Light & NFL Buffalo Wild Wings & March Madness
AT&T & March Madness
Audi & MLS Playoffs
NO DAYS OFF!
47For More Information Visit Us Online
TheVAB.com
Follow us:
@VideoAdBureau
Like us:
facebook.com/VideoAdvertisingBureau
48You can also read