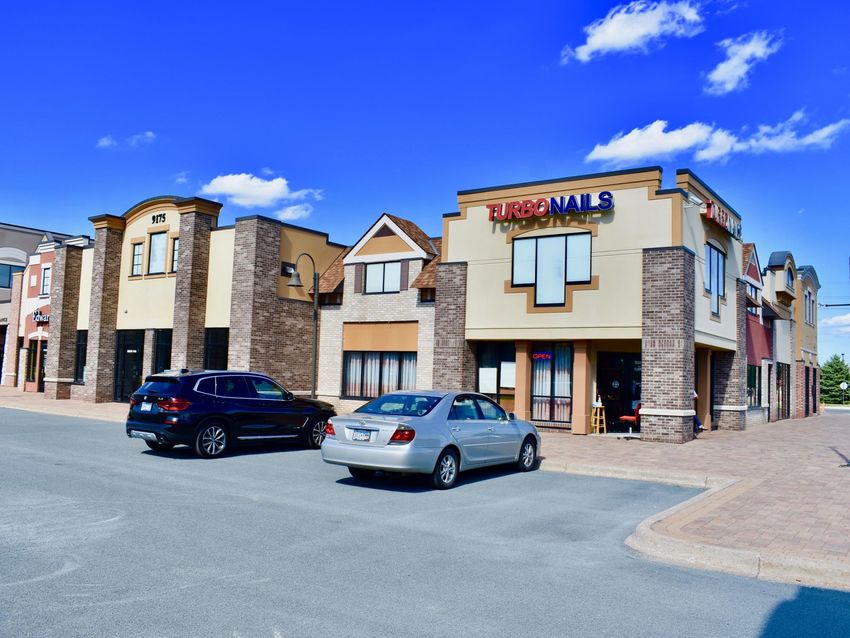
Otsego Marketplace
9175 Quaday Ave NE, Otsego, MN 55330
←
→
Page content transcription
If your browser does not render page correctly, please read the page content below
Otsego Marketplace 9175 Quaday Ave NE, Otsego, MN 55330
NON-ENDORSEMENT AND DISCLAIMER NOTICE
                                                      CONFIDENTIALITY AND DISCLAIMER
The information contained in the following Marketing Brochure is proprietary and strictly confidential. It is intended to be reviewed only by the party receiving it from
Marcus & Millichap and should not be made available to any other person or entity without the written consent of Marcus & Millichap. This Marketing Brochure has
been prepared to provide summary, unverified information to prospective purchasers, and to establish only a preliminary level of interest in the subject property. The
information contained herein is not a substitute for a thorough due diligence investigation. Marcus & Millichap has not made any investigation, and makes no warranty
or representation, with respect to the income or expenses for the subject property, the future projected financial performance of the property, the size and square
footage of the property and improvements, the presence or absence of contaminating substances, PCB’s or asbestos, the compliance with State and Federal regulations,
the physical condition of the improvements thereon, or the financial condition or business prospects of any tenant, or any tenant’s plans or intentions to continue its
occupancy of the subject property. The information contained in this Marketing Brochure has been obtained from sources we believe to be reliable; however, Marcus &
Millichap has not verified, and will not verify, any of the information contained herein, nor has Marcus & Millichap conducted any investigation regarding these matters
and makes no warranty or representation whatsoever regarding the accuracy or completeness of the information provided. All potential buyers must take appropriate
measures to verify all of the information set forth herein.

                     Marcus & Millichap is a service mark of Marcus & Millichap Real Estate Investment Services, Inc. © 2018 Marcus & Millichap.
                                                                               All rights reserved.

                                                            NON-ENDORSEMENT NOTICE
Marcus & Millichap is not affiliated with, sponsored by, or endorsed by any commercial tenant or lessee identified in this marketing package. The presence of any corporation’s
logo or name is not intended to indicate or imply affiliation with, or sponsorship or endorsement by, said corporation of Marcus & Millichap, its affiliates or subsidiaries, or any
agent, product, service, or commercial listing of Marcus & Millichap, and is solely included for the purpose of providing tenant lessee information about this listing to
prospective customers.
                              ALL PROPERTY SHOWINGS ARE BY APPOINTMENT ONLY. PLEASE CONSULT YOUR
                                              MARCUS & MILLICHAP AGENT FOR DETAILS.

                                                                SPECIAL COVID-19 NOTICE
All potential buyers are strongly advised to take advantage of their opportunities and obligations to conduct thorough due diligence and seek expert opinions as they may deem
necessary, especially given the unpredictable changes resulting from the continuing COVID-19 pandemic. Marcus & Millichap has not been retained to perform, and cannot
conduct, due diligence on behalf of any prospective purchaser. Marcus & Millichap’s principal expertise is in marketing investment properties and acting as intermediaries
between buyers and sellers. Marcus & Millichap and its investment professionals cannot and will not act as lawyers, accountants, contractors, or engineers. All potential buyers
are admonished and advised to engage other professionals on legal issues, tax, regulatory, financial, and accounting matters, and for questions involving the property’s physical
condition or financial outlook. Projections and pro forma financial statements are not guarantees and, given the potential volatility created by COVID-19, all potential buyers
should be comfortable with and rely solely on their own projections, analyses, and decision-making.)

                                                                 OFFICES THROUGH THE U.S. AND CANADA
                                                                      WWW.MARCUSMILLICHAP.COM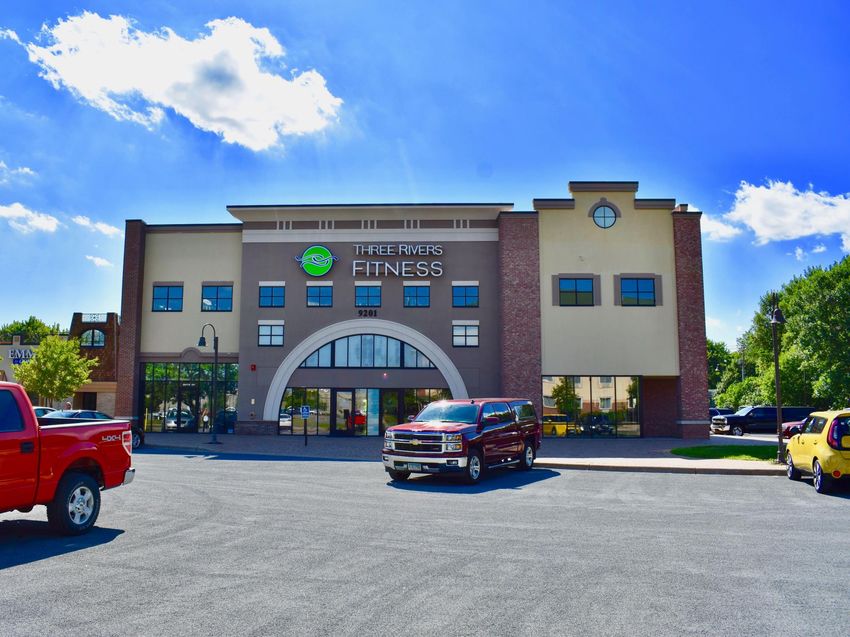
04
FINANCIAL OVERVIEW
Investment Summary
Investment Highlights
Offering Summary
Offering Statement
TABLE OF Rent Roll
10
CONTENTS PROPERTY OVERVIEW
Tenant Profiles
Aerial Photos
Local Map
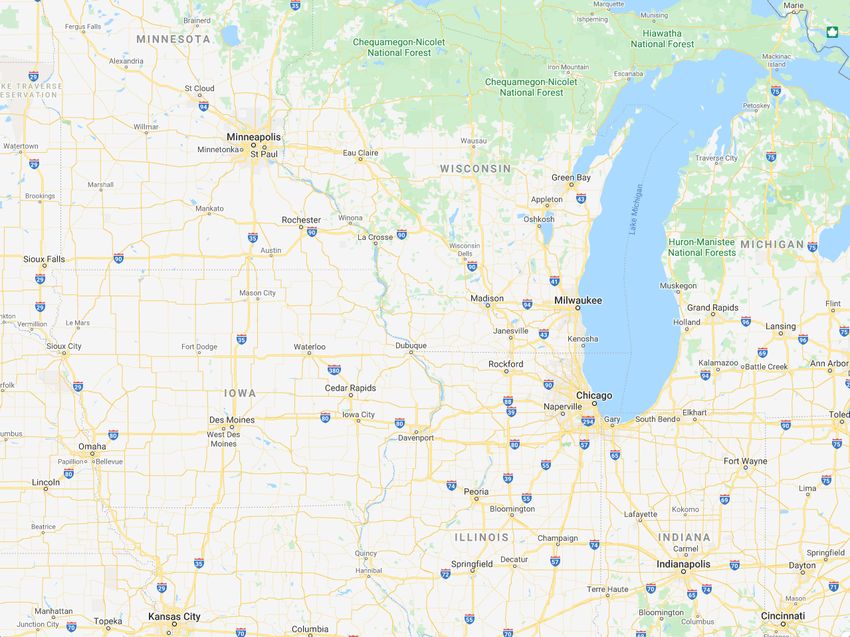
Regional Map
19
MARKET OVERVIEW
Demographic Summary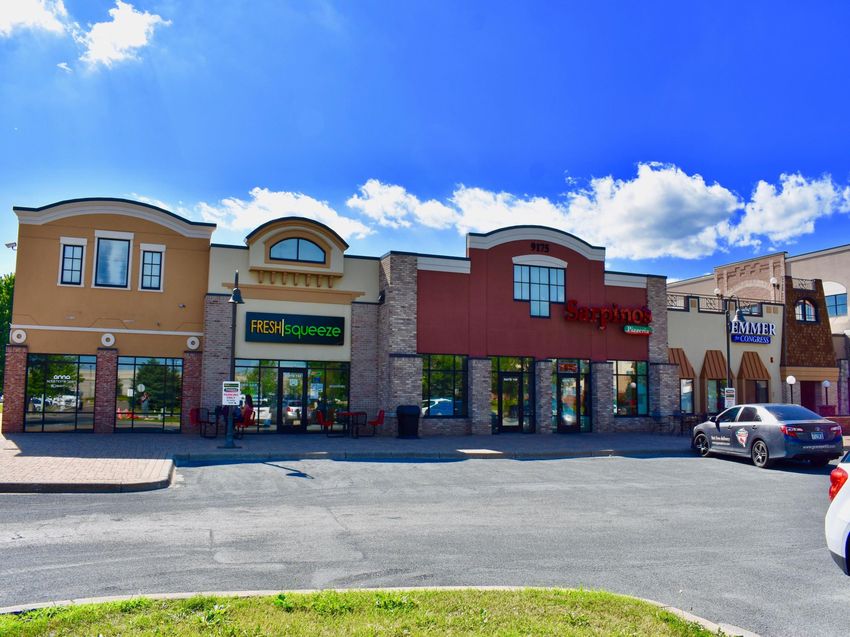
INVESTMENT SUMMARY
INVESTMENT OVERVIEW
Marcus and Millichap is pleased to present for your acquisition
review Otsego Marketplace in Otsego, Minnesota.
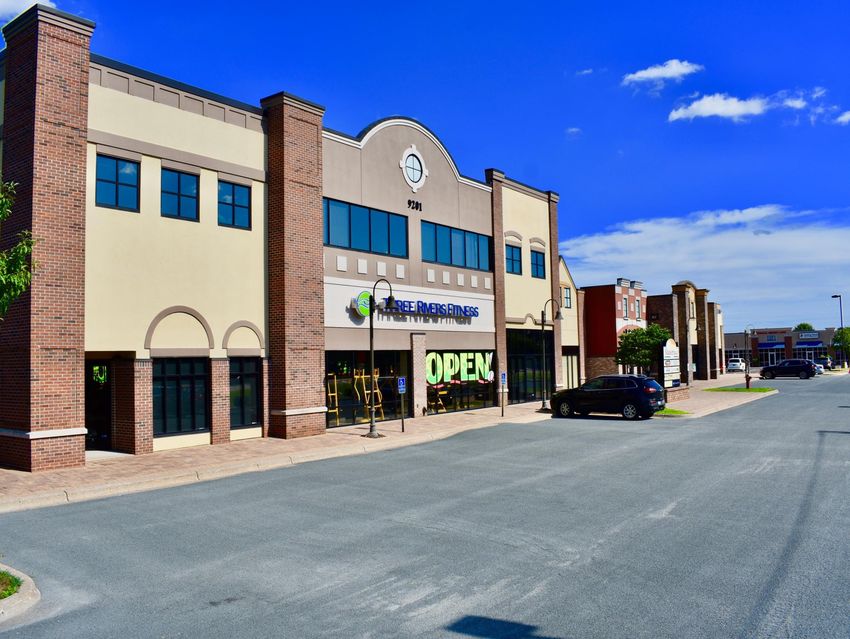
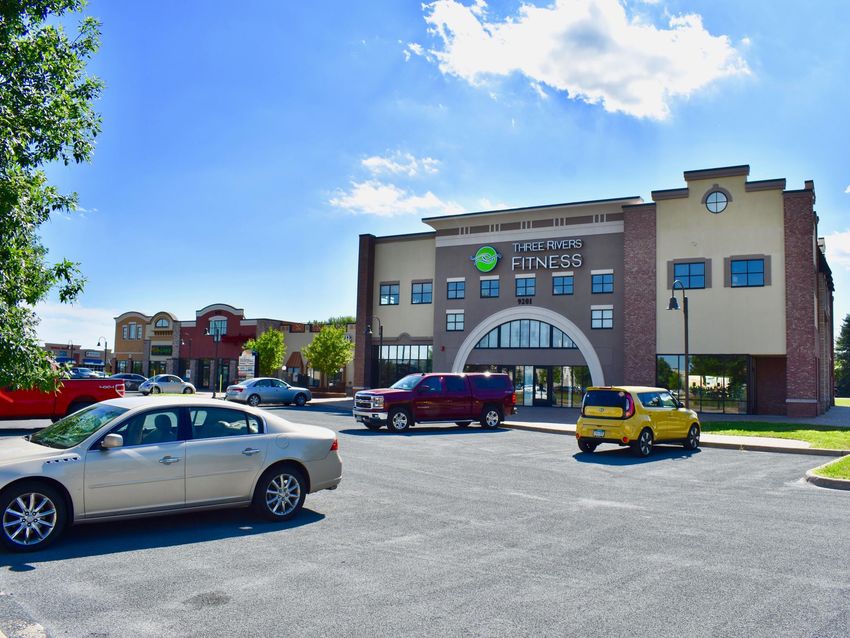
Otsego Marketplace has excellent exposure and frontage just off of Highway 101
at the intersection of Parish Avenue and 90th Street. The property is positioned
directly in the middle of the growth that Otsego is currently experiencing and sits
adjacent to Target, Holiday Inn, Rockwood, and Cowboy Jacks. The center sits
in the middle of the fastest growing thoroughfare in Minnesota that connects Elk
River to Rogers.
The strip center is over 91 percent occupied, providing an investor with stability
in the leases that are in-place, but also the opportunity for upside in leasing the
remaining 878 square feet of vacant space. In addition to the stability in the
occupancy and the long-term nature of most leases, the property also offers
minimal deferred maintenance. LED Lighting was installed in 2016, the roof
and HVACs units were all replaced in 2018, the parking lot was chip-sealed in
2020, and the cement sidewalks and pavers were also replaced.
Otsego Marketplace is anchored by several national tenants including Edward
Jones, American Family Insurance, and Sarpino’s Pizza. There are several leases
that are currently well below market rent, offering additional upside for an
investor to capture in a market with high population growth (25% since 2010).
This growth has translated into retail demand as demonstrated by the new
Coburn’s (regional grocer).
5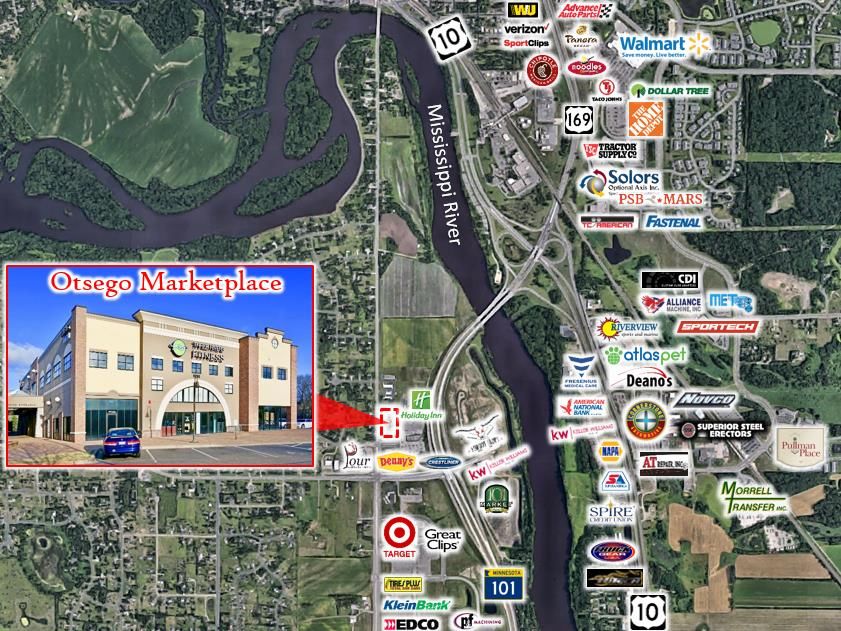
o 31,186 Square Foot Multi-Tenant Retail Building
  Situated on 2.40 Acres

o 91% Occupied | Stabilized Investment with Upside
  in Leasing the Vacant Suite & in Converting the
  Gross Leases to Triple Net

o Adjacent to Target, Holiday Inn, Rockwood &
  Cowboy Jacks

o Long-Term Leases in Place | Minimal Near-Term
  Lease Rollover Risk

o Minimal Deferred Maintenance | New Roof,
  HVACs in 2018 | Chip-Seal Parking Lot and
  Cement Sidewalk Replacement in 2020 | LED
  Lighting 2016

o Otsego is just 32 Miles Outside of Minneapolis

o Otsego is Ranked #7 Safest City in Minnesota

o 25% Population Growth since 2010 | 2nd Fastest
  Growing Suburb of Minneapolis
OFFERING SUMMARY                                                                                                                                                                                   EXECUTIVE SUMMARY
    OTSEGO MARKETPLACE
    Click to View Map: 9175 Quaday Ave NE, Otsego, MN 55330
 Pricing
   Price                                                                          $3,425,000

   Cap Rate                                                                            8.31%

   Building Square Footage                                                             31,186                  Avg. HH Income                                 Population                           Rentable Square Footage
   Price Per SF                                                                       $109.82
                                                                                                           $101,646 within 1 Miles                      46,373 within 5 Miles                                      31,186

   Current Occupancy                                                                   91.5%

   Year 1 NOI                                                                       $284,461

   Lot Size                                                                       2.40 Acres

   Year Built                                                                            2003
                                                                                                         Net Operating Income                                    Cap Rate                                      Year Built
                                                                                                                     $284,461                                       8.31%                                           2003
 Annualized Operating Data (Year 1)
    OPERATIONS (YEAR 1)

    Scheduled Gross Income                                                         $449,045

    CTI Reimbursements                                                                $36,314

    Vacancy Factor (5%)                                                               $24,268

    Operating Expenses                                                             $176,630                      Financing Options
    Net Operating Income                                                           $284,461                        Approximate Rate                                                                                        4.00%

    Capital Reserves                                                                   $4,678                      Loan To Value                                                                                              75%

    Loan Payments                                                                  $162,706                        Fixed Term                                                                                             5 Years

    Cash Flow After Debt Service                                                   $117,077                        Amortization                                                                                          25 Years
                                                                                                                   Multiple financing options are available based on buyer requirements. Please contact listing agents
    Cash On Cash Return                                                               13.67%
                                                                                                                   to discuss options in detail.
 Major Tenants
    MAJOR TENANTS                                GLA                     LEASE TYPE

    Three Rivers Fitness                         9,785                        Gross

    Edward Jones                                 1,118                        Gross

    American Family Insurance                     685                         Gross                                                                                                                                                            7
This information has been secured from sources we believe to be reliable, but we make no representations or warranties, expressed or implied, as to the accuracy of the information. References to square footage or age are approximate. Buyer
must verify the information and bears all risk for any inaccuracies. Any projections, opinions, assumptions or estimates used herein are for example purposes only and do not represent the current or future performance of the property. Marcus &
Millichap Real Estate Investment Services is a service mark of Marcus & Millichap Real Estate Services, Inc. © 2015 Marcus & Millichap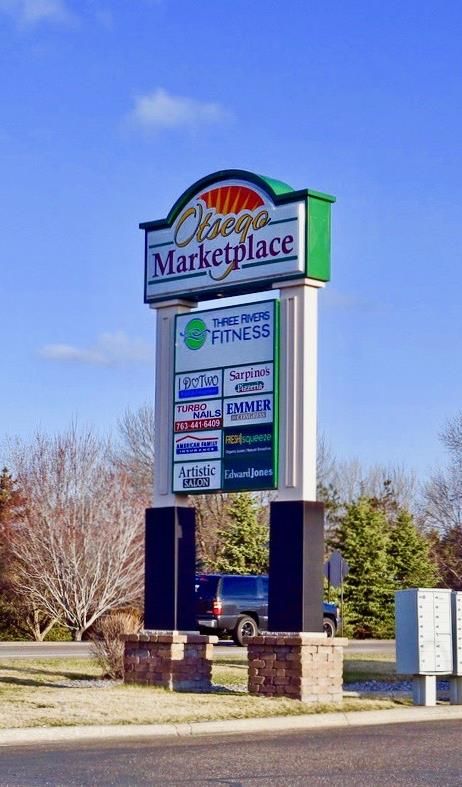
OPERATING SUMMARY                                                                                                                                                                                  FINANCIAL ANALYSIS
 Annualized Operating Data (Year 1)

                                                     SUMMARY STATEMENT                                                                                    PROPOSED FINANCING
                              Price:                                            $3,425,000                                             First Loan Amount:                                                 $2,568,750
                                                                                                                                       Terms:                                           4.00% Interest
                              Current Cap Rate:                                       8.31%
                                                                                                                                                                                   25 Year Amortization
                                                                                                                                                                                         5 Year Term
                              Square Feet:                                            31,186
                                                                                                                                       Monthly Payment:                                                   $13,558.81
                              Price Per Square Foot:                                 $109.82                                           Annual Payment                                                    $162,705.71

                              Year Built:                                                2003

                                                         OPERATING DATA                                                                           OPERATING EXPENSES (Year 1)
                              Scheduled Gross Income:                              $449,045                                            Taxes (2020):                                   $1.86/psf               $58,012
                                                                                                                                       Insurance (Actual):                             $0.30/psf                $9,200
                              CAM/Tax/Insurance                                      $36,314
                                                                                                                                       CAM (17-19 Avg.):                               $2.23/psf               $69,695
                              Reimbursements:
                                                                                                                                       Management:                                         4.00%               $18,334
                              Total Income:                                        $485,359
                                                                                                                                       Non-Reimbursable Utilities:                     $0.69/psf               $21,389
                              Vacancy Factor:                                        $24,268                  5.00%                    Total Expenses                                       $5.66            $176,630

                              Effective Gross Income:                              $461,091

                              Less Expenses:                                       $176,630

                              Net Operating Income:                                $284,461                   8.31%
                                                                                                                                                                                                                                               8
This information has been secured from sources we believe to be reliable, but we make no representations or warranties, expressed or implied, as to the accuracy of the information. References to square footage or age are approximate. Buyer
must verify the information and bears all risk for any inaccuracies. Any projections, opinions, assumptions or estimates used herein are for example purposes only and do not represent the current or future performance of the property. Marcus &
Millichap Real Estate Investment Services is a service mark of Marcus & Millichap Real Estate Services, Inc. © 2015 Marcus & Millichap
RENT ROLL                                                                                                                                                          RENT ROLL

               TENANT          APPROX.                 RENT         LEASE        APPORX.                BASE            ANNUAL         LEASE            RENT                      RENEWAL
 SUITE                                   OCCUPANCY                                                                                                                      REIMB.
                NAME             SF                  COMMENCE     EXPIRATION     RENT/SF             RENT/MONTH          RENT           TYPE          INCREASES                   OPTIONS

101-9175      Turbo Nails       1,520      4.87%      6/1/2010    5/31/2020       $16.96               $2,148.00       $25,776.00      NNN                              $7,566
             Three Rivers
101-9201                        9,785     31.38%     10/1/2018    12/31/2023      $11.04               $9,000.00       $108,000.00     Gross      Option I-$12.26psf              (1) 5-Year
               Fitness
                                                                                                                                                  6/1/21-$11.67psf
  102          SC Realty        852        2.73%      6/1/2019    5/31/2022       $11.32                $804.00         $9,648.00      NNN        Option I-$12.02psf    $4,241    (2) 1-Year
                                                                                                                                                  Option II-$12.38psf

  104      The Fresh Squeeze    706        2.26%     10/1/2014    9/30/2024       $23.00               $1,353.17       $16,238.04      Gross     10/1/2021-$24.00psf

                                                                                                                                                  Options I&II – 2%
  105       National Guard      1,925      6.17%     10/1/2020    9/30/2025       $23.23               $3,726.00       $44,712.00      Gross                                      (2) 5-Year
                                                                                                                                                  Annual Increases

  106           Vacant          878        2.82%                                  $16.25               $2,021.77       $24,261.25      Gross

                                                                                                                                                 8/1/2021-$22.64psf
  108       Sarpino's Pizza     1,289      4.13%      8/1/2014    7/31/2024       $22.31               $2,361.06       $28,757.74      Gross     8/1/2022-$22.98psf
                                                                                                                                                 8/1/2023-$23.33psf

                                                                                                                                                 11/1/2021-$16.65psf
  109        Edward Jones       1,118      3.58%     11/1/2014    10/31/2024      $16.32               $1,520.48       $18,245.76      Gross     11/1/2022-$16.98psf
                                                                                                                                                 11/1/2023-$17.32psf

              Emmer for                                                                                                                          1/1/2021-$18.75psf
  112                           1,718      5.51%      7/1/2013    12/31/2024      $18.38               $2,631.47       $31,577.64      Gross
               Congress                                                                                                                          1/1/2023-$19.12psf
           American Family
  201                           685        2.20%     11/25/2009   12/31/2022      $16.80                $958.98        $11,507.76      Gross
             Insurance
  202        Artistic Salon     1,251      4.01%     11/1/2017    10/31/2022       $9.83               $1,025.25       $12,303.00      NNN       11/1/2021-$10.13psf    $6,227

                                                                                                                                                 1/1/2022-$14.07psf
203-204        ChiroFix         892        2.86%      1/1/2018    12/31/2023      $19.24               $1,430.00       $17,160.00      Gross
                                                                                                                                                 1/1/2023-$14.68psf

                                                                                                                                                 2/1/2021-$11.83psf
                                                                                                                                                 2/1/2022-$12.00psf
           Parasol Wellness
  205                           2,295      7.36%      2/1/2019    1/31/2036       $11.67               $2,232.59       $26,791.08      NNN       2/1/2023-$12.17psf     $11,424
            Collaborative
                                                                                 *Tenant also pays $671.99/mo for TI                             2/1/2024-$12.34psf
                                                                                                                                                 2/1/2025-$12.52psf
                Emmer
  206                           2,490      7.98%      1/3/2015     1/2/2021       $22.48               $4,663.70       $55,964.40      Gross
             Congressional
  207      GBR Interpreting     1,352      4.34%      8/1/2016    7/31/2021        $9.13               $1,028.65       $12,343.80    Fixed NNN                          $6,855

                                                                                                                                                  Option I-$16.48psf
            First American
  209                           669        2.15%     4/15/2020    4/30/2021       $16.00                $892.00        $10,704.00      Gross     Option II-$16.97psf              (3) 1-Year
            Title Insurance
                                                                                                                                                 Option III-$17.48psf
             Common Area
                                1,761      5.65%
               (Vacant)
TOTAL SQUARE FEET:             31,186      100%                                MONTHLY INCOME:                           $37,385

TOTAL OCCUPIED SQUARE
                               28,547     91.54%                               ANNUAL INCOME:                           $449,045
FEET:

TOTAL AVAILABLE SQUARE
                                2,639      8.46%                               AVERAGE RENT PSF:                         $14.40
FEET:
TENANT OVERVIEW                                                                                                                                                                                       TENANT OVERVIEW

Three Rivers Fitness has one goal in mind, to provide members with a                                                         First American Financial Corporation is a United States financial services
friendly, affordable, and fun place to workout. At Three Rivers Fitness,                                                     company which provides title insurance and settlement services to the
their staff knows you buy name and welcomes you with a friendly smile,                                                       real estate mortgage industries. Their core business lines include title
showering you with the community spirit that the gym embodies. Three                                                         insurance and closing/settlement services. First American is publicly
Rivers Fitness was started in 2012 and caters to all ages and fitness levels.                                                traded on the New York Stock Exchange under the ticker symbol “FAF”
Their fully-certified personal trainers will make sure that you reach your                                                   and are an S&P 400 Component. Founded in 1889, they now have
goals. From Spin to Zumba to Pump and Yoga-they have it all! In                                                              grown to having more than 18,705 employees and reporting annual
additional, they also have a fully equipped Pilates studio and a highly                                                      revenue in excess of $6.2 Billion.
experienced Pilates trainer.

              OWNERSHIP:                                         Private                                                                    OWNERSHIP:                                         Public
              TENANT:                                            Corporate                                                                  TENANT:                                            Corporate
              LOCATIONS:                                         1                                                                          EMPLOYEES:                                         18,705
              COMPANY REVENUE:                                   Unknown                                                                    COMPANY REVENUE:                                   Unknown
              YEAR FOUNDED:                                      2012                                                                       YEAR FOUNDED:                                      1889
              HEADQUARTERED:                                     Otsego, Minnesota                                                          HEADQUARTERED:                                     Santa Ana, California
              WEBSITE:                                           www.threeriversfitness.com                                                 WEBSITE:                                           www.firstam.com

                                                                                                                                                                                                                                              11
This information has been secured from sources we believe to be reliable, but we make no representations or warranties, expressed or implied, as to the accuracy of the information. References to square footage or age are approximate. Buyer
must verify the information and bears all risk for any inaccuracies. Any projections, opinions, assumptions or estimates used herein are for example purposes only and do not represent the current or future performance of the property. Marcus &
Millichap Real Estate Investment Services is a service mark of Marcus & Millichap Real Estate Services, Inc. © 2015 Marcus & Millichap
TENANT OVERVIEW TENANT OVERVIEW
When it comes to crafting mouth-wateringly delicious gormet pizza, Edward Jones is a financial services firm headquartered in Des Peres,
there is no doubt that Sarpino’s reigns supreme. We stand by our mission Missouri and serves investment clients in the U.S. and Canada, through
to serve excellent food and offer exceptional experience for our customers its branch network of more than 14,000 locations and currently have
every time they place an order. At Sarpino’s, there’s no need to sacrifice relationships with nearly 7 million clients and $1 trillion assets under
convenience for a truly gourmet meal. Their specialty pizzas come management worldwide. The firm focuses solely on individual investors
topped with only the highest-quality ingredients, including rich tomato and small-business owners. Edwards Jones is a subsidiary of The Jones
sauce, savory meats, tangy mozzarella cheese, and the freshest vegetables Financial Companies, L.L.L.P., owned only by its employees and retired
to compliment it all. Sarpino’s is headquartered in Lincolnshire, Illinois employees and therefore is not publically traded.
and now operates over 250 locations.
OWNERSHIP: Private OWNERSHIP: Private
TENANT: Corporate TENANT: Corporate
LOCATIONS: 250+ LOCATIONS: 14,000+
COMPANY REVENUE: Unknown COMPANY REVENUE: $8.594 Billion
YEAR FOUNDED: 2012 YEAR FOUNDED: 1922
HEADQUARTERED: Lincolnshire, Illinois HEADQUARTERED: Des Peres, Missouri
WEBSITE: www.gosarpinos.com WEBSITE: www.edwardjones.com
12
This information has been secured from sources we believe to be reliable, but we make no representations or warranties, expressed or implied, as to the accuracy of the information. References to square footage or age are approximate. Buyer
must verify the information and bears all risk for any inaccuracies. Any projections, opinions, assumptions or estimates used herein are for example purposes only and do not represent the current or future performance of the property. Marcus &
Millichap Real Estate Investment Services is a service mark of Marcus & Millichap Real Estate Services, Inc. © 2015 Marcus & MillichapTENANT OVERVIEW TENANT OVERVIEW
American Family Insurance is a private mutual company that focuses on GBR Interpreting & Translation Services provides spoken and sign
property, casualty, and auto insurance while also offering commercial language interpreting services to a diverse spectrum of clients, including
insurance, life, health, and homeowners coverage as well as investment MN State Courts, US Immigration Courts, Medical Providers, Insurance
and retirement-planning products. Abbreviated as “AmFam”, Amercian companies, Law Firms, Immigration applicants, and Schools. Our goal is
Family Insurance was founded in 1927 and is headquartered in Madison, to provide complete and precise communication, where all parties to the
Wisconsin. In it’s 90th year, American Family Insurance became the 4th conversation would feel as close as possible to as if they spoke the same
largest Wisconsin-based company and ranks #315 on the Fortune 500 language.
list nationally with revenues of $8.8 Billion. AmFam has more than
10,000 employees and nearly 3,000 agents.
OWNERSHIP: Private OWNERSHIP: Private
TENANT: Corporate TENANT: Corporate
# OF EMPLOYEES: 10,000 LOCATIONS: 1
COMPANY REVENUE: $10.3 Billion COMPANY REVENUE: Unknown
YEAR FOUNDED: 1927 YEAR FOUNDED: Unknown
HEADQUARTERED: Madison, Wisconsin HEADQUARTERED: Otsego, Minnesota
WEBSITE: www.amfam.com WEBSITE: www.gbrinterpreting.com
13
This information has been secured from sources we believe to be reliable, but we make no representations or warranties, expressed or implied, as to the accuracy of the information. References to square footage or age are approximate. Buyer
must verify the information and bears all risk for any inaccuracies. Any projections, opinions, assumptions or estimates used herein are for example purposes only and do not represent the current or future performance of the property. Marcus &
Millichap Real Estate Investment Services is a service mark of Marcus & Millichap Real Estate Services, Inc. © 2015 Marcus & MillichapMARKET AERIAL
LOCAL MAP

4.4 MILES     11.0 MILES   12.4 MILES
 Elk River,   Big Lake,    Monticello,
Minnesota     Minnesota    Minnesota
REGIONAL MAP

30.5 MILES     307.2 MILES   365.9 MILES
Minneapolis,   Green Bay,    Milwaukee,
 Minnesota     Wisconsin     Wisconsin
DEMOGRAPHIC SUMMARY
MARKET OVERVIEW
POPULATION 1 Miles 3 Miles 5 Miles HOUSEHOLDS BY EXPENDITURE 1 Miles 3 Miles 5 Miles
▪ 2023 Projection Total Average Household Retail Expenditure $87,987 $84,399 $87,717
Total Population 1,972 26,448 49,095 ▪ Consumer Expenditure Top 10 Categories
▪ 2018 Estimate Housing $24,056 $22,286 $23,410
Total Population 1,830 25,140 46,373 Transportation $13,648 $12,645 $13,273
▪ 2010 Census Shelter $12,415 $13,912 $13,980
Total Population 1,638 23,192 42,214 Personal Insurance and Pensions $9,965 $8,712 $9,376
▪ 2000 Census Food $9,680 $8,939 $9,361
Total Population 1,266 15,653 28,539 Health Care $8,016 $7,168 $7,602
▪ Current Daytime Population Entertainment $4,536 $4,195 $4,371
2018 Estimate 666 25,560 39,146 Utilities $4,150 $3,777 $3,976
HOUSEHOLDS 1 Miles 3 Miles 5 Miles Household Furnishings and Equipment $3,141 $2,838 $3,030
▪ 2023 Projection Cash Contributions $2,505 $2,337 $2,480
Total Households 691 9,956 17,785 POPULATION PROFILE 1 Miles 3 Miles 5 Miles
▪ 2018 Estimate ▪ Population By Age
Total Households 635 9,347 16,598 2018 Estimate Total Population 1,830 25,140 46,373
Average (Mean) Household Size 2.78 2.63 2.75 Under 20 28.45% 28.59% 29.10%
▪ 2010 Census 20 to 34 Years 17.18% 19.27% 18.39%
Total Households 550 8,328 14,688 35 to 39 Years 7.31% 7.78% 7.52%
▪ 2000 Census 40 to 49 Years 15.51% 14.12% 14.34%
Total Households 387 5,373 9,488 50 to 64 Years 23.04% 18.79% 19.77%
▪ Occupied Units Age 65+ 8.50% 11.45% 10.90%
2023 Projection 691 9,956 17,785 Median Age 38.00 36.36 36.67
2018 Estimate 649 9,675 17,010 ▪ Population 25+ by Education Level
HOUSEHOLDS BY INCOME 1 Miles 3 Miles 5 Miles 2018 Estimate Population Age 25+ 1,215 16,628 30,473
▪ 2018 Estimate Elementary (0-8) 0.29% 0.74% 0.57%
$150,000 or More 15.43% 13.88% 16.52% Some High School (9-11) 3.12% 3.77% 3.45%
25.39% 26.61% 29.45% High School Graduate (12) 31.37% 25.88% 25.13%
$100,000 - $149,000 21.06% 17.15% 17.00% Some College (13-15) 25.57% 26.61% 25.85%
$75,000 - $99,999 19.17% 17.16% 15.75% Associate Degree Only 15.47% 13.25% 13.36%
$50,000 - $74,999 10.53% 10.72% 9.36% Bachelors Degree Only 18.49% 22.39% 23.25%
$35,000 - $49,999 8.40% 14.47% 11.93% Graduate Degree 5.65% 6.83% 7.82%
Under $35,000 $101,646 $99,969 $109,664
Average Household Income $88,722 $86,039 $94,178
Median Household Income $35,319 $37,487 $39,454
18
This information has been secured from sources we believe to be reliable, but we make no representations or warranties, expressed or implied, as to the accuracy of the information. References to square footage or age are approximate. Buyer
must verify the information and bears all risk for any inaccuracies. Any projections, opinions, assumptions or estimates used herein are for example purposes only and do not represent the current or future performance of the property. Marcus &
Millichap Real Estate Investment Services is a service mark of Marcus & Millichap Real Estate Services, Inc. © 2015 Marcus & MillichapOTSEGO MARKETPLACE
OTSE GO, MN
Minnesota BOR: Jon Ruzicka
License: 40583288
EXCLUSIVE OFFERING
PRESENTED BY:
OFFICES
NATIONWIDE
www.marcusmillichap.comYou can also read