BARCLAYS CONFERENCE Capturing the plant based opportunity - Emmanuel Faber - Danone
←
→
Page content transcription
If your browser does not render page correctly, please read the page content below
BARCLAYS CONFERENCE

     Capturing the
plant based opportunity

    September 4, 2019

     Emmanuel Faber
    Chairman and CEO

                          I 1 I
In the age of flexitarianism and the rise of plant based food
A unique vision

                                                                I 2 I
In the age of flexitarianism and the rise of plant based food
A unique business

         Health-focused                                 Flexitarian                                Sustainable                                      Collective
            portfolio                                diets promotion                            farming practices                                   approach

                 89%(1)                                           #1                                     Leader                                 Partnership
             of volumes sold                             in fresh dairy and                               in organic                            networks for speed,
           recommended for                                  plant-based                                                                          impact and scale
           daily consumption

Source: Euromonitor, internal estimates. (1) 89% in 2018. Refers to water, yogurt and other daily dairy products, baby milks & foods, milks and milk powders,
beverages with 0% sugar and medical nutrition. Based on official public health recommendation, these categories are generally suitable for daily consumption.

                                                                                                                                                                      I 3 I
A unique, integrated model

                             I 4 I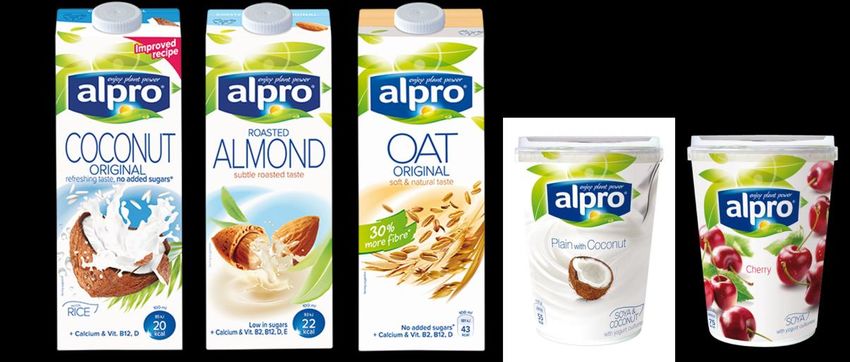
Danone uniquely
The opportunity:
                    positioned for the
    the age
                      plant-based
of flexitarianism
                      momentum

                                         I 5 I
The urgency for sustainable food systems and diets
Food at the heart of many of today’s world challenges

                      $1 spent on food
                           today                                                 =            $1 hidden cost
                                                                                            incurred for society
                                                                                         50%                 50%
                                                                                     consumption          production

                                 $1
                                                                                        Production-
                                                                                         related ill
                                                                                        health: 13%          Natural capital
                                                                                                            degradation: 26%

                                                                                                                 Biodiversity
                                                                                      Diet-related                loss: 11%
                                                                                      disease: 37%
                                                                                                                Imported
                                                                                                                food: 8%

                                                                                                         Farm support and
                                                                                                           regulation: 5%
Source : Sustainable Food Trust, « The Hidden Cost of UK Food », November 2017

                                                                                                                            I 6 I
A shift in eating habits and production practices is needed
Growing science evidence

      Oct-2018              Jan-2019                Apr-2019   Aug-2019

                                                                          I 7 I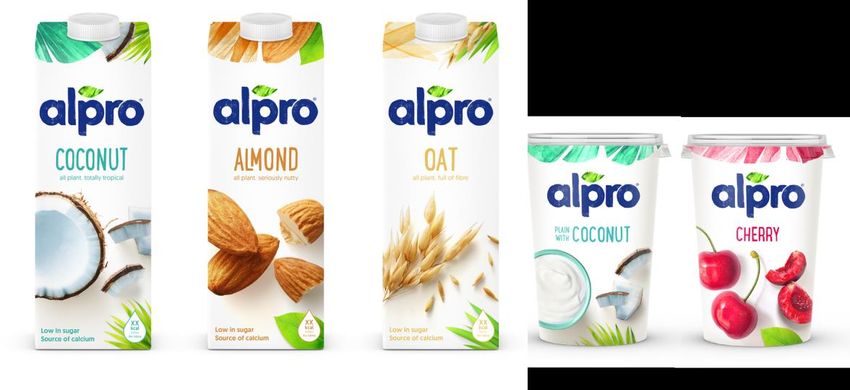
Towards protein-autonomous Europe
 One Planet. One Health at work at the macro level

                          Export                   Food for                Export                                      Export                              Food for                                             Export
                                                  Europeans                                                                                               Europeans
                                                (in % calories)                                                                                         (in % calories)

                                                                                                                                 Cereals and starchy foods            Fruit and vegetable

                                                                                                                                -40%
                                                                                                                                                                          Protein crops (peas, Lentils, ect.)

                                                                                                                                                                            Meat, eggs and fish
                                                                                                                                                                                                                   Volume
                                    GHGs                                                                                        GHGs
                                                                                                                                                                             Dairy products                        Quality
                                                                                                                                                                          Others

                                                  2010                                                                                                       2050
                         Crop production                           Livestock production                                 -30%                                                             -45%

                   Pesticides                                                                             Beneficial
                                                                                                          insects
                                           Intensive agriculture                                                                                 Agro-ecological
                                                                                                                                                   agriculture

                                                                                                         -90%
                                               Nitrogen losses                                                         x                                                                          x
                                                                                                            Import     No chemical                                             No vegetal protein/
                        Import Nitrogen fertilisers                        Animal feed                                   fertilizer                                            animal feed import

Source : Adapted from IDRRI, « An agroecological Europe in 2050: multifunctional agriculture for healthy eating”, Sept-2018

                                                                                                                                                                                                                             I 8 I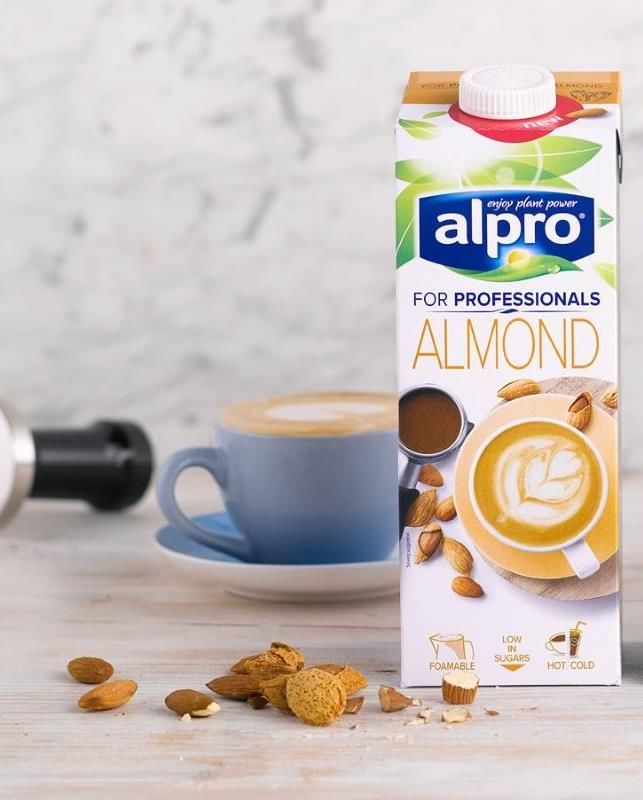
Consumers rethinking protein diet
One Planet. One Health at work in my plate
                    Personal statements about meat, seafood, poultry and meat alternatives (2018)

                                          60
              60                                                 57          56
                                                                                                         52
   % agree    50               46                                                                                   47
                                                      42                                                                                              43
                                                                                                                               41
              40                                                                                                                           37

              30

              20

              10

                0

                        « I make a point of regularly having meat-                                        « I am limiting or avoiding red
                            free days (eg meat-free Mondays) »                                           meat for environmental reasons »

Source: Lightspeed/Mintel. Limiting/avoiding red meat: Internet users ages 16+ 1,000 per country. Meat-free days: Internet users aged 16+ who have bought meat, seafood, poultry and
meat alternatives in the last 3 months – France (959), Germany (915), Italy (973), Poland (963), Spain (973)

                                                                                                                                                                                 I 9 I
Consumers rethinking protein diet
The role of food in climate change
                                          Proportion of total greenhouse gas emissions from food

                                          A quarter of global      Food          Other greenhouse gas
                                          Emissions come from      26%           emissions 74%
                                          food

                                          More than half of food   Animal products          Other food
                                          Emissions come from      58%                      42%
                                          animal products

                                          Half of all farmed       Beef & lamb           Other animal
                                          animal emissions         50%                   product
                                          come from beef                                 50%
                                          and lamb

Source: Poore & Nemecek (2018), Science

                                                                                                         I 10 I
Consumers rethinking protein diet
The highest-impact plant-based protein emits less than the lowest-impact animal protein
Kilograms of greenhouse gas emissions per serving
Low Impact Average High Impact
Beef
Lamb
A chocolate bar from
Farmed prawns
the deforested
Chocolate
rainforest emits more
Farmed fish
than a serving of
Pork
low-impact beef
Chicken
Cheese
Beer
Dairy milk
Eggs A portion of the highest-impact
Coffee vegetable proteins emits less than
Tofu the lowest-impact animal proteins
Beans
Nuts
0 5 10 15 kg
Source: BBC adapted from Poore & Nemecek (2018), Science
I 11 IDairy is critical for planetary diets
Dairy protein: environmental impact 5x lower than beef meat
Carbon footprint per 100g protein Land use per 100g protein
(kg CO2eq) (m²/year)
Soy drink 4 Soy drink 3
Milk 10 Milk 27
Beef 50 Beef 164
(beef herd) (beef herd)
0 10 20 30 40 50 60 0 20 40 60 80 100 120 140 160 180
Source: Adapted from Poore & Nemecek (2018), Science
I 12 IDairy is critical for planetary diets
Critical role in flexitarian diet and soil health as meat consumption reduces
▪ Value-added dairy diet fundamental to ▪ High quality, highly digestible proteins
balance meat reduction in future
agricultural models ▪ Dairy, especially yoghourt, considered
as protective food
▪ Grazing essential to soil health and
biodiversity
Methane output
(g/d)
▪ Fermented dairy recommended in
Milk C18 (% of total FA)
planetary diets
Source: Journal of Dairy Science, Vol 92, N°10, 2009 Source: Mozaffarian, Circulation 2016
I 13 IConsumer rethinking protein diet
Shift to flexitarian diets across generations
One in five UK adults say they are following flexitarian diets
Flexitarian / meat reduction Vegetarian Vegan
% 5 10 15 20
18-24 year olds
25-34 year olds
35-44 year olds
45-54 year olds
55+ year olds
Source: Waitrose food and drink report 2018-19
I 14 IConsumers rethinking protein diet
Science foundations for plant-based as a healthy diet option
Healthy balance of nutrients Effect in Type-2 Diabetes prevalence
▪ Low in saturated fat 8 7.6
6.1
T2D prevalence (%)
6
4.8
▪ High in unsaturated fat
4 3.2
2.9
▪ High in fibre
2
0
▪ Rich in vitamins and minerals
▪ Nutrient density
Source : Adventist Healthy Study-2
I 15 ISoy protein
Among the highest nutritional values
Protein scores (PDCAAS)
Egg white 1.00
1.00
▪ Scores better than any other proteins of plant origin
Milk (casein)
(ISP) Soy 1.00
Beef 0.92 ▪ Source of high quality protein
Pea protein 0.73
Kidney beans 0.68 ▪ Low in saturated fat
Pinto beans 0.63
Rolled oats 0.57
▪ Low in sugars
Rice 0.53
Source: J Agric Food Chem 59:12707-12, 2011
I 16 ISoy protein
Recognized health benefits
▪ Cholesterol-lowering potential
▪ Beneficial for cardiovascular health
▪ Lower risk of breast and prostate cancer
▪ Anti-inflammatory muscle impact
Source: “Soy and Health Update: Evaluation of the Clinical and Epidemiologic Litterature“, 24 November 2016; “No Difference Between the Effects of Supplementing With Soy Protein Versus Animal Protein on
Gains in Muscle Mass and Strength in Response to Resistance Exercise” (2018); World Cancer Research Fund, “Diet, Nutrition, Physical Activity and Cancer: a Global Perspective” (2018).
I 17 IFlexitarian diets becoming a prominent feature of mainstream food culture
Large growth opportunities ahead
CAGR
Market size (€bn) 2018-2023 (%)
2018 2023
€0bn €15bn €25bn
Total plant-based +9%
Plant-based milk
alternative +9%
Plant-based yogurt
+20%
alternative
Plant-based ice cream +17%
alternative
Source: Euromonitor, World excl. China; Total plant-based defined as of Free from Dairy, Ice Cream, Milk, Yogurt and Meat
I 18 IComplementary plant-based and dairy proteins categories
Bringing incremental value for dairy category and retailers
Shopper Shopper
NOT BUYING BUYING
plant based plant based
VALUE
OF DAIRY
BASKET Increase
£2.28 £3.11
+36% the average
spending per
dairy category per trip per trip basket in
Dairy & Plant
category
VALUE
OF DAIRY
31.2€ 39.4€ SPENT
+26%
dairy category per trip per trip
Source: Shopper Basket analysis in EU
I 19 IComplementary plant-based and dairy proteins categories
Bringing incremental value for dairy category and retailers
VALUE
OF GROCERY
SPENT
$40.5 $70.6 Increase
+74% the average
grocery per trip per trip spending per
basket in
Grocery
VALUE
17.1€ 40.4€ OF GROCERY
SPENT
grocery per trip per trip X2.4
Source: Shopper Basket analysis in EU
I 20 IHigh retailers acceptance and healthy shelf space growth drives plant-based growth
Alpro contributes to half of category growth in France
Increasing offer as retailers bet on the category Shelf space booming driving consumer awareness
Average # of Plant-Based SKU/ PoS Average Plant-Based shelf space (m) / PoS
36 7.5
33 6.7
29 5.4
24 4.4 4.6
21 4.2
18
CAGR 2016-19 CAGR 2016-19
+14% +18%
31 4.9
28
4.1
19 2.9
16 2.6
14 2.1 2.2
12
CAGR 2017-19 CAGR 2017-19
+28% +30%
2014 2015 2016 2017 2018 2019 2014 2015 2016 2017 2018 2019
Source: IRI France, 08-2019, Hyper and Supermarkets
I 21 IDanone uniquely
The opportunity:
positioned for the
the age
plant-based
of flexitarianism
momentum
I 22 IDriving plant-based growth
Objective: triple sales by 2025
~ € 5bn
3X
€ 1.7bn
2018 2025
I 23 IA pioneer and leader in plant-based
Following Whitewave acquisition in 2016
Source: Euromonitor, internal estimates
I 24 IUnparalleled scale, footprint and relative exposure
2018 estimated revenues
Pure plant-based players FMCG companies
(€m plant-based sales) (% of sales from plant-based)
€1.7bn 7%
Blue
Diamond Kellogg
Hain
Coca-Cola
Celestial
Beyond
Meat Nestle
Source: Based on internal estimates and Euromonitor, retail value for FY2018, plant-based defined as of Free from Dairy, Ice Cream, Milk, Yogurt and Meat
I 25 IA pioneer and leader in plant-based
Leadership positions across categories and segments
PB Milk Alternatives PB Yogurt Alternatives
Soy Almond Oat Total
USA
Europe EU9
UK
Germany
Belgium Market
share
Netherlands
France >60%
Italy 40%-60%
Spain
20%-40%
Portugal
0%-20%
Sweden
Source: Nielsen, MAT TY to Q1 2019, internal estimates
I 26 ISuperior offer, expertise and heritage
Driving product distinctiveness through technical superiority
Organoleptic liking score
Alpro 7.4 Silk
7.0
Competitor 1 5.9 Competitor 1 4.7
Source: Internal consumer blind test – Alpro EU 4 (Haystack), Silk US 2018
I 27 ISuperior offer, expertise and heritage
End-to-end process
Return on investment across the value chain
Farming
Processing Base Recipe Filling &
raw material
raw materials products formulation packaging
ingredients
I 28 ISuperior offer, expertise and heritage
A unique expertise: greatest research across spectrum of sources of protein
Mixing right blends for best products
Highest nutritional quality
Best degree of functionality
Best tasting
Lowest cost
Varieties and origins
I 29 ISuperior offer, expertise and heritage
Mastering a multi-ingredient playground
Mature Growing Booming Emerging Early stage
SOY
ALMOND COCONUT CASHEW
CHICKPEAS
PEA
OAT
CHIA
SESAME
HEMP
I 30 INew category fundamentals
Creating new opportunities
Plant-based Plant-based beverages and
yogurts growing
> 8%
Probiotics Proteins
Probiotic beverages High protein
and yogurts growing yogurt growing
> 6% > 10%
Source: Euromonitor value CAGR 2015-2017 total world. Plant-based excluding China
I 31 IInvesting for the next plant-based frontiers
Through partnerships and start-up portfolio
R&I partnerships
Creating complete food protein
from new fermentation
technology inspired by
Fermented plant
Yellowstone ecosystem
proteins
Chickpea protein
ingredient start-up
I 32 INative plant-based brand equity
Entitled to travel and expand into adjacent categories
Core business Adjacent categories
Ice-Cream Coffee inspired Culinary Plant-based nutrition
Beverages Yogurt Recruitment levers
I 33 ITarget new categories
Seizing plant-based coffee-inspired opportunity
Sizeable ready-to-drink Rolling out ready-to-drink Capturing growth
coffee category coffee in 2019 in coffee shops
~€20bn Alpro out of home plant-based
barista +40% CAGR in 2016-18
worldwide
Source : Euromonitor, internal estimates
I 34 IFostering out-of-home coffee mega opportunity
Drive in-store conversion with consumer proximity
Drive awareness that’s it’s Alpro
I 35 IPivoting acquired brands positioning
New brand visual
I 36 IPivoting acquired brands positioning
New brand visual
I 37 IPivoting acquired brands positioning
New brand visual
I 38 IPivoting acquired brands positioning
Moving brands into the One Planet. One Health frame of vision
Industry pioneer Pollinator
Sustainable
USA Segregated Conservation
Coconut Center
Palm Oil by 2020 Program
I 39 IPivoting brands into plant-based
Leveraging health heritage
Coffee Indulgence Kids Probiotics
I 40 IGrowing food allergy prevalence
Opening growth avenue for plant-based baby food
Ranking of products associated to Danone is #1
Food allergy as a global epidemy
allergy avoidance in China in soy-based IMF
Milk ranking among top 3 allergens
Plant-based as the first choice
Food allergy prevalence rates
~20%
~10%
~20%
~10%
15%
5%
Self-reported Symptomatic 1 2 3 4 5 6 7 8 9
Source : Tang & Mullins, 2017 Source: Toluna quick survey Source : Nielsen excluding US
I 41 IUnique market reach
Tailored geographical expansion
Main-stream Fast-growing Emerging Transforming
Plant-based Plant-based Push plant-based
Category rapidly evolving
Becoming main-stream catching up category development
Maintain leadership Capture market share Reestablish plant-based Establish brand as
and market share and leadership position and grow market share market innovator
I 42 IOur route to €5bn plant-based revenue by 2025
A key component of Danone’s 2030 goals
~€5bn
2/3
Core business(1)
▪ New geographies:
Adjacent categories LATAM, CIS and ASPAME
and new geographies expansion
(1) Core segments (plant-based beverages ▪ New categories, in
and plant-based yogurts) in core geographies
(North America and EU4) x3 particular coffee
1/3
▪ Core business continue
to grow HSD in line with
€1.7bn the market
2018 2025
I 43 IDanone best placed to capture the plant-based opportunity
4 key competitive advantages
1
X-times brand leadership in core segments,
science and technology
2
Chilled retail shelf synergies and
away-from-home potential (e.g. coffee)
3
Danone One Planet. One Health assets
support plant-based execution
4
Protein, probiotics, plant-based triangle
~ 75% of Danone sales
I 44 IIn the age of flexitarianism and the rise on plant based food
Danone best positioned to turn opportunity into value
I 45 IDisclaimer
• This presentation contains certain forward-looking statements concerning Danone. In some cases, you can identify these
forward-looking statements by forward-looking words, such as “estimate”, “expect”, “anticipate”, “project”, “plan”, “intend”,
“objective”, “believe”, “forecast”, “guidance”, “foresee”, “likely”, “may”, “should”, “goal”, “target”, “might”, “will”, “could”,
“predict”, “continue”, “convinced” and “confident”, the negative or plural of these words and other comparable
terminology. Forward looking statements in this document include, but are not limited to, predictions of future activities,
operations, direction, performance and results of Danone.
• Although Danone believes its expectations are based on reasonable assumptions, these forward-looking statements are
subject to numerous risks and uncertainties, which could cause actual results to differ materially from those anticipated in
these forward-looking statements. For a detailed description of these risks and uncertainties, please refer to the “Risk Factor”
section of Danone’s Registration Document (the current version of which is available on www.danone.com).
• Subject to regulatory requirements, Danone does not undertake to publicly update or revise any of these forward-looking
statements. This document does not constitute an offer to sell, or a solicitation of an offer to buy Danone securities.
I 46 IYou can also read