International Journal of Veterinary Science
←
→
Page content transcription
If your browser does not render page correctly, please read the page content below
P-ISSN: 2304-3075; E-ISSN: 2305-4360

                       International Journal of Veterinary Science
                                                 www.ijvets.com; editor@ijvets.com

Research Article
Evaluation of Physico-Chemical Properties and Nutrient Components of Dairy
Water Buffalo (Bubalus bubalis) Milk Collected during Early Lactation
Michelle M Balbin1,§, Jonathan V Lazaro2, Clarice R Candelaria2, Jerome G Cuasay2, Nancy S Abes1
and Claro N Mingala1,3,§*
1
  Philippine Carabao Center National Headquarters and Gene Pool, Science City of Muñoz 3120, Nueva Ecija, Philippines
2
  College of Veterinary Science and Medicine, Central Luzon State University, Science City of Muñoz 3120, Nueva Ecija,
Philippines; 3 Department of Animal Science, College of Agriculture, Central Luzon State University, Science City of
Muñoz 3120, Nueva Ecija, Philippines
§
  These authors contributed equally to this work.
*Corresponding author: cnmingala@hotmail.com

    Article History: 19-624       Received: July 08, 2019       Revised: July 29, 2019        Accepted: September 28, 2019

    AB S T RA C T
    The study determined the physico-chemical properties and nutrient component of dairy water buffalo (Bubalus bubalis) milk
    collected during early lactation. Specifically, it determined the association of the physicochemical properties and milk
    composition to physiological parameters (age, number of parities, history of mastitis) of the animals. Results showed that
    the properties of the buffalo milk collected during the early lactation have gravity of 1.033% titratable acidity of 0.14% and
    pH 6.63. Alcohol precipitation test for protein stability was positive. MBRT was 7 hours which means that the quality of
    milk was excellent. The mean milk components of dairy buffaloes were as follows: fat was 6.17%, protein was 4.56%,
    lactose was 4.73%, total solid (TS) was 15.53% and solid not fat (SNF) was 9.36% while the mean somatic cell count was
    122 x 1000 cell/ml. Among the physiological parameters, history of mastitis was significantly associated with pH and%
    lactose, parity was significantly associated with protein stability and age was significantly associated with% fat and% TS.
    Key words: Milk quality, Physico-chemical properties, Milk composition, Early lactation, Water buffalo

                       INTRODUCTION                                   Blue Reduction test (MBRT), milk component assessment
                                                                      and somatic cell count (SCC) help established the cow’s milk
      In the Philippines, dairy production is gaining                 quality standard (Ichikawa et al., 1998). In the Philippines,
popularity. The local supply of liquid milk is only about             cow’s milk standards for milk quality are being used to
1.12%. The total dairy animal population was 6.34% higher             evaluate the produce of water buffaloes. Although water
than the last year’s headcount. The country produced 20.4             buffalo’s milk has higher quality compared to cow’s milk,
million liters of fresh milk, 3.34% higher than last year's           there are no established standard that is being followed in
level of 19.7 million liters, 7.1 million liters or 36% were          ranking or grading the milk produced by water buffaloes.
water buffalo milk, 0.34 million liters or 1.7% were goat’s                Milk quality standards can be achieved through
milk and 65.5% or 12.9 million liters were cow’s milk. The            evaluation of milk quality such as physical and chemical
production from individual dairy farms shared around 38%              testing (specific gravity, titration acidity, alcohol
in the total water buffalo milk output while the                      precipitation test, MBRT and pH) and milk component
contributions to the total milk production from cooperative,          assessment (using Milkoscan) and SCC. Any failure at the
commercial and institutional dairy farms were 30.98%,                 farmer’s stage, deterioration on the quality of milk might
3.55% and 25.35%, respectively (PSA, 2016).                           occur and practically milk quality is not obtained, even
      In Japan, the quality of cow’s milk was standardized            though milk is basically a high quality food and good for
based on the genetic performance and breeds, feeding style            the health (Ichikawa et al., 1998).
and state of milk consumption. Tests such as physical and                  Studying milk quality would develop and establish
chemical testing (specific gravity, alcohol precipitation,            standards on buffalo’s milk serving as future reference data
titratable acidity, pH), microbiological testing (total               to rank or grade the milk. Prerequisite is to make further
aerobic plate count and total coliform count, Methylene               studies before quality standards can be well-established

Cite This Article as: Balbin MM, Lazaro JV, Candelaria CR, Cuasay JG, Abes NS and Mingala CN, 2020. Evaluation of
physico-chemical properties and nutrient components of dairy water buffalo (Bubalus bubalis) milk collected during early
lactation. Int J Vet Sci, 9(1): 24-29. www.ijvets.com (©2020 IJVS. All rights reserved)

                                                                 24
Int J Vet Sci, 2020, 9(1): 24-29.
regarding the milk quality standard for dairy buffaloes. 6.63, MBRT was seven hours. APT test for protein stability
This study was conducted to determine the physico- was positive. The results are in conformity to the standard
chemical properties and milk components of dairy buffalo range provided by the FAO (1989) for physico-chemical
milk collected during early lactation. Specifically, it properties and MBRT by Wehr and Frank (2004) except
determined the association of the physicochemical properties protein stability. This means that the water buffalo milk
and milk composition to physiological parameters (age, passed the physico-chemical properties and microbial
number of parities, history of mastitis) of the animals. quality and was fit for human consumption. The results on
the specific gravity, titratable acidity, pH are shown in
MATERIALS AND METHODS Figure 1. Variation existed possibly due to various factors
like the age of the animal, number of lactation cycles,
Animal Selection and Identification breed, diet, and diseases (Tsioulpas et al., 2007).
A total of five water buffaloes at their early lactation The specific gravity was highest during the fifth week
were used as experimental animals. Early lactation of collection at 1.034 and lowest during the 13 th and 17th
according to Oliveira et al. (2010) is approximately one week at 1.032. Titratable acidity was highest during 5 th,
month after the start of lactation but not exceeding four 13th, and 17th week of collection at 0. 15% and lowest
months. The animal profile such as age, number of parity, during the 9th week, 0. 12%. Titratable acidity increases in
and history of mastitis record were gathered. the presence of acid-producing bacteria and decreases by
the addition of water or neutralization (Ichikawa et al.,
California Mastitis Test (CMT) 1998). The highest pH was recorded on the 5th week at 7.03
The CMT is routine practice in the milk collection site, and lowest on the 13th week at 6.13. The results are in
and it is conducted before milking. About one teaspoon (5 congruence of the study of Mahmood and Usman (2010)
ml) of milk from each quarter was collected from each of with few numerical differences, which was 6.53 - 7.00. The
the animal and an equal amount of CMT solution was shortest time for the methylene blue to disappear was 5.1
added and mixed to each cup in the paddle. The milk from hours on the 13th week and the longest was 8 hours on the
the animals with mastitis has a visible gel-like formation. 17th week (Figure 1).
This formation has an equivalent CMT scores which is
directly related to average somatic cell counts present in the Table 1: Interpretation of CMT scores
milk (Table 1). CMT score Somatic cell range Interpretation
N (Negative) 0 – 200,000 Healthy Quarter
Evaluation of the physico-chemical properties and T (Trace) 200,000 – 400,000 Subclinical Mastitis
MBRT of milk samples 1 400,000 – 1,200,000 Subclinical Mastitis
Collection of milk samples was done on the 5th week, 2 1,200,000 – 5,000,000Serious Mastitis Infection
9 week, 13th week, and 17th week of lactation. The
th 3 Over 5,000,000 Serious Mastitis Infection
collection was done twice a day (early morning and
afternoon) in the whole duration of the experiment. A total Table 2: Overall mean of the physico-chemical properties and
of 400 ml of milk samples per animal were collected using MBRT
a milking machine. Samples were placed in a clean and Mean FAO
sterile bottle to avoid contamination and transported Specific gravity 1.0330 1.030-1.036
immediately in the laboratory. % Titratable acidity 0.14 0.13-0.16
Milk tests include specific gravity, titrable acidity, pH 6.63 6.6-6.8
MBRT (hrs.) 7
alcohol precipitation, pH (Draaiyer et al., 2009) and MBRT
(Atherton and Newlander, 1977). The raw data were
analyzed using Tukey's Studentized Range (HSD), Pearson Low specific gravity would mean that the milk has
Correlation Coefficient, and graphical analysis. more milk fat or water was added. According to Ichikawa
et al. (1998), milk with more SNF has higher specific
Assessment of milk component and somatic cell count gravity. The buildup of acids in milk could be due to the
Pooled milk samples per animal were collected from handling of cows during milking, poor milking and storage
the 2nd, 3rd, 4th, 5th, 9th, 13th and 17th week. A total of facilities, and high storage temperature. Malnutrition could
50 ml milk per animal was collected directly from the milk lead to acidosis or hypoglycemia in animals. This increases
machine receiver using conical tube to accommodate all the the blood lactic acid levels in the milk especially in high
tests involved. Iodine was used as an antiseptic using teat yielding cows. Presence of lactose-fermenting bacteria in
dips after milking. A 0.5 ml of 10% Potassium Dichromate the udders such as Streptococcus agalactiae can also
was added to the samples that were not processed within increase the lactic acid in the milk (Ichikawa et al., 1998).
the day of collection. The pH recorded among the samples was in
Automatic milk analyser was used to evaluate the milk accordance with the findings of Kanwal et al. (2004) and
composition such as fat, protein, lactose, total solids (TS) and Imran et al. (2008). According to Ichikawa et al. (1998), an
solids not fat (SNF) and the SCC. Association, descriptive increase in the pH of the milk can be due to mastitis. If less
and graphical analysis were used to interpret the data. than the normal range, an increase in the acid level is
suggested due to poor storage and high temperature (PCC,
RESULTS AND DISCUSSION 2005). With regards to the MBRT, the quality of milk is
fair if the reduction time is 4 to 6 hours and the approximate
Physico-chemical Properties and MBRT of milk samples number of bacteria per ml is less than 750, 000, while if the
The overall mean specific gravity for the early quality of milk is excellent the reduction is 7 to 9 hours and
lactation was 1.033.% titratable acidity was 0.14%, pH was the approximate number of bacteria per ml is less than
25Int J Vet Sci, 2020, 9(1): 24-29.
Table 3: Association of age, parity and history of mastitis to physico-chemical properties and microbial quality.
pH % Titratable Acidity Specific gravity Protein stability MBRT (hrs.)
Age Correlation -0.08441 0.15408 0.09700 0.00000 -0.40978
p-value 0.7235 0.5166 0.6841 1.0000 0.1149
Correlation -0.02070 -0.13940 -0.19939 0.49237 0.08496
Parity p-value 0.9310 0.5578 0.3993 0.0274* 0.7544
History of Correlation -0.353 -0.0105 -0.1695 0.0773 0.043
mastitis p-value 0.0265* 0.823 0.3115 0.3775 0.793
*Correlation is significant at the 0.05 level (2-tailed); **Correlation is significant at the 0.01 level (2-tailed).
Table 4: Mean with standard deviation and range of milk components and SCC obtained during early lactation with reference to other studies.
Mean with standard deviation Range Aneja et al. (2002) Mamhood and Usman (2010)
%Fat 6.17±1.43 3.07-9.15 6.71 7.97±0.44
%Protein 4.56±0.58 3.41-5.59 4.52 4.36±0.23
%Lactose 4.73±0.39 3.27-5.26 4.45 5.41±0.54
%TS 15.53±1.38 12.50-18.81 16.82 18.45±0.85
%SNF 9.36±0.55 8.25-10.32 10.11
SCC (1000cells/ml) 122±109 23.6-481.88
Table 5: Association of age, parity and history of mastitis to milk components and SCC
% Fat % Protein % Lactose % TS % SNF SCC
Age Correlation -.497** -0.184 0.126 -.527** -0.033 0.355*
p-value 0.002 0.289 0.471 0.001 0.849 0.036
Parity Correlation -0.275 -0.271 0.16 -.341* -0.143 0.081
p-value 0.111 0.116 0.359 0.045 0.414 0.646
history of mastitis Correlation -0.083 -0.147 -0.218 -0.193 -0.269 0.041
p-value 0.634 0.399 0.209 0.266 0.118 0.816
*Correlation is significant at the 0.05 level (2-tailed); **Correlation is significant at the 0.01 level (2-tailed).
Table 6: T-test result of age, milk components and SCC.
Fat Protein Lactose TS SNF SCC
Age 1-5 6.71** 4.61 4.70 16.05** 9.34 82.86**
Age 6-10 5.36** 4.49 4.79 14.75** 9.39 180.76**
*Correlation is significant at the 0.05 level (2-tailed); **Correlation is significant at the 0.01 level (2-tailed).
Table 7: T-test result of parity, milk components and SCC.
Fat Protein Lactose TS SNF SCC
Parity 0-2 6.20 4.69 4.68 15.64 9.44 131.16
Parity 3-6 6.13 4.37 4.82 15.38 9.25 108.31
*Correlation is significant at the 0.05 level (2-tailed); **Correlation is significant at the 0.01 level (2-tailed).
50,000 (Wehr and Frank, 2004). Furthermore, according to of milk. This could imply that the animal used in the study
Michael (2012), the microbial quality of milk is influenced may be infected with subclinical mastitis. According to
by the hygiene and sanitary conditions or practices of milk Hassan (2013), the pH is significantly higher in the infected
collection at the farm. Microflora present on teat skin, animal’s milk than uninfected milk. These changes were
milking machine and milker’s hand, water and the milking linked to increased permeability of the mammary
environment are different sources that could influence epithelium cell which leads to the transfer of the
contamination of microorganisms in milk. Such factors components from blood to milk such as citrates,
affect the quality of milk thus; increase in numbers of bicarbonates that cause elevated pH levels. The probable
microorganism is linked to hygiene practices during reason of pH increase due to severity of mastitis may be
milking. The MBRT is a faster way to detect the quality of attributed to the lowered acidity as found in mastitic milk.
milk and result will be determined in a few hours unlike The lowered acidity in mastitic milk is due to the reduction
other tests which will take days to determine the quality of in lactose contents as the lactic acid formation is minimum
milk. However, it can only be applied to aerobic bacteria. in this case (Ahmad et al., 2005).
The result of APT was positive contrary to the negative Furthermore, parity was significantly associated with
result set by FAO (1989) (Table 2). This means that the the protein stability. According to Bonfatti et al. (2012),
milk samples could be high-acidity alcohol-unstable milk. parity affected the content of protein fractions as well as
There was build-up of lactic acid and other acids in milk, protein composition. Contents TCN, WH, αS2-CN, β-CN,
calcium has liberated from milk proteins, and calcium and κ-CN decreased as parity increased. Decreased
lactate and other calcium acid salts were formed. The milk contents of all casein and whey protein fractions were
proteins then become unstable and coagulate in the observed for parity greater than three relatives to earlier
presence of 70% alcohol (Ichikawa et al., 1998). parities, whereas content of glyco-κ-CN was lower for the
The association of physiological parameters with first parity relative to succeeding parities. No previous
physico-chemical properties and microbial quality are study investigated parity effects on water buffalo milk
shown in Table 3. Results showed that during early protein composition, but their results largely agree with
lactation, history of mastitis has significant effect on the pH those reported for protein composition of bovine milk
26Int J Vet Sci, 2020, 9(1): 24-29.
Fig. 1: Physico-chemical properties and MBRT of the milk samples during early lactation. A) Specific gravity, B) Titratable acidity, C)
pH and, D) MBRT.
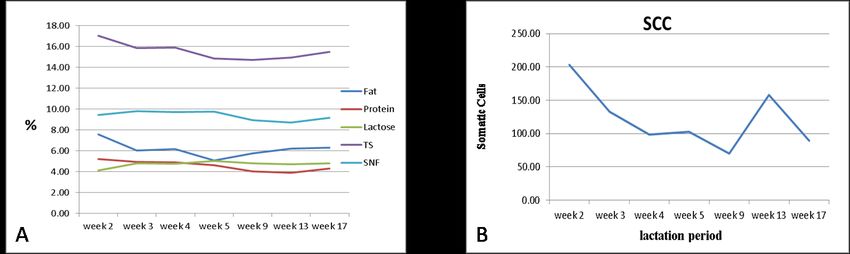
Fig. 2: A) Trends in milk composition during early lactation (1 week post calving) and B) SCC during the time of collection.
(NG-Kwai-Hang et al., 1987). According to them, the 5.26%, 12.50-18.81% and 8.25-10.32%, respectively.
content of αS-CN progressively increased from the first to Results of the study have a wider range except for the% TS
the third parity and decreased in later parities, β-CN compared to the results of Mahmood and Usman (2010) for
decreased when parity number increased, and the sum of fat, protein, lactose and TS which is 6.99-8.41%, 4.01-
αS-CN, β-CN and κ-CN decreased when cows got older. 4.78%, 4.56-6.21% and 16.99-20.18%, respectively (Table
4).
Milk Components and SCC Wider range of results can be attributed to the
Results showed that the mean fat content of water variations of the milk composition of individual animals.
buffalo milk was 6.17±1.43% which was nearly similar These variations depend on genetic factors such as breed
with the results of Aneja et al. (2002) and Mahmood and and pedigree, physiological factors such as the stage of
Usman (2010). Milk fat of water buffalo milk normally lactation, feeding factors such as the quality and quantity
varies from 4.4 to 8.9%. Mean SNF content from milk of feed, and environmental factors such as summer heat and
collected was slightly lower than the results of Aneja et al. disease such as mastitis (Ichikawa et al., 1998).
(2002). The concentration of protein, lactose and TS were The fat % was highest during the second week of
4.56±0.58%, 4.73±0.39%, and 15.53±1.38%, respectively. lactation which is 7.58% and was lowest during the fifth
Results from the study are nearly the same as the results of week which is 5.09%. Sudden decrease was observed from
Aneja et al. (2002) but% lactose and% total solids were second week to fifth week of lactation and gradual increase
lower than the results of Mahmood and Usman (2010). from fifth week to seventeenth week of lactation is shown
Furthermore, the concentration of fat, protein, lactose, TS in Figure 2. Changes in the milk fat % can be due to the
and SNF was in range of 3.07-9.15%, 3.41-5.59%, 3.27- amount of roughage fed to the animal and the ambient
27Int J Vet Sci, 2020, 9(1): 24-29.
temperature during the collection. It is known that decrease significant correlation to percent TS. California mastitis
in roughage consumption can lead to lower rumen pH, and test as a basis for history of mastitis shows no significant
this can decrease the number of protozoa and cellulose correlation on milk content and SCC.
degrading bacteria. This will be followed by the increased Table 6 shows that t-test revealed that both age group
generation of propionic and valeric acids and decreased of 1-5 and 6-10 has a significant correlation on fat %, TS
generation of acetic and butyric acids for use in milk fat % and SCC while both sets of parity had no significant
synthesis (Ichikawa et al., 1998). Daily rations for lactating correlation to milk components and SCC. This means that
cows consist of 25 kg/hd/d of napier/silage, 5.4 kg/hd/d of the older the animal the lower could be the fat % and TS %
rice straw, 7.5 kg/hd/d of spent grain and 4.30kg/hd/d of and higher SCC.
dairy concentrate. Changes in the fat components may not Among the physiological parameters, age was
be attributed to their feeds because there was no change in significantly associated with fat %, TS % and SCC while
the composition and quantity of their diet during the period history of mastitis was highly significantly associated with
of collection. Therefore, as the temperature in the rumen lactose. The older the animal the lower could be the fat %
increased due to an increased in the ambient temperature, and TS % and the higher the SCC.
the bacterial flora changed and the synthesis of short- chain In conclusion, the milk quality of water buffaloes at
fatty-acids also decreased, resulting in decreased fat, early stage of lactation was evaluated in this study. The
especially in unsaturated fat (Ichikawa et al., 1998). physico-chemical properties of dairy water buffalo milk
The protein % has its highest % age on the second collected during early lactation were as follows: specific
week of lactation. This can be due to the secretion of gravity was 1.033% titratable acidity was 0.14%. pH was
colostrum milk which is high in immunoglobulins content 6.63 which are all under the normal range set by FAO
during the first week of lactation. Slight change in protein (1989). MBRT for microbial quality was seven hours.
% as the lactation progresses was shown in Figure 2. Alcohol precipitation test for protein stability was positive.
Lactose was observed to have a low age % in the second Among the physiological parameters, history of mastitis
week of lactation and showed a gradual increase as was significantly associated with pH and parity was
lactation progresses. TS indicating all solid contents significantly associated with protein stability.
present in milk were also high at the second week of The milk components of dairy water buffaloes during
lactation and showed a decrease as the lactation progresses. early lactation were as follows: fat was 6.17%, protein was
These results conform to Hurley (2010) that the 4.56%, lactose was 4.73%, TS was 15.53% and SNF was
composition of colostrum is considerably different from 9.36% while the mean SCC was 122 x 1000 cell/ml.
the composition of normal milk. As observed, it took 3 to Among the physiological parameters, age was significantly
5 days post-partum for the secretions to change in associated with fat %, TS % and SCC while history of
component of milk. During this period the TS, especially mastitis was highly significantly associated with lactose.
the immunoglobulins, were elevated. Generally, lactose The older the animal the lower could be the fat % and TS
content is depressed in colostrums. High lactose in the % and the higher the SCC. Age and history of mastitis have
intestine can cause scours in calves, and presumably the significant effect on milk components. Thus, these
reduced lactose content of colostrum helps to prevent this physiological changes should be monitored for the
disease. Therefore, it is imperative to let the calves suck selection of animal that would produce quality milk and to
milk from the dam during those days. prevent economic loss.
SNF was measured by subtracting fat % to TS. SNF It is suggested that further study should be conducted
was higher during second week of lactation due to high regarding quality of milk in order to develop and establish
protein content which has great contribution to the TS. SNF standards that could serve as future reference data to rank
was directly proportional to protein and lactose (Figure 2) or grade the water buffalo’s milk.
but was inversely proportional to fat.
SCC mean result was 122 x1000 cell/ml, which has no Acknowledgments
effect on milk components according to Ichikawa et al. We thank PCC for the valuable support. We also thank
(1998) and does not exceed the limit of 400,000 cells per all the staff of the PCC Biosafety and Environment Section
ml for SCC set by European Union Directives (Barbosa et and the Gene Pool for providing support and assistance to
al., 2010). It also showed that SCC did not exceed the conduct the study.
normal count of milk which isInt J Vet Sci, 2020, 9(1): 24-29.
composition in Mediterranean water buffalo. J Dairy Sci, 95: Mahmood A and Usman S, 2010. A comparative study on the
4223–4229. physicochemical parameters of milk samples collected from
Draaiyer J, Dugdill B, Bennett A, et al., 2009. Milk Testing and buffalo, cow, goat and sheep of Gujrat, Pakistan. Pak J Nutr,
Payment Systems Resource Book a practical guide to assist 9: 1192–1197.
milk producer groups. Food and Agriculture Organization of Michel V, 2012. Raw Milk Microbial Quality: Effect on Dairy
the United Nations, Rome. Products Quality. Actilait, Institut Technique du Lait et des
FAO, 1989. Milking, Milk Production Hygiene and Udder Health. Produits Laitiers, La Roche sur Foron, France.
Food and Agriculture Organization of the United Nations, NG-Kwai-Hang KF, Hayes JF, Moxley JE, et al., 1987. Variation
Rome. in milk protein concentrations associated with genetic
Hassan HJ, 2013. Variations in milk composition of some farm polymorphism and environmental factors. J Dairy Sci, 70:
animals resulted by sub-clinical mastitis in Al-diwania 563–570.
Province. Bas J Vet Res, 12: 17–24. Oliveira JS, Souza AO, Fernandes SAA, et al., 2010. Buffaloes
Hurley W, 2010. The Lactation Biology. University of Illinois,
milk physicochemical properties raised on tropical pasture.
Urbana-Champaign. URL http://ansci.illinois.edu/static/
Rev Vet, 21: 538-540.
ansc438/Mastitis/control.html (accessed 4.27.19).
PCC, 2005. PCC Training Manual. Philippine Carabao Center,
Ichikawa T, Ohura Y, Nakano S, et al., 1998. Technical Manual
Science City of Munoz, Philippines.
for Milk Quality Improvement. Japan Livestock Technology
PSA, 2016. Dairy Industry Performance Report. Philippine
Association, Japan.
Imran M, Khan H, Hassan SS, et al., 2008. Physicochemical Statistics Authority, Quezon City, Philippines.
characteristics of various milk samples available in Pakistan. Tsioulpas A, Grandison A and Lewis M, 2007. Changes in
J Zhejiang Univ B, 9: 546–551. physical properties of bovine milk from the colostrum period
Kanwal R, Ahmed T and Mirza B, 2004. Comparative analysis of to early lactation. J Dairy Sci, 90: 5012–5017.
quality of milk collected from buffalo, cow, goat and sheep Wehr HM and Frank JF, 2004. Standard Methods for Examination
of Rawalpindi/Islamabad Region in Pakistan. Asian J Plant of Dairy Products. American Public Health Association,
Sci, 3: 300–305. Washington, DC.
29You can also read