FY Ended March 2019 Full Year Results Presentation
←
→
Page content transcription
If your browser does not render page correctly, please read the page content below
FY Ended March 2019
                                                                          Full Year Results Presentation
                                                                                                                        Apr 26, 2019

[Disclaimer]
The contents of this material and comments made during the questions and answers etc. of this
briefing session are the judgements and projections of the Company’s managements based on
currently available information.
These contents involve the risk and uncertainty and the actual results may differ materially from them.   © SEGA SAMMY HOLDINGS INC. All Rights Reserved.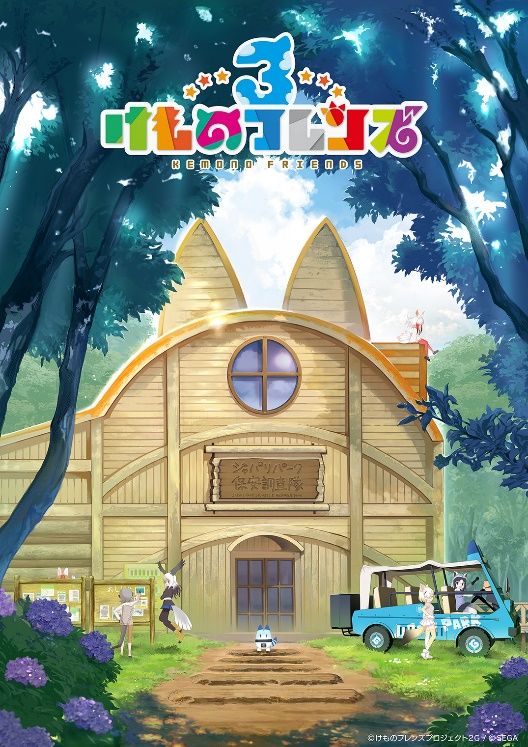
1. Full Year Results / Full Year Forecasts

Results Highlights
(JPY Billion)
2018/3 2019/3 2020/3
Results Results Forecast 2019/3 Full Year Results
Sales 323.6 331.6 390.0
Sales increased but profit decreased
Operating Income 17.7 13.0 27.0 from last fiscal year.
Operating Income Margin 5.5% 3.9% 6.9% Performance of Pachislot and
Non-operating income 3.2 2.1 1.5 Pachinko business and Digital Games
area went below expectation
Non-operating expenses 6.4 7.7 5.5
Ordinary Income 14.5 7.4 23.0 2020/3 Full Year Forecasts
Extraordinary income 0.9 8.2 - Both sales and profit expected to be
Extraordinary losses 3.1 8.7 -
increased.
Sell machines centered on new regulation
Income before income taxes 12.4 6.9 23.0
(type 6) machines and expect increase of
Profit (loss) attributable to
owners of parent
8.9 2.6 15.0 unit sales in Pachislot and Pachinko
business.
ROA※ 1.8% 0.6% -
Put an effort to improve the profitability of
* ROA = Profit attributable to owners of parent / Total assets
Digital Game area.
*For more details, please see “ FY Ending March 2019 Appendix”
-3-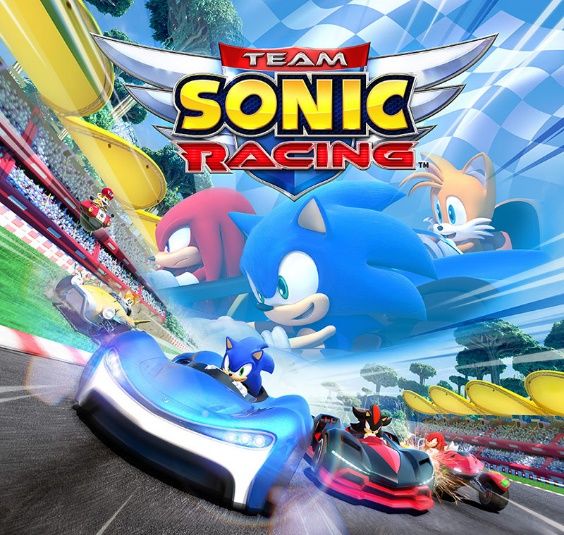
(JPY Billion)
                                                                                          Breakdown of Income
                                                                                                     (2019/3 Full Year results)
                                                                        Non-operating income / losses and
                                                                        extraordinary income / losses                  (JPY Billion)

                                                                      Non-operating income                                   2.1
                                                                            Dividends income                                 0.4
                                                                            Gain on investments in partnership               0.4
                                                                            Other                                            1.3

                                                                      Non-operating expenses                                 7.7
                                                                            Equity in loss of affiliates                     3.8
                                                                            Rent expenses                                    0.9
                                                                            Other                                            3.0

                                                                      Extraordinary income                                   8.2
                                                                        Gain on sales of noncurrent assets                   5.2
                                                                        Gain on sales of investment securities               1.7
                                                                        Other                                                1.3

                                                                      Extraordinary losses                                   8.7
                                                                        Impairment loss                                      8.3
※1 Income before Income Taxes not including Extraordinary Losses        Other                                                0.4

                                                                                                                                       -4-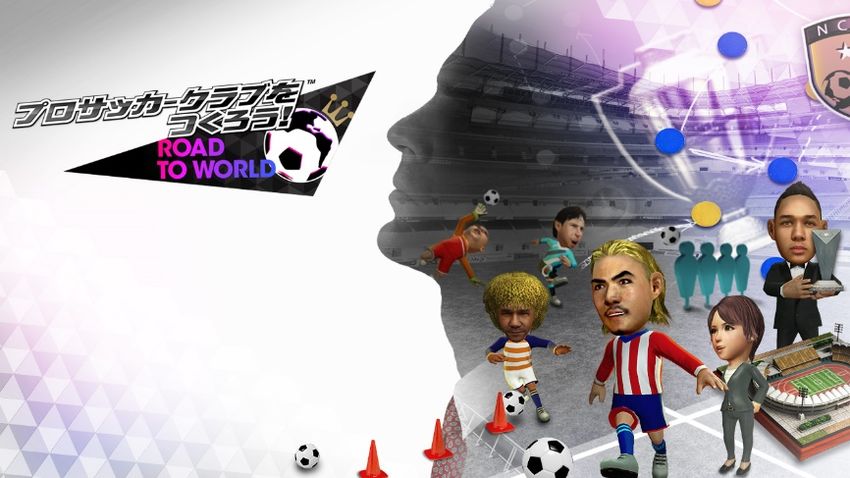
Consolidated Costs and Expenses
                                                (JPY Billion)

                                                                (Main factors)

                     2018/3       2019/3       2020/3
                                                                             2019/3                        2020/3
                     Results      Results      Forecast                      Results                     Forecasts
R&D Expense /                                                    Increased in association with   Increase in association with
Content Production         62.0         66.6           72.5      the launch of new titles in     the launch of new titles in
Expense                                                          Digital Games area              Packaged Games area
                                                                 Increased in association with
                                                                                                 Decrease in association with
                                                                 the relocation of
                                                                                                 the completion of relocation
Cap-ex                     24.1         34.4           24.8      headquarters
                                                                 Accelerated depreciation
                                                                 decreased in relation to the
                                                                 execution of relocation.
Depreciation               16.2         14.5           13.6
                                                                                                 Advertising expenses
                                                                                                 increases in association with
                                                                                                 the launch of new titles in
                                                                 -
Advertising                15.4         16.0           21.0                                      Packaged Games area and
                                                                                                 Pachislot and Pachinko
                                                                                                 business.

                                                                                                                           -5-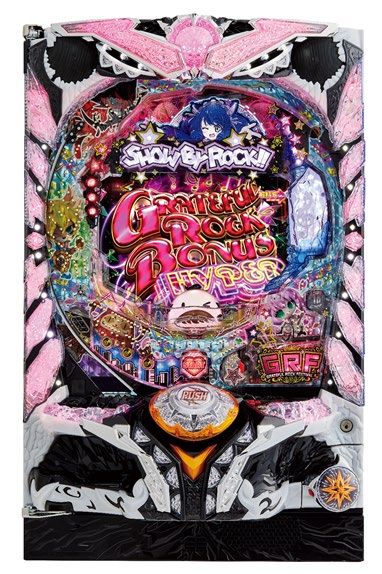
Consolidated Balance Sheet                                                (JPY Billion)
                                                                                          Consolidated Balance Sheet
                                  As of end of
                                  March 2018
                                                    As of end of
                                                    March 2019
                                                                      Change
                                                                                                           Summary
   Total Current Assets                    272.3             260.4          -11.9
             Cash and
                                           157.8             137.4          -20.4
                                                                                           Main factors                         Changes
             Deposits
             Securities                      24.6              14.5         -10.1          Current Assets
   Total Noncurrent Assets                 201.1             204.1             +3.0
                                                                                           Cash, deposits and securities
   Total liabilities and net
                                           473.4             464.6             -8.8
   assets                                                                                  decreased while trade notes and
   Total Current Liabilities                 84.4              87.5            +3.1                                               -11.9
                                                                                           accounts receivable and inventory
             Corporate Bonds                 10.0              12.5            +2.5        assets increased
   Total Noncurrent Liabilities              78.5              71.7            -6.8
             Corporate Bonds                 22.5              10.0         -12.5          Non-current Assets
   Total Liabilities                       163.0             159.3             -3.7        Tangible fixed assets increased in
   Total Net Assets                        310.4             305.3             -5.1        association with relocation of
   Total Liabilities and
   Net Assets
                                           473.4             464.6             -8.8        headquarter. Investment securities      +3.0
                                                                                           and investment in capital also
                                  As of end of      As of end of
                                  March 2018        March 2019
                                                                      Change
                                                                                           increased.
   Cash and cash
                                            176.5             148.0            -28.5
   equivalents
   Interest bearing debt                     87.0              76.1            -10.9       Liabilities
   Net cash                                  89.5              71.8            -17.7       Redemption of corporate bonds and
   Equity Ratio                            65.0%             65.1%                         payment of loans payable                -3.7
                                                                                           decreased
                                                                                                                                      -6-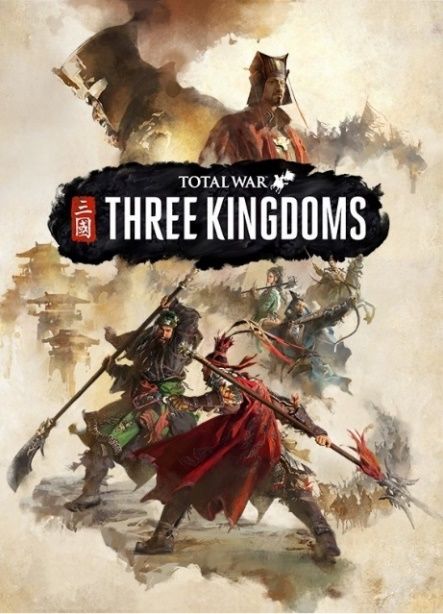
Consolidated Cash Flows
                                                        (JPY Billion)       Cash Flows from Operating Activities
  Cash and cash
  equivalents                                                                Income before income taxes                   +6.9
End FY2018/3              176.5
                                                                             Depreciation and amortization               +18.8

                                                            Cash Flows       Increase in trade notes and
                                                                                                                         -10.2
                                                               from          accounts receivable
                                                             Operating       Increase in inventory assets                -10.0
                                                             Activities
                                                                             Other                                        +9.3
                                                               +14.8

                                          Cash Flows
                                             from                           Cash Flows from Investing Activities
                                           Investing
                                           Activities                        Purchase of property, plant and equipment   -18.2

                                            -22.1                            Sales of property, plant and equipment      +10.3
                                                                             Purchase of intangible assets               -10.2
                            Cash Flows
                                from                                         Other                                        -4.0
                             Financing
                             Activities
                                                                            Cash Flows from Financing Activities
                              -20.6
                                                                             Proceeds from long-term loans payable       +14.9
                                                                             Payment of long-term loans payable          -15.8
End FY2019/3      148.0
                                                                             Redemption of bonds                         -10.0
                                                                             Other                                        -9.7

                                                                                                                                 -7-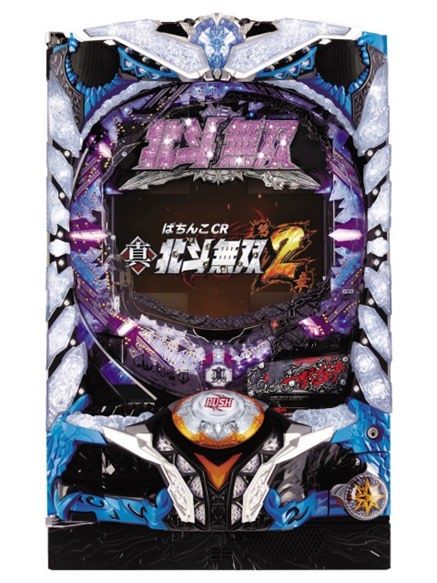
Relocation Expenses
                                                                                (2019/3 full year results)
Incurrence of expenses for relocation of
headquarter
 - One-off relocation expenses (Reference)
                                    (JPY Billion)
                                                    One-off expenses for
                                                        relocation                                     (JPY Billion)

                                                                                   2018/3           2019/3
                                                                                  (Result)         (Result)

                                                    Consolidated                             2.4              4.9
                                                          Pachislot and
                                                                                             0.8               1.1
                                                          Pachinko Machines
                                                          Entertainment
                                                                                             1.4               3.0
                                                          Contents
                                                          Resort                             0.0               0.0

                                                          Other / Elimination                0.2               0.8

                                                                                                                       -8-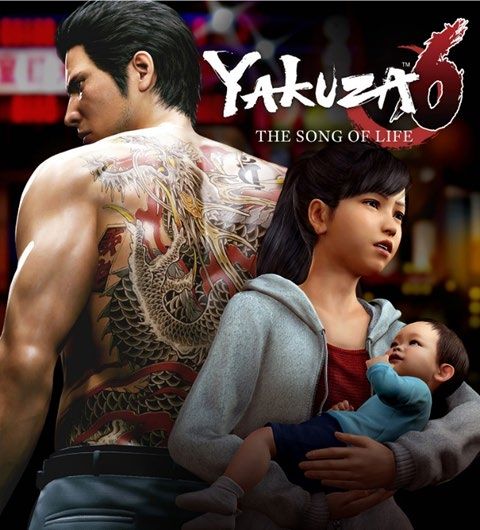
2.Full Year Results / Full Year Forecast per Segments
Pachislot and Pachinko
Machines Business
Sales
Operating Income
Operating Income margin
(JPY Billion) 2019/3 Full Year Results
Profits increased while sales decreased from last fiscal year.
Pachislot: No. of titles and sales units decreased due to the
continuous low approval ratio of proto-type testing
for new reg. (type 6) machines.
Pachinko: Sold centered on previous reg. machines
and sales unit increased.
(Sales units transition)
2018/3 2019/3 2020/3
(Results) (Results) (Forecasts)
Pachislot 85,401 67,140 120,000
Pachinko 140,013 159,848 164,000
Board + Frame 97,655 91,858 78,600
Board 42,358 67,990 85,400
- 10 -Pachislot and Pachinko
Machines Business
Sales
Operating Income
2020/3 Full Year Forecasts
Operating Income margin
(JPY Billion)
Plan to increase sales and profit
Pachislot: Sell machines centered on new reg. as increase
of demands expected from replacement of
previous reg. machines.
Pachinko: Sell machines centered on new reg. and plan to
sell units at same level with previous FY.
Expect significant increase of profit with measures
to recover operating income margin such as
reuse, etc.
(Sales units transition) 2018/3 2019/3 2020/3
(Results) (Results) (Forecast)
Pachislot 85,401 67,140 120,000
Pachinko 140,013 159,848 164,000
Board + Frame 97,655 91,858 78,600
Board 42,358 67,990 85,400
- 11 -Pachislot and Pachinko Machines
Business
Major titles in 2019/3 Titles in and after 2020/3
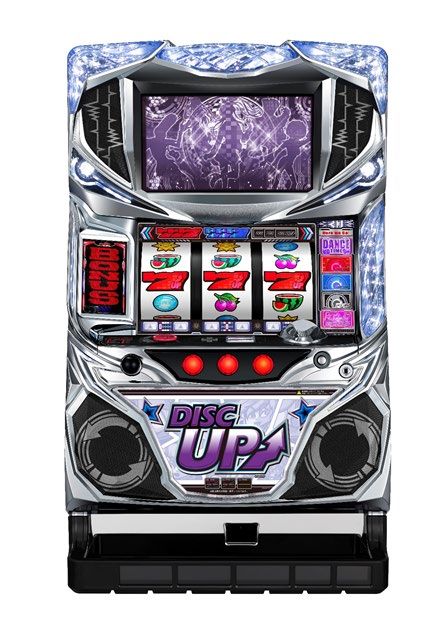
“Pachislot DISC UP” “Pachinko CR Shin Hokuto “Pachislot DISC UP” “P SHOW BY ROCK‼”
Muso Chapter 2” 5th version White Panel
©2012,2019 SANRIO CO.,LTD. APPROVAL
NO.S593668 SP# ©Sammy
©Sammy ©Buronson & Tetsuo Hara/NSP 1983, Approved ©Sammy
No.KOK-115
© 2010-2013 Koei Tecmo Games Co., Ltd.
©Sammy
- 12 -Entertainment Contents
Business
Sales
Operating Income
Operating Income margin
(JPY Billion) 2019/3 Full Year Results
Sales increased but profits decreased from last fiscal year.
Recorded losses in Digital Games area.
Repeat sales at NA/EU in Packaged Games area
remained steady and support the revenue of the business
2020/3 Full Year Forecasts
Expect the recovery of profits with the optimization of
number of games to develop/operate.
Expect the large increase in sales in Packaged Games
area but the R&D expenses, etc. from launch of new titles
will also incur.
- 13 -Digital Games
Sales
Operating Income
Operating Income margin
(JPY Billion)
2019/3 Full Year Results
Fell significantly below the initial plan while sales increased
from the last fiscal year and loss was recorded
Failed to compensate for the decline in existing titles with
new titles
Recorded loss along with termination of services of
operating titles such as write-down and etc.
Number of new titles launched
Initial plan 12 titles ⇒ Actual 8 titles
2020/3 Full Year Forecasts
Put an effort to improve profitability by adjustment of number of
developed/operating titles, etc.
Running costs will decrease due to recording of loss in the FY
ended March 2019
Transfer resources to profitable areas
Number of new titles to be launched
Plan for FY ending March 2020: 6 titles
- 14 -Digital Games
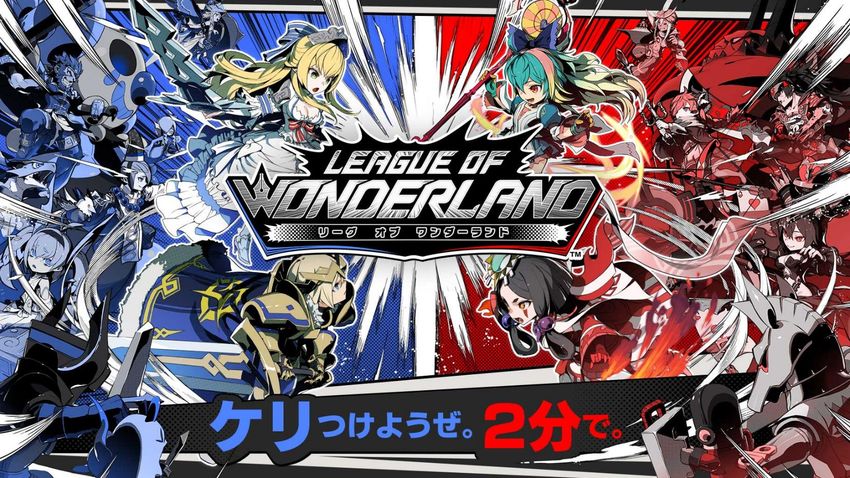
Major titles in 2019/3 Major titles in and after 2020/3
“LEAGUE OF WONDERLAND”
“SEGA Pocket Club Manager”
©SEGA
©SEGA
All Rights Reserved By JFA
The use of images and names of the football players in this game is under license from FIFPro
Commercial Enterprises BV. FIFPro is a regist
“Ryu ga Gotoku ONLINE” “Kemono Friends 3”
©SEGA ©Kemono Friends Project2G ©SEGA - 15 -Packaged Games
Sales
Operating Income
Operating Income margin 2019/3 Full Year Results
(JPY Billion)
Sales decreased while profits increased from last fiscal year
due to solid repeat sales despite the delay in some new
titles.
2020/3 Full Year Forecasts
Expect significant increase of sales due to the launch of
several large new titles of existing IP
Expect decrease of profits due to large R&D cost and
advertising expenses associated with the launch of new titles
and expected decrease of repeat sales
Unit sales of Packaged Games (Thousands unit)
2018/3 2019/3 2020/3
Results Results Forecast
New Titles 8,130 4,090 10,690
Repeat
Titles
9,200 19,350 14,500
Total 17,330 23,440 25,190
- 16 -Packaged Games
Major titles in 2019/3
“Yakuza 6: The Song of Life” “Judgment” “Football Manager 2019”
©SEGA ©SEGA © Sports Interactive Limited 2019.
Published by SEGA Publishing Europe Limited.
- 17 -Packaged Games
“Team Sonic Racing”
©SEGA
“Project Sakura Wars”
“Total War: THREE KINGDOMS” ©SEGA
© SEGA.
Developed by The Creative Assembly Limited.
“Mario & Sonic at the Olympic Games
Tokyo 2020”
TM IOC/TOKYO2020/USOC 36USC220506.
© 2019 IOC. All Rights Reserved.
© NINTENDO. ©SEGA.
- 18 -Amusement Machine Sales
Sales
Operating Income
Operating Income margin
(JPY Billion) 2019/3 Full Year Results
Sales increased but profit decreased from last fiscal year.
Sold several video game and prize machines.
Fate/Grand Order Arcade
UFO CATCHER TRIPLE TWIN
Expenses increased from title of which operation was
suspended and relocation of office.
2020/3 Full Year Forecasts
Plan to launch new series of mainstay title “StarHorse4” in
addition to prize machines which sales has been
performing well.
StarHorse4
maimai DX
Expect decrease in profit due to increase of common fixed
expenses from relocation of headquarter.
- 19 -Amusement Center Operations
Sales
Operating Income
Operating Income margin
(JPY Billion) 2019/3 Full Year Results
Sales increased but profit decreased from last fiscal year.
Recorded solid performance centered on prize areas.
Sales at existing stores exceeded 100% for five
consecutive fiscal years.
2020/3 Full Year Forecasts
Expect profit will be leveling off due to consumption tax
hike while sales increase with opening of new stores
Domestic amusement centers: No. of stores / YoY sales ratio comparison
2018/3 2019/3 2020/3
Results Results Forecasts
No. of stores 189 190 195
YoY Sales Ratio
101.9 104.0 104.4
comparison (%)
- 20 -Animation / Toys
Sales
Operating Income
Operating Income margin
(JPY Billion) 2019/3 Full Year Results
Animation: Recorded the earnings from video distribution
and etc.
Movie version of ”Detective Conan” series etc.
Toys: Sold new products and regular products.
WHOareYOU? etc.
2020/3 Full Year Forecasts
Expect profit will be leveling off due to increase in ratio of
revenue from video creation while sales increase from
launch of new video in animation area and new products in
toy area.
Movie version of ”Detective Conan”
- 21 -Resort Business
Sales
Operating Income (JPY Billion) 2019/3 Full Year Results
Sales increased and volume of losses decreased from
last fiscal year.
Cost incurred for domestic Integrated Resort increased.
Profit of PHOENIX RESORT improved.
2020/3 Full Year Forecasts
Continue efforts to improve profitability of existing
facilities.
Expect the increase of prior investment as the actions
required for participating domestic Integrated Resort
will be activated.
- 22 -PHOENIX RESORT
Sales
Operating Income (JPY Billion)
Operating Income margin 2019/3 Full Year Results
Sales and number of facility users increased as effects
of renovation of facilities and other various promotions.
2020/3 Full Year Forecasts
Continuously implement various promotion activities to
improve profitability.
Implement measures to boost the use of golf and MICE.
- 23 -PARADISE SEGASAMMY
Transition of Drop* amount at Paradise SegaSammy
(Equity method affiliate)
(KRW Million) (KRW Billion)
FY 2018/3 FY 2019/3
Sales 200.5 301.6
Casino 174.9 248.6
Hotel 25.6 50.3
Other - 2.8
Cost of sales 176.0 285.0
Casino 117.9 161.6
Hotel 58.1 99.2
Other - 24.2
Gross profit 24.4 16.6
SG&A 57.2 37.4
Operating profit -32.7 -20.8
EBITDA -6.2 20.0
Net profit -46.8 -53.0
Source: Paradise IR
SEGASAMMY
Equity method acquisition -2.8 -3.1
amount (Billion yen)
* PARADISE SEGASAMMY Co., Ltd. is an equity method affiliate of SEGA SAMMY HOLDINGS INC. *Drop : The amount of cash exchanged for chips
* Figures for PARADISE SEGASAMMY Co., Ltd. are recorded with three months delay by customers at the table
- 24 -Progress of “Road to 2020”
Operating income
Operating income margin
Operating income fell short
(JPY Billion)
of initial plan for two
consecutive fiscal years
(Main factors)
Pachislot and Pachinko
Machines Business
Impact of regulation change
Entertainment Contents
Lack of hit titles mainly in Digital
Games area
- 25 -Pachislot and Pachinko
Machines Business
- 26 -Review of “Road to 2020”
(Pachislot and Pachinko Machine Business)
While not expected to reach initial target due to the
change in business environment, operating income
margin improved significantly
Changes in environment due to regulation change
・Approval ratio declined
・Sales Market stagnated
Execution of measures to improve operating income
margin has been proceeding steadily.
- 27 -Executed measures and outcome for “Road to 2020”
Downside Sales Ratio of Pachislot
declined
Sales units decreased
Increase percentage of reusable
components
Acceleration of commonalization
of components
Upside
Cost reduction
Establishment and launch of 28.1%
ZEEG 24.2%
Brand strategy
Improvement of development
efficiency
Reduction of common fixed
expenses
17.7%
FY 2017/3 FY 2020/3 FY 2020/3
Results Current Forecasts Initial target
(Comparison of operating income margin)
- 28 -Executed measures and outcome for “Road to 2020”
Improvement of operating income margin is progressing steadily
Key measures Outcome
Increase percentage of reusable Products design with reuse in mind
components Number of reusable components expanded (30 to 50)
Common components ratio increased (Pachislot: more than 88%, Pachinko:
Acceleration of commonalization of
more than 52%)
components
Commonalizaton of components between Pachislot and Pachinko proceeded
Cost management enhanced using cost indicators
Cost reduction Cost reduced from transferring outsourced work to insource in debug operation
and careful selection of exclusive items such as devices
Establishment and launch of ZEEG Started the use of ZEEG machines from last fiscal year
Brand strategy Integration into Sammy brand
Shortened development period (not able to achieve initial plan due to the impact
Improvement of development efficiency of regulation change)
Review process enhanced, numbers of developed titles narrowed down
Reduction of common fixed expenses Realized reduction of fixed expenses which exceeds initial forecast significantly.
- 29 -Market trends (transition of installed units/sales units)
Expect increase in sales units of Pachislot along with the removal of previous regulation
machines by expiration of certification
Estimates of Pachislot market Estimates of Pachinko Market
Installed units (Million units) Installed units (Million units)
Sales units Sales units
Turnover ratio Turnover ratio
(Estimates of SEGA SAMMY HOLDINGS)
- 30 -Future demand for replacement
(Market share for new regulation machines: Estimates)
Expiration timing of previous regulations is concentrated on Q3 FY2020/3
Pachislot
Thousand of units
Removal Timing
(Estimates)
1Q (Apr-Jun) Approx. 3
2Q (Jul-Sep) Approx.1
Mar, 2020
3Q (Oct-Dec) Approx. 182
4Q (Jan-Mar) Approx. 9
Mar, 2021 Approx. 1,188
Pachinko
Thousand of units
Removal Timing
(Estimates)
Mar, 2020 Approx. 58
Mar, 2021 Approx. 2,130
(Estimates of SEGA SAMMY HOLDINGS)
- 31 -Future direction of development and launch of titles
Future Objectives
Recovery of approval ratio
・Apply multiple specs for both Pachislot and Pachinko
Develop Pachislot and Pachinko machines
that matches the market trends
・Machines set no. of obtained medals per game at higher range
・Machines with the technique of player can be reflected for pay-out
・Effective use of existing major IPs
- 32 -Events schedule: Full year (Estimate)
FY 2020/3
Apr Mar Jun Jul Aug Sep Oct Nov Dec Jan Feb
Pachislot
and Expiration of End Jan, 2021
Voluntary replacement Voluntary replacement mainstay type 5 Transfer to new reg.
Pachinko control for G20 Summit control for Rugby World machines completes
industry (not yet determined) Cup (not yet determined)
Pachislot Beast King
Oujya no Houkou
Pachislot Plan to release new reg. (type 6) machines in order
Pachislot DISC UP
5th version White Panel
P The Seven deadly Sins Goyoku ver.
Pachinko Pachinko CR Dracure! Plan to release new reg. machines in order
P SHOW BY ROCK‼
※The timing for voluntary replacement control are guesses of SEGA SAMMY HOLDINGS and not yet determined
- 33 -Entertainment Contents
BusinessReview of “Road to 2020” (Digital Games area)
Fell significantly below the initial plan due to deterioration of
business environment and lack of hit titles
External Factors Internal Factors
High ranked major titles become Slowdown of existing mainstay titles
unchanging Lack of hit titles
Increase of existing IP based titles Delay and suspension of new titles
Intensified competition in domestic market
- 35 -Review of “Road to 2020” (Packaged Games area)
Exceeded the initial plan with extension of overseas sales and
repeat sales
External Factors Internal Factors
Expansion of EU, NA, Asia market Increase in overseas sales ratio for the IPs of
Growth of new platformers such as Steam, etc. Japan studios
Stable profit base with the IPs of overseas
studios
Improvement of product quality
(2nd in 2018 Major Publisher rank of Metacritic)
- 36 -Market Trends (Estimation of market in 2020)
Asia
Expanding
Mobile
Asia
Package
NA/EU
Mobile Expansion of
NA/EU
overseas market
Japan Package
Japan
Mobile
NA/EU Stagnation of
domestic
Asia CS/PC Digital
Package
CS/PC Digital
market
Shrinking
Japan
CS/PC Digital
Market Size(M$)
10,000 20,000 30,000
Market size per devises and platforms (2020 (Estimates))
(Source: Referred the worldwide figure using IDG report_Nov.2017 as a base)
- 37 -Reconsider focusing area
Focus our resources to the areas where we can make best use
of strength of the Company within favorable overseas market
When announced From 2020/3
Road to 2020
NA/EU NA/EU
Japan Asia Japan Asia
/Others /Others
Packaged
Packaged Games ● ●
Games
Japan CS/PC Japan CS/PC
Studios Digital Games Studios Digital Games
Mobile Games Mobile Games
● ● ● ● ● ●
Digital Games Digital Games
Packaged
Packaged Games ● ●
Games
Overseas CS/PC Overseas CS/PC
Studios ●
Digital Games Studios Digital Games
Mobile Games Mobile Games
Digital Games Digital Games
- 38 -Measures to recover Digital Games area
Adjust the number of titles to develop and operate
Narrow down the number of new titles to develop
Adjust the number of titles under direct operation
Line-up centered on existing IP titles
Reallocation of resources
Invest the resources to focusing area such as overseas
package and etc.
Proceed the transferring of outsourced work of existing title
to insource
- 39 -Maximizing IP values
Multi region, device and platform roll-out making best use of characteristics of IPs
Plentiful IPs Platforms
Existing IPs Revived IPs
Console (current and next gen)
Steam
Mega Drive mini WeGame
Other idle IPs
Mobile
New IPs External IPs New platforms
Kemono Friends
The Olympic official
license
- 40 -Resort Business
Past initiatives for Resort Business up to the present
                  Preparation for domestic IP participation
  May, 2012
                      2012                          Mar, 2012
                                 Acquired all shares of
  Establishment of “PARADISE                        PHOENIX RESORT
  SEGASAMMY Co., Ltd.”, a
  joint venture with the
  PARADISE GROUP
                                                                       Dec, 2017
              Apr, 2014
                                                                       Acquired gaming machine licenses in Nevada
              Began sending the employees of Sega
              Sammy Holdings to PARADISE SEGA
              SAMMY                                                                Dec, 2017
                                                                                   Joint research of countermeasures for
                          Nov, 2014                                                addiction with Kyoto University
                          Began construction of “PARADISE CITY”,
                          the first integrated resort in South Korea

                                        Apr, 2017
                                                                                                  2019
                                        Opening of “PARADISE CITY”

                                                                                                                           - 42 -
https://www.segasammy.co.jp/english/
Cautionary Statement for Investors and Shareholders with Respect to Nevada Gaming Statutes and Please visit below websites for products and service information.
Regulations https://www.segasammy.co.jp/english/pr/corp/group/list.html
SEGA SAMMY HOLDINGS INC. (“the Company”) is registered with the Nevada Commission as a publicly
(SegaSammy Group Website list)
traded corporation and has been found suitable to directly or indirectly own the stock of SEGA SAMMY
CREATION INC., and Sega Sammy Creation USA, Inc., both of which are subsidiaries that have been
licensed as manufacturers and distributors of gaming devices in Nevada. Pursuant to Nevada law, the * Company / product names in this document are trademarks or
Company’s shareholders are subject to the rules and regulations of the Nevada Gaming Authorities. A registered trademarks of the respective companies.
detailed explanation of Nevada gaming statutes and regulations can be found on the Company’s corporate
website:
https://www.segasammy.co.jp/english/ir/stock/regulation/You can also read