Indiana Economic Forecast Update - Economics and Country Risk - Tom Jackson, Principal Economist, US Regional Economics ...
←
→
Page content transcription
If your browser does not render page correctly, please read the page content below
Economics and Country Risk

Indiana Economic Forecast Update
April 2021

Tom Jackson, Principal Economist, US Regional Economics
Tom.Jackson@ihsmarkit.com

Confidential. © 2021 IHS Markit®. All rights reserved.
Indiana Economic Forecast Update | April 2021

Upward revisions to the forecast as COVID-19 inoculation campaign
accelerates
• Real GDP rose at a 4.3% annual rate in the fourth quarter, according to BEA’s third estimate, 0.2
    percentage point above the second estimate. The recovery through the fourth quarter left the level
    of GDP 2.4% below the peak attained in the fourth quarter of 2019.
• Our forecast of real GDP growth has been revised up from 5.7% to 6.2% in 2021 and from 4.1% to
    4.3% in 2022.
• One factor is the strength in credit/debit card spending through mid-March. In addition, most
    stimulus checks from the American Rescue Plan Act were delivered in March, earlier than we had
    assumed, boosting our estimate of first-quarter real consumer spending growth to 9.2%.
• More important is the acceleration of the vaccination campaign. Recent projections show
    widespread inoculation of the US population by July, and many states are relaxing containment
    measures. This encouraged us to revise up projected growth of real consumer spending on
    services other than housing, utilities, and healthcare to approximately 15% for the year.
• The conditions for Fed “lift-off” are still met by mid-2024. Hence, we have not changed our Fed call
    and still expect the target for the federal funds rate to be raised at that time.
Confidential. © 2021 IHS Markit®. All rights reserved.                                                                             2
Indiana Economic Forecast Update | April 2021

Policy assumptions in the April forecast
• This forecast reflects all pandemic relief measures of 2020 and the recently enacted $1.9 trillion
    American Recovery Plan (ARP). ARP includes:
    • stimulus checks of $1,400

    • extension of emergency unemployment programs through early September including an enhanced
        unemployment benefit of $300/week
    • $350 billion of unrestricted aid to state and local governments

    • $287 billion of support for education, and

    • a range of additional tax credits and outlays for pandemic-affected industries and COVID-19 mitigation
        efforts
• The forecast does not (yet) include the President’s American Jobs Plan which proposes to spend
    $2.1 trillion on social investments paid for over 15 years by higher corporate taxes.
• Strong revenues, reinforced by ARP, limit the usual cyclical state and local fiscal contraction. State
    and local employment rebounds in the fall as schools re-open.

Confidential. © 2021 IHS Markit®. All rights reserved.                                                                                 3
Indiana Economic Forecast Update | April 2021
Indiana economy began its rebound from pandemic lows relatively quickly,
but full recovery will take more time
• Indiana had a relatively modest initial COVID-19 outbreak, allowing an early reopening.
• Many office workers were able to switch to full-time remote work
• “Essential” workers remained on the job as much as feasible amid outbreaks
• Shutdown of air travel, business travel, most sports and entertainment venues very costly
• Manufacturing has recovered much more quickly than from most downturns.
• Manufacturers reopened after a two-month break.
• Stimulus checks, limited income losses for many workers, and drop in leisure spending boosted demand for
durable goods, including motor vehicles.
• Supply chain bottlenecks and shortages of some components are a threat to production gains
• Job recovery has resumed after a slowdown, but lower-wage service jobs will be difficult to restore
or replace.
• State payroll employment will return to pre-pandemic peak by late 2022; real GDP returned to
peak in early 2021.
Confidential. © 2021 IHS Markit®. All rights reserved. 4Indiana Economic Forecast Update | April 2021
Changes to April forecast from December
• Federal fiscal stimulus much higher than we had assumed in December
• Added fiscal stimulus plus gains in reopening economy boost most major indicators
• Real GDP, personal income, consumer spending, business fixed investment, all higher in April
• Revisions to 2020CY Indiana data were mostly minor
• Downward revision to payroll employment (mostly in leisure and hospitality) offset by higher average wages
• Transfer payments to individuals were much higher in 2020Q4 thanks to addition of $600 stimulus checks
• Indiana wages, personal income, consumer spending now higher along with national forecast
• Consumer spending boosts demand for manufactured goods, an Indiana strong point
• Service sector will see faster growth as long as COVID-19 cases remain relatively subdued
Confidential. © 2021 IHS Markit®. All rights reserved. 5Indiana Economic Forecast Update | April 2021
Freight transportation jobs rolling along, while leisure and hospitality
remains well below year-ago
Change in Indiana payroll employment, Feb 2020 - Feb 2021
Transport & warehousing
Retail trade
Utilities & mining
Federal government Net change = -138,000 (-4.4%)
Information
Financial services
Wholesale trade
Construction
Education
Prof. & business services
Manufacturing
Health & social services
Other services
State & local govt.
Leisure & hospitality
-45 -40 -35 -30 -25 -20 -15 -10 -5 0 5 10
Thousand
Source: IHS Markit © 2021 IHS Markit
Confidential. © 2021 IHS Markit®. All rights reserved. 6Indiana Economic Forecast Update | April 2021
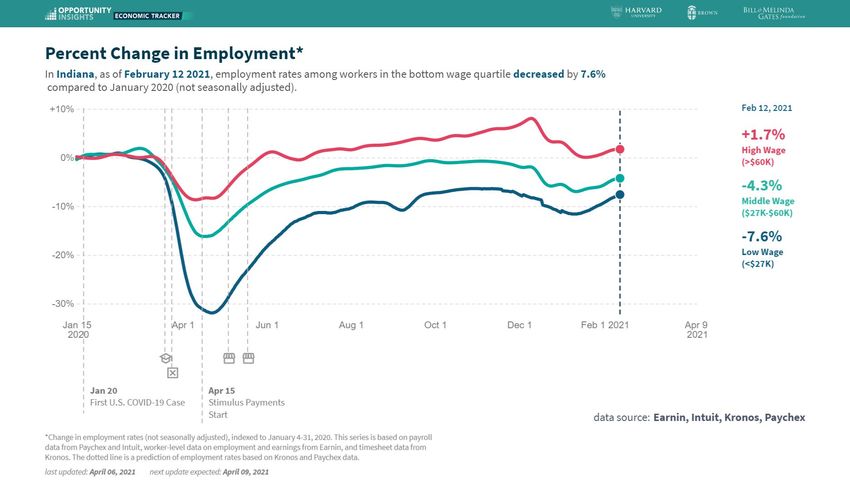
Disproportionate losses of low-wage jobs skewed average wage gains much
higher than normal in 2020
Indiana wage growth
65 6%
60 5%
55 4%
Thousand dollars
% change
50 3%
45 2%
40 1%
35 0%
30 -1%
2015 2016 2017 2018 2019 2020 2021 2022 2023 2024
Average annual wage (left axis) Quarterly growth (right axis)
Source: IHS Markit © 2021 IHS Markit
Confidential. © 2021 IHS Markit®. All rights reserved. 7Indiana Economic Forecast Update | April 2021 What the “K-shaped recovery” means in terms of jobs Confidential. © 2021 IHS Markit®. All rights reserved. 8
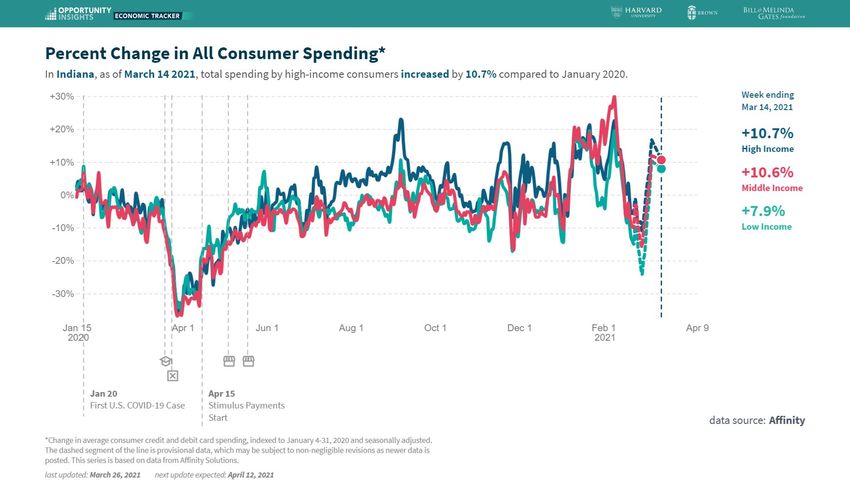
Indiana Economic Forecast Update | April 2021

Fiscal stimulus payments have supported consumer card spending

Confidential. © 2021 IHS Markit®. All rights reserved.                                              9
Indiana Economic Forecast Update | April 2021

Key economic indicators for Indiana

                                                         2019    2020    2021     2022                          2023
  Units: Percent change

  Payroll employment                                       0.7    -5.5     3.6          2.0                           0.6
  Unemployment rate (%)                                    3.2     7.2     3.9          3.5                           3.2
  Wage income                                              3.3     0.0     8.4          4.0                           3.6
  Personal income                                          3.4     5.8     7.4         -0.5                           3.5
  Real gross state product                                 1.6    -3.1     7.5          3.0                           1.2
  Personal consumption exp.                                3.3    -2.0     9.3          5.7                           4.2
• Personal income boosted by Federal stimulus/extra unemployment payments, rebound in wage
  disbursements in 2021; absence of stimulus checks shows in 2022
• PCEs boosted by stimulus checks and pent-up demand from 2020

Confidential. © 2021 IHS Markit®. All rights reserved.                                                                     10
Indiana Economic Forecast Update | April 2021
Spending on services, including health care, dropped sharply in last spring,
but will regain share as economy gets back to normal
Personal consumption expenditures by category, Indiana
400
350
300
250
Billion dollars
200
150
100
50
0
2012 2014 2016 2018 2020 2022 2024
Health care services Services ex. Health care Non-durable goods Durable goods
Source: IHS Markit © 2021 IHS Markit
Confidential. © 2021 IHS Markit®. All rights reserved. 11Indiana Economic Forecast Update | April 2021
U.S. auto sales stalled initially but accelerated quickly by summer
Total U.S. light-vehicle sales
20
Millions of units, annual rate
15
10
5
0
1980 1985 1990 1995 2000 2005 2010 2015 2020 2025 2030
Total Light trucks Cars
Source: IHS Markit © 2021 IHS Markit
Confidential. © 2021 IHS Markit®. All rights reserved. 12Indiana Economic Forecast Update | April 2021
Bottom line for Indiana
• The fate of the recovery depends partly on avoiding another “surge” in virus cases, both within the
state and nationally
• Return to in-person education will help on multiple fronts, including boosting labor supply
• Portions of leisure and hospitality will return quickly, while business and international travel remain slow
• A return to offices on at least a part-time basis is very important to businesses in downtowns of all sizes
• Outlook for manufacturing output and employment remains solid
• Demand for goods supported by robust personal income
• Supply chain issues causing sporadic problems, while input costs rise rapidly
• Reconfigured supply chains (re-shoring) could provide opportunity, but too early to tell
• Reckoning with financial fallout from lagging payments for mortgages, rents, credit cards, other
debts is another hurdle to avoid lingering economic effects
• Recent burst of homebuilding will moderate by late 2021, but will remain at elevated levels
• Longer-term fundamentals remain the same – labor force must continue to grow in size and skill
level to allow existing business to expand and to attract new business
Confidential. © 2021 IHS Markit®. All rights reserved. 1314
Evolution of short-term Indiana forecast
U.S. GDP Indiana employment Indiana income
Forecast 2020 2021 2020 2021 2020 2021
date
Apr 2019 2.1 1.9 0.4 0.0 4.1 4.0
Dec 2019 2.1 2.0 0.5 0.3 3.4 3.8
Apr 2020 -5.4 6.3 -5.7 -1.4 1.8 2.6
Dec 2020 -3.4 4.3 -4.4 -2.5 6.0 0.6
Apr 2021 -3.5 6.2 -5.5 3.6 5.8 7.4
Units: Percent change
Source: IHS Markit © 2021 IHS Markit
Confidential. © 2021 IHS Markit®. All rights reserved.Indiana Economic Forecast Update | April 2021 US macro outlook – supplemental information Confidential. © 2021 IHS Markit®. All rights reserved. 15
Indiana Economic Forecast Update | April 2021

US economic growth by sector

  Percent change                                         2020    2021       2022                          2023
  Real GDP                                                -3.5    6.2        4.3                           2.2
  Final sales                                             -2.9    5.4           3.9                           2.5
  Consumption                                             -3.9    7.0           4.7                           2.8
  Light vehicle sales (Millions)                         14.4    16.4         16.5                         16.3
  Residential fixed investment                            6.1    11.7          -5.5                         -4.7
  Housing starts (Millions)                              1.40    1.55         1.39                         1.27
  Business fixed investment                               -4.0    7.3           6.6                           4.4
  Federal government                                      4.3     2.7          -2.1                         -0.8
  Exports                                                -12.9    6.3           7.6                           5.4
  Imports                                                 -9.3   14.4           4.9                           2.9
 Source: IHS Markit                                                                          © 2021 IHS Markit

Confidential. © 2021 IHS Markit®. All rights reserved.                                                            16
Indiana Economic Forecast Update | April 2021

Other key US indicators

 Key indicators
 Percent change                                          2020    2021    2022                             2023
  Industrial production                                   -6.7    6.5     4.4                              2.2
  Payroll employment                                      -5.7    3.1     3.1                              1.5
  Consumer Price Index                                     1.2    2.4     1.5                              1.8
  Core CPI                                                 1.7    1.7     2.0                              2.2
  Brent crude oil price (USD/barrel)                     41.8    65.9    63.5                             61.7
  Federal funds rate (%)                                 0.38    0.07    0.08                             0.10
  10-year Treasury yield (%)                             0.89    1.64    1.92                             2.02
 Source: IHS Markit                                                                          © 2021 IHS Markit

Confidential. © 2021 IHS Markit®. All rights reserved.                                                            17
Indiana Economic Forecast Update | April 2021

American Jobs Program

• President Biden’s American Jobs Program (AJP) is not reflected in this forecast. However, we offer
    some preliminary observations:
• The media refers to AJP as an “infrastructure bill”, but less than a third of the spending ($621
    billion) is for transportation projects conventionally considered infrastructure investments. Even
    within that $621 billon, $174 billion is in “unconventional” support of electric vehicles.
• Otherwise, AJO allocates $590 billion to domestic manufacturing, R&D, and job training; $400
    billion to expanding home care services and supporting care workers; $328 billion to improving
    housing, schools, childcare facilities and VA hospitals; and $311 to improving broadband access,
    upgrading the electrical grid, and purifying drinking water.
• Our initial estimates suggest that the ramp up in spending could raise GDP growth by between 0.2
    and 0.4 percentage point for several years—enough to lift the level of GDP about 1% above our
    baseline forecast by 2024 and push the unemployment rate below 3%—before the effects reverse.

Confidential. © 2021 IHS Markit®. All rights reserved.                                                                          18
Indiana Economic Forecast Update | April 2021
Big losses for services, but astonishing goods spending
Real consumer spending
15
10
Percent change
5
0
-5
-10
2005 2007 2009 2011 2013 2015 2017 2019 2021 2023 2025
Durable goods Nondurable goods Services
Source: IHS Markit © 2021 IHS Markit
Confidential. © 2021 IHS Markit®. All rights reserved. 19Indiana Economic Forecast Update | April 2021
Retail gasoline prices reflect changes in crude oil prices
Retail gasoline price and annualized spending on motor fuels
4 4
Thousand USD/household
3 3
USD/gallon
2 2
1 1
2000 2004 2008 2012 2016 2020 2024
Retail gasoline price Spending on motor fuels per household (right scale)
Source: IHS Markit © 2021 IHS Markit
Confidential. © 2021 IHS Markit®. All rights reserved. 20Indiana Economic Forecast Update | April 2021
The housing market is hot, but headwinds are blowing
• The housing market remains strong but is cooling. New and existing home sales, housing starts,
and housing permits all declined in February. Forward-looking indicators—pending home sales,
builder sentiment, and mortgage applications to buy homes—are slipping.
• The cooling is in line with expectations. Hence, our forecast for housing starts is essentially
unchanged in April.
• Housing starts peak in the first half at a 1.6 million annual rate, and then over a two-year period
move down to a level determined by population growth (1.2-1.3 million annually).
• With inventory at an all-time low and shrinking, home prices will sizzle in the first half of this year;
home price growth will eventually slow as prospective homeowners are priced out of the market.
• Forbearances remain a risk. On 28 March, 4.96% (or 2.5 million) of mortgage loans were in
forbearance plans, up from 0.25% in early March.
Confidential. © 2021 IHS Markit®. All rights reserved. 21Indiana Economic Forecast Update | April 2021
Risks to the US forecast
Scenario Characteristics
Pessimistic: Recovery • Amid a fourth wave of COVID-19 infections, including more contagious strains of the virus, consumers turn cautious
until the vaccines are more widely available in the summer. Re-introduced containment measures accompany this
stumbles as
caution.
consumers hunker • The unemployment rate declines at a gradual pace, not falling below 5.0% until mid-2022. The previous peak in GDP
down amid fourth is passed in the fourth quarter this year, two quarters later than in the baseline.
wave • Same fiscal assumptions as the baseline, but we assume that consumers are more reluctant to spend their stimulus
(Probability = 25%) checks and instead save most of the additional income.
Optimistic: Easing • The daily number of new cases dwindles quickly, allowing business restrictions to relax and consumer spending to
approach pre-pandemic patterns earlier than assumed in the baseline.
containment
• The vaccination timeline continues to accelerate, resulting in the population effectively reaching herd immunity by
measures, late spring rather than summer.
accelerating • The previous peak in GDP is passed in the second quarter of 2021, the same as in the baseline. The unemployment
vaccinations and still rate falls below 4.0% by the end of this year.
more stimulus drive • The Fed begins to raise the federal funds rate in mid-2022, two years earlier than in the baseline forecast.
• Same fiscal assumptions as the baseline, but we assume the aid is more front-loaded and the consumer response
faster recovery more robust than in the baseline.
(Probability = 25%)
• COVID-19 cases plateau around their current level, while the vaccination campaign continues apace and results in
moderately looser containment measures and a gradual recovery in consumer spending.
Baseline forecast
• Real GDP crosses its previous peak in the second quarter of 2021. The federal funds rate is held near zero until mid-
(Probability = 50%) 2024 as the Fed encourages a slight inflation overshoot.
• Fiscal stimulus totaling $1.9 trillion, including another round of stimulus checks, extensions to unemployment
programs, COVID-19 mitigation, and aid to state and local governments.
Confidential. © 2021 IHS Markit®. All rights reserved. 22Indiana Economic Forecast Update | April 2021
Bottom line for the US economy
• Our forecasts of year-over-year real GDP growth for 2021-22 have been revised up, from 5.7%
and 4.1%, to 6.2% and 4.3%, respectively.
• This forecast incorporates the $1.9 trillion American Rescue Plan (ARP) Act passed in March.
• Given its uncertain political prospects, we have not (yet) included the American Jobs Plan (AJP) in
our base projections. The AJP includes spending of $2.1 trillion on social investments, paid for
over 15 years with higher corporate taxes. The AJP could boost GDP growth by 0.3–0.4
percentage point from 2022 through 2024.
• In this forecast, quarterly real GDP surpasses its previous peak in the second quarter, while
monthly real GDP passes its previous peak in May of 2021; the output gap is eliminated by mid-
2022.
• Core PCE inflation reaches 2% in mid-2023.
• We have not changed our Fed call. The conditions for Fed “lift-off” are still met by mid-2024.
Confidential. © 2021 IHS Markit®. All rights reserved. 23IHS Markit Customer Care
CustomerCare@ihsmarkit.com
Americas: +1 800 IHS CARE (+1 800 447 2273)
Europe, Middle East, and Africa: +44 (0) 1344 328 300
Asia and the Pacific Rim: +604 291 3600
Disclaimer
The information contained in this presentation is confidential. Any unauthorized use, disclosure, reproduction, or dissemination, in full or in part, in any media or by any means, without the prior written permission of IHS Markit or any of its affiliates ("IHS Markit") is strictly
prohibited. IHS Markit owns all IHS Markit logos and trade names contained in this presentation that are subject to license. Opinions, statements, estimates, and projections in this presentation (including other media) are solely those of the individual author(s) at the time of
writing and do not necessarily reflect the opinions of IHS Markit. Neither IHS Markit nor the author(s) has any obligation to update this presentation in the event that any content, opinion, statement, estimate, or projection (collectively, "information") changes or subsequently
becomes inaccurate. IHS Markit makes no warranty, expressed or implied, as to the accuracy, completeness, or timeliness of any information in this presentation, and shall not in any way be liable to any recipient for any inaccuracies or omissions. Without limiting the
foregoing, IHS Markit shall have no liability whatsoever to any recipient, whether in contract, in tort (including negligence), under warranty, under statute or otherwise, in respect of any loss or damage suffered by any recipient as a result of or in connection with any
information provided, or any course of action determined, by it or any third party, whether or not based on any information provided. The inclusion of a link to an external website by IHS Markit should not be understood to be an endorsement of that website or the site's
owners (or their products/services). IHS Markit is not responsible for either the content or output of external websites. Copyright © 2021, IHS Markit®. All rights reserved and all intellectual property rights are retained by IHS Markit.You can also read