Personal and economic well-being in Great Britain: January 2021 - Office for ...
←
→
Page content transcription
If your browser does not render page correctly, please read the page content below
Statistical bulletin

Personal and economic well-being in Great
Britain: January 2021
Estimates looking across multiple sources for personal and economic well-being to
understand the impact of the coronavirus (COVID-19) pandemic on people and
households in Great Britain. Covers the period from March 2020 to December 2020.

Contact:                      Release date:                           Next release:
Bella Beynon and Gueorguie    21 January 2021                         To be announced
Vassilev
PeopleAndProsperity@ons.gov.
uk
+44 (0)1633455330 +44 (0)1633
456265                             Notice
                                   21 January 2021
Associated data for this statistical bulletin shows total population estimates produced from the Opinions and
Lifestyle survey and from the Survey of Living conditions. Additional splits of the from the Opinions and Lifestyle
Survey data providing comparable estimates for demographics and personal characteristics, such as age groups,
income groups, parental statuses and others, will be released following this publication on 25 January 2020.

                                                                                                              Page 1 of 18
Table of contents
1. Main points
2. Work and income
3. Savings, borrowing and affordability
4. Personal well-being and expectations for the future
5. Personal and economic well-being data
6. Glossary
7. Measuring the data
8. Strengths and limitations
9. Related links
Page 2 of 181 . Main points
The labour market shocks associated with the coronavirus (COVID-19) pandemic have been felt more by
young people and the lowest paid; people aged under 30 years and those with household incomes under
£10,000 were around 35% and 60%, respectively, more likely to be furloughed than the general population.
Of those who have not been able to work (either because of being on furlough or for another reason), over
half (52%) of people in the top income quintile continued to be paid in full, while this was the case for only
28% of those in the lowest income quintile.
People with a job or seeking work were more likely to have decreased income during the pandemic, and
particularly the poorest 20%, while others such as retired people out of the labour market were more
protected.
Throughout the pandemic, employed parents were almost twice as likely to report a reduction in income
than the general employed population, although this gap gradually narrowed throughout 2020 as schools
reopened.
Self-employed people were more likely to report reduced working hours and reduced income, even if they
had received support from the Self-Employment Income Support Scheme (SEISS).
By December 2020, nearly 9 million people had to borrow more money because of the coronavirus
pandemic; the proportion borrowing £1,000 or more also increased from 35% to 45% since June 2020.
Impacts to household spending have been felt differently across groups, with parents less able to afford
either a holiday or an unexpected but necessary expense than non-parents; they were also roughly 50%
more likely to have difficulty meeting their usual expenses.
2 . Work and income
In 2020, the coronavirus (COVID-19) impacted people across all sections of society.
The number of people reporting that they had been furloughed steadily reduced over the summer months, but
this proportion started to increase again in November 2020, to coincide with further restrictions across certain
parts of the country. Young people and those on the lowest incomes were most likely to be impacted in this
second phase of restrictions, as they were in the first lockdown, with a six-fold increase in those aged under 30
years reporting that they had been furloughed. This increased from 2.1% for the five days to 1 November 2020 to
12.3% a week later.
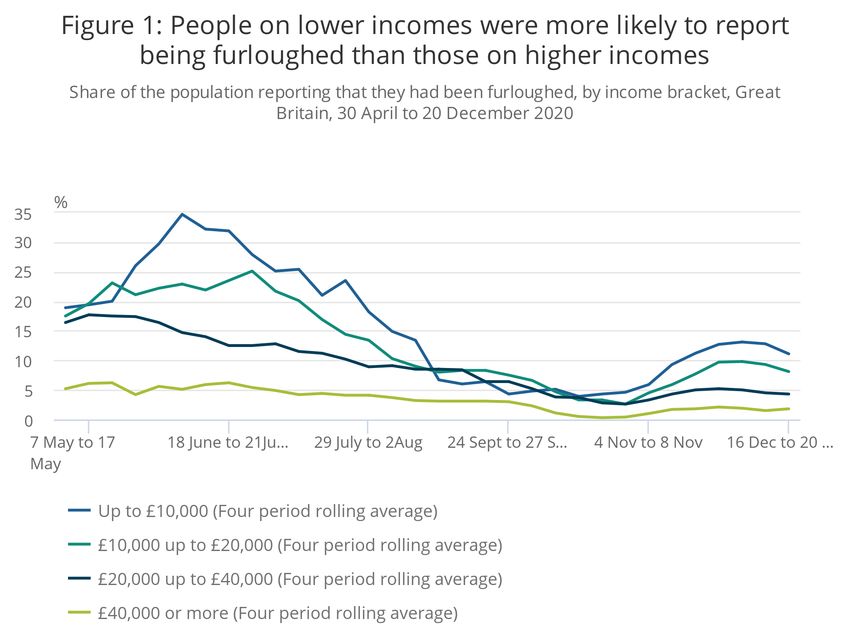
Page 3 of 18Figure 1: People on lower incomes were more likely to report being furloughed than those on higher
incomes
Share of the population reporting that they had been furloughed, by income bracket, Great Britain, 30 April to 20 December
2020
Source: Office for National Statistics – Opinions and Lifestyle Survey
Notes:
1. Responses to the question "In the past seven days, how have your household finances been affected?".
2. Share of respondents who responded "I have been furloughed". This is a self-reported figure, Her
Majesty's Revenue and Customs (HMRC) publish official Coronavirus Job Retention Scheme statistics
Coronavirus Job Retention Scheme.
3. Four-period rolling average has been calculated.
Those on the lowest incomes were also more likely to be furloughed during 2020. Between 11 and 15 November
2020, when restrictions were tightened in some areas of the country, 17% of people with a household income
less than £10,000 reported that they had been furloughed. In comparison, only 2.7% of people with a household
income of more than £40,000 reported this.
Similarly, those in high-income groups reported that they were more likely to be able to work from home, with
55.1% of people with income over £20,000 able to work from home compared with 19.1% of people with income
less than £20,000.
The Coronavirus Job Retention Scheme allowed employers to “top-up” the earnings of those who were on
furlough, and data from the Survey of Living Conditions suggests that this was less likely to happen for those on
lower incomes.
Page 4 of 18Figure 2: People on higher incomes were more likely to be paid in full if they were unable to work,
compared with those on lower incomes
Percentage of people responding to whether they were still being paid while their work was on hold, by income quintile band
for financial year ending 2020, Great Britain, May 2020 to October 2020
Source: Office for National Statistics – Survey of Living Conditions
Notes:
1. Responses to the question “Over the past week, are you still being paid whilst your job is on hold/affected
by coronavirus (COVID-19)?”.
2. Base population: Those people who were employed and stated that they were unable to do any work over
the past week.
3. Individuals are ranked by their equivalised household disposable income for financial year ending 2020,
using the modified OECD scale.
4. Please see glossary definition of income quintiles.
Of those whose work was affected by the coronavirus at any point in the pandemic, people who were in the
bottom quintile of the income distribution (as measured by their income in the same period of the previous year)
were much more likely to be paid in part (60.9%) than in full (27.8%). By contrast, over half (52%) of people in the
top quintile of the income distribution were paid in full.
Page 5 of 18Figure 3: Those in the lowest part of the income distribution who were working or unemployed were more
likely to report reduced household income
Percentage of economically active population reporting on whether household income has changed, split by income quintile
band for financial year ending 2020, Great Britain, April 2020 to October 2020
Source: Office for National Statistics – Survey of Living Conditions
Notes:
1. Responses to the question “Has your household income changed at all since the start of the coronavirus
outbreak in the UK?”.
2. Individuals are ranked by their equivalised household disposable income for financial year ending 2020,
using the modified OECD scale.
3. Please see glossary definition of income quintiles
For those working or unemployed (classed as economically active), those in poorer households were more likely
to report reduced income, as well as being more likely to be furloughed and paid in part if this were to occur. The
proportion of economically active people who reported reduced income was 43.8% among those in the lowest
income quintile, which compares with only 30.4% of those in the top income quintile.
However, in the economically inactive population, the proportion of people reporting reduced income was much
smaller at approximately 13% across all income quintiles. This group tends to receive most of their income from
pensions, property income (for example, rental income) or benefits, and are therefore less likely to be impacted
by disruptions to the labour market. Even when constrained to people of working age, the proportion reporting
reduced income was equal across the quintiles.
Page 6 of 18There were substantial differences across age groups in the proportion of employed people reporting lower
income. Among those aged 16 to 30 years, 12.3% with a job reported reduced income over the period 16 to 20
December 2020, with the figure much higher for those aged 30 to 59 years at 17.9%, while only 6.5% of those
aged over 60 years reported this. These differences across age groups have remained stable since the pandemic
began.
Figure 4: Comparing the end of 2020 with the first lockdown, fewer employed parents reported reduced
income
Share of the employed population reporting a reduced household income, split by parental status, Great Britain, 3 April 2020 to
20 December 2020
Source: Office for National Statistics – Opinions and Lifestyle Survey
Notes:
1. Responses to the question "In the past seven days, how have your household finances been affected?".
2. Share of respondents who responded "I have reduced income".
3. Four-period rolling average has been calculated.
4. See glossary definition of parents.
In addition, a greater proportion of employed parents with children in the home also reported reduced income
throughout 2020. At the start of the pandemic, parents in work were more than twice as likely to report reduced
income than non-parents in work (31.7% and 15.1% respectively). This decreased over the course of the
pandemic, with only 17.1% of parents reporting reduced income in the five days to 20 December 2020, compared
with 12% of non-parents reporting this over the same period.
Page 7 of 18Self-employed people were more likely to report reduced hours and income compared with the employee
population. In December 2020, the self-employed were around 5.5 times more likely to report reduced hours than
employees, up from the first lockdown where they were between two and four times more likely.
Almost one-quarter (24.2%) of self-employed people had received support from the Self-Employment Income
Support Scheme (SEISS) up to October 2020. In comparison, 17.6% of employees were receiving or had at some
point received support from the Coronavirus Job Retention Scheme (CJRS).
Figure 5: Those accessing the Self-employment Income Support Scheme were more likely to report
reduced income compared with those on the employee job retention scheme
Share of employees and self-employed who reported that their household income had decreased or stayed the same, and
whether they received support from the SEISS or CJRS, Great Britain, May 2020 to October 2020
Source: Office for National Statistics – Survey of Living Conditions
Notes:
1. Responses to the questions “Has your household income changed at all since the start of the coronavirus
outbreak in the UK?” and "Are you at present receiving (or have you received at any point) support from
any of the following schemes?".
2. People on a scheme refers to people on CJRS for employees and people on SEISS for the self-employed.
3. Base population: Those people who were economically active and stated that their main job was as an
employee or self-employment.
The self-employed accessing the SEISS were more likely to report reduced income compared with those on the
CJRS. This may be a result of employers having the ability to “top-up” wages above the government’s
contribution, while SEISS payments were based on a proportion of average historical trading profit.
Page 8 of 183 . Savings, borrowing and affordability
Over the course of 2020, there was an increase in the number of people borrowing more money, and in larger
amounts. This coincided with a decrease in people being able to save for the year ahead, with lower income
groups, self-employed and people who rent accommodation most affected.
Figure 6: By December 2020, nearly 9 million people had to borrow more money than usual, with the
proportion borrowing £1,000 or more increasing since June 2020
Number of people reporting that they had to borrow more because of the coronavirus, and share of those borrowing under and
over £1,000, Great Britain, 25 June 2020 to 6 December 2020
Source: Office for National Statistics – Opinions and Lifestyle Survey
Notes:
1. Responses to the question "Have you had to borrow more money or use more credit than usual since the
coronavirus outbreak? (Borrowing or using credit includes credit cards, overdrafts, or taking out loans,
borrowing from friends, family, neighbours or other personal connections.)” and “How much more money
have you borrowed or spent using credit since the coronavirus (COVID-19) outbreak?”.
2. Share of respondents who responded "Less than £1,000", “More than £1,000”, “Don’t know” and “Don’t
know/Prefer not to say”.
At the end of June 2020, 10.8% of adults reported borrowing money, rising to 17.4% in December 2020. Of
those, the proportion borrowing more than £1,000 increased from 34.7% to 45.1% in the same period.
Page 9 of 18Self-employed people were more likely to borrow more than £1,000 than employees in early December 2020
(60.9% versus 49.4% of those who borrowed), and there was a large increase in the proportion of disabled
individuals borrowing more than £1,000 (rising from 12.8% to 36.2% of all that borrowed since June).
As the pandemic progressed, increasing proportions of people reported that they would not be able to save for
the year ahead. At the end of March 2020, 31.6% of people said they would be unable to save, increasing to
38.4% in mid-December 2020.
Groups that found it harder to save included those on incomes below £20,000, self-employed individuals and
people living in rented accommodation (Table 1). Conversely, the under-30 age group consistently reported being
more likely to be able to save than other age groups.
Table 1: Fewer people were able to save for the year ahead, and some groups were disproportionately affected
Proportion of people reporting that they would be able to save for the year ahead, Great Britain, March 2020 to
December 2020
Beginning of Average over the
Groups December
pandemic period
Total population 40.6% 41.2% 38.2%
Household income below 37.9% 30.4% 30.3%
£20,000
Household income above 51.2% 60.1% 53.1%
£20,000
Self-employed 24.3% 28.5% 29.8%
Employees 44.8% 49.3% 44.8%
Living in rented 34.7% 30.1% 25.5%
accommodation
Homeowner with a mortgage 44.2% 48.9% 43.6%
Homeowner (owned outright) 42.6% 44.4% 42.1%
Under 30 age group 57.5% 45.5% 38.5%
30-59 age group 36.6% 40.6% 35.9%
60 and over age group 35.8% 39.4% 35.4%
Source: Office for National Statistics – Opinions and Lifestyle Survey
Notes
1. Responses answering “Yes” to the question “In view of the general economic situation, do you think you
will be able to save any money in the next twelve months?”.
2. Other options were “No” and “Prefer not to say”.
3. The "Beginning of the Pandemic" refers to the period 27 March 2020 to 6 April 2020, "December" refers to
the period 16 to 20 December 2020.
4. Household incomes below £20,000 were calculated as a simple average of those in household incomes up
to £10,000, and between £10,000 and £20,000, and similarly for those above £20,000, it is a simple
average of those between £20,000 to £40,000 and those above that amount.
5. Average over the period is calculated as a simple average from 27 March to 20 December 2020.
Page 10 of 18Despite the need to borrow more and save less, the proportion of individuals who were unable to afford an
unexpected but necessary expense of £850 remained stable throughout the pandemic period, with a weekly
average of 31% from 9 April to 20 December 2020.
However, some groups found it easier to afford an unexpected expense than others. From April to October 2020,
individuals aged under 30 years were less likely to report being able to afford an unexpected expense (62.9%)
than individuals aged 30 to 59 years (72.5%) or those aged 60 years and over (80.7%). Similarly, parents were
less able to afford an unexpected expense (62.8%) than non-parents (79.7%).
These differences could also be observed when respondents were asked if their household could afford a week’s
annual holiday away from home, with younger individuals and parents (70.2% and 71.9% respectively) less able
to afford a holiday than older individuals and non-parents (81.7% and 82.1% respectively).
The ease with which individuals have been able to pay their usual expenses has also differed over the course of
the pandemic. From April to October 2020, 27.3% of people had some degree of difficulty paying their usual
expenses.
The most influenced groups of the population included individuals aged under 30 years who were more likely to
report having difficulty meeting their expenses (34%) compared with those aged 30 to 59 years (26.5%) or aged
60 years and over (24.3%). Parents were also more likely to have difficulty meeting their expenses (34.8%) than
non-parents (20.7%).
4 . Personal well-being and expectations for the future
Since the initial lockdown at the end of March 2020, levels of both anxiety and happiness have seen substantial
and significant improvement. Looking at the week ending 30 March, the mean rating for anxiety was 5.18 out of
10. By the period of 7 to 11 October this had fallen by 30.5% to 3.97. The improvement in happiness was smaller
but still significant, with the mean average increasing by 8.9% from 6.36 in the week ending 30 March to 6.98 in
the same period of 7 to 11 October. Expectations about when life would return to normal fluctuated as the
pandemic progressed, with more people hopeful that life would return to normal sooner rather than later at the
end of the year, and more people increasingly optimistic about their own household finances.
Despite the improvement to levels of happiness and anxiety, they remain significantly worsened compared with
pre-pandemic levels. Similarly, mean ratings of life satisfaction and feeling that things done in life are worthwhile
remain subdued, particularly for those who reported feeling lonely always or often. For this group, the mean rating
of life satisfaction was 3.83 out of 10 in the period of 16 to 20 December 2020, which was 46.5% lower than the
overall UK average of 7.16 for the same period.
Previous analysis identified that in the early stages of lockdown, anxiety was significantly higher for women than it
was for men. However, in the subsequent weeks, the gap between the sexes narrowed, such that by the week
ending 10 May, the gap was no longer significant. For context, prior to lockdown, anxiety was usually higher for
women than men. While men and women reported similar levels of life satisfaction early in the pandemic, in the
period of 28 October to 1 November, women reported significantly lower life satisfaction than men. The mean
rating of 6.34 for women was 5.8% lower than the mean of 6.71 for men. Average levels of personal well-being
across different demographic groups are shown in our associated datasets.
On 4 February 2021, quarterly estimates of personal well-being will be published using data from the Annual
Population Survey (APS). There will be an article published on the same day that considers the impact that the
pandemic has had on data collection, to what extent this has influenced estimates of personal well-being and
reviews the comparability between estimates from the OPN and the APS.
In terms of future expectations, fewer people thought that life would either never return to normal, or would take
more than a year to do so, from 44.4% of the population for the five days to 25 October 2020 to 26.7% for 16 to
20 December 2020.
Page 11 of 18Although most people continue to believe that the general economic situation will get worse, this proportion has
also fallen, from 85.3% at the start of November 2020 to 68.4% in early December 2020. In addition, people are
becoming more optimistic when asked on the prospects for their personal household financial situation. The
number of people who expect the financial position of their household to get better over the next 12 months
increased from 11.0% in April 2020 to 21.5% at the end of December 2020.
Optimism levels were different depending on an individuals’ employment status and age group. For example, self-
employed people were 37.5% more likely to expect their household financial situation to get worse, compared
with employees, throughout the pandemic. Despite being more likely to have been furloughed recently, those
aged under 30 years were the least likely to expect their household finances to get worse throughout the
pandemic.
Figure 7: People's perspectives on their personal household financial situation have improved slightly
since summer
Proportion of respondents who thought their personal household financial situation would get better, stay the same or get
worse, Great Britain, 27 March 2020 to 6 December 2020
Source: Office for National Statistics – Opinions and Lifestyle Survey
Notes:
1. Responses to the question: “How do you expect the financial position of your household to change over the
next 12 months?”.
2. Share of respondents who responded: "Get Better", "Stay the Same" and "Get Worse".
Page 12 of 185 . Personal and economic well-being data
Total population estimates on personal and economic well-being across time
Dataset | 21 January 2021
Total population estimates on personal and economic well-being across time according to the Opinions and
Lifestyle Survey.
Economic well-being estimates from the Survey of Living Conditions, Great Britain
Dataset | 21 January 2021
Estimates of how the coronavirus (COVID-19) has impacted income and affordability in Great Britain. Data
are from the Survey of Living Conditions (SLC).
Income group split estimates on personal and economic well-being across time
Dataset | 25 January 2021
Income group split estimates on personal and economic well-being across time according to the Opinions
and Lifestyle Survey.
Parental split estimates on personal and economic well-being across time
Dataset | 25 January 2021
Parental split estimates on personal and economic well-being across time according to the Opinions and
Lifestyle Survey.
Age group split estimates on personal and economic well-being across time
Dataset | 25 January 2021
Age group split estimates on personal and economic well-being across time according to the Opinions and
Lifestyle Survey.
6 . Glossary
Coronavirus Job Retention Scheme (CJRS)
The Coronavirus Job Retention Scheme, also known as the furlough scheme, provides support to employees by
providing 80% of their current salary for hours that they are unable to work because of the coronavirus (COVID-
19).
Economic activity
The economically active includes those who are unemployed and employed (including furloughed workers, those
on maternity or paternity leave and annual or sick leave). Unemployment measures people without a job who
have been actively seeking work within the last four weeks and are available to start work within the next two
weeks.
The economically inactive refers to people who are not in the labour force as they have not been seeking work
within the last four weeks and/or they are unable to start work in the next two weeks.
Economic well-being
Our economic well-being measures present a rounded and comprehensive basis for assessing changes in
economic well-being through indicators that adjust or supplement more traditional measures such as gross
domestic product (GDP).
Page 13 of 18Income quintiles
Individuals are ranked by their equivalised household disposable incomes, using the modified Organisation for
Economic Co-operation and Development (OECD) scale, and then divided into five income quintiles.
Self-Employment Income Support Scheme (SEISS)
The government introduced the Coronavirus (COVID-19) Self-Employment Income Support Scheme to support
self-employed people affected by the economic impact of the coronavirus. This was a taxable grant worth 80% of
trading profits up to a maximum of £2,500 per month for three months from March 2020. Self-employed workers
were then able to make a claim for a second and final grant in August 2020.
Parent
In this publication, a respondent is classified as a parent if they live with a dependent child aged under 16 years.
Personal well-being
Our personal well-being measures ask people to evaluate, on a scale of 0 to 10, how satisfied they are with their
life overall, whether they feel they have meaning and purpose in their life, and about their emotions (happiness
and anxiety) during a particular period.
Income
Respondents are asked about their personal income and grouped into bands accordingly. This is the total annual
income for that individual from all sources, gross of tax.
Respondents are also asked about the effects of the coronavirus (COVID-19) pandemic on their household
income. This is the total annual income from all sources for all individuals in the same household.
7 . Measuring the data
Data sources
The statistics in this publication are based on the Office for National Statistics’ (ONS’s) weekly Opinions and
Lifestyle Survey (OPN), which was created to understand the impact of the coronavirus (COVID-19) pandemic on
British society and the Survey on Living Conditions (SLC), which is the longitudinal component of the Household
Finances Survey (HFS).
The data analysed mostly cover the period 20 March to 20 December 2020 and consider the impact on measures
of personal and economic well-being during the whole period, from initial lockdown and restrictions through to
easing over summer and the reintroduction of restrictions from September 2020 onwards. High-level analysis
beyond 20 December 2020 can be found in our weekly release on Coronavirus and the social impacts on Great
Britain.
Page 14 of 18Opinions and Lifestyle Survey (OPN)
The OPN is a monthly omnibus survey. In response to the coronavirus pandemic, we have adapted the OPN to
become a weekly survey used to collect data on the impact of the coronavirus pandemic on day-to-day life in
Great Britain. Throughout the bulletin, analysis using the weekly module from the OPN is used. For the time
periods covered in each module, please see our reference tables. In the latest wave, 6,027 individuals were
sampled, with a response rate of 55.3% (or 3,300 individuals) for the survey conducted from 16 to 20 December
2020.
The survey results are weighted to be a nationally representative sample for Great Britain, and data are collected
using an online self-completion questionnaire. Individuals who did not want to or were unable to complete the
survey online had the opportunity to take part over the phone.
Sampling
A sample of 6,027 households was randomly selected from those that had previously completed the Labour
Market Survey (LMS). From each household, one adult was selected at random but with unequal probability.
Younger people were given higher selection probability than other people because of under-representation in the
sample available for the survey. The survey also includes a boosted sample for England to allow more detailed
analysis at a regional level, which are available in the datasets.
Weighting
The responding sample in the week 22 December 2020 to 3 January 2021 contained 3,756 individuals (62%
response rate). Survey weights were applied to make estimates representative of the population.
Weights were first adjusted for non-response and attrition. Subsequently, the weights were calibrated to satisfy
population distributions considering the following factors:
sex by age
region
tenure
highest qualification
employment status
For age, sex and region, population totals based on projections of mid-year population estimates for December
2020 were used. The resulting weighted sample is therefore representative of the Great Britain adult population
by a number of socio-demographic factors and geography.
Survey of Living Conditions (SLC)
The SLC is a six-year, wave survey that serves as the longitudinal component of the Household Finances Survey
(HFS), used in the ONS's annual releases into average household income. This analysis is based on 13,635
responses from individuals collected between April and October 2020, which have been linked with data from the
previous wave of data collection (April to October 2019) where available.
Page 15 of 18As such, the SLC provides the possibility of longitudinal analysis, looking at how the situation has changed from
one year to the next for a cohort of households. This is particularly useful for looking at household's finances
before and during the coronavirus pandemic.
Sampling
The sample is produced by randomly selecting 1,340 postcode sectors in Great Britain and then splitting these
into eight equal bands based on socio-economic classification and ordering according to car ownership, before
randomly selecting 15 households from each postcode sector. It captures roughly 2,500 unique variables on
topics including housing, employment, health and income.
Additionally, since the start of the coronavirus pandemic, variables have been added to explore how people's
lives and particularly household finances have been affected by COVID-19.
Weighting
Survey weights were applied to make estimates representative of the population. Weights were not adjusted for
non-response and attrition to provide more timely estimates, but weights were calibrated to satisfy population
distributions considering the following factors: sex by age, region and tenure. Tenure has recently been added to
the survey weightings to address changing demographics of respondents (see Strengths and limitations).
8 . Strengths and limitations
Opinions and Lifestyle Survey (OPN)
The main strengths of the Opinions and Lifestyle Survey (OPN) include:
it allows for timely production of data and statistics that can respond quickly to changing needs
it meets data needs: the questionnaire is developed with customer consultation, and design expertise is
applied in the development stages
robust methods are adopted for the survey's sampling and weighting strategies to limit the impact of bias
quality assurance procedures are undertaken throughout the analysis stages to minimise the risk of error
The main limitations of the OPN include:
analysis of estimates in Wales and Scotland are based on low sample sizes, and therefore caution should
be used with these estimates
comparisons between periods and groups must be done with caution as estimates are provided from a
sample survey; as such, confidence intervals are included in the datasets to present the sampling
variability, which should be taken into account when assessing differences between periods, as true
differences may not exist
Page 16 of 18Survey of Living Conditions (SLC)
The main strength of the Survey of Living Conditions (SLC) is its use as a dedicated survey into household
income and earnings. Because of the longitudinal nature, respondents are used to providing a wealth of financial
data that allow for the creation of detailed estimates of household income. This also allows for comparison across
multiple years to see how a household's income has changed over time.
Analysis using the SLC is experimental with early indicators derived from simple frequency counts of variables
included in the questionnaire. The aim of this is to provide timely data that reflect the changing picture of
household income throughout the COVID-19 pandemic. The analysis has been produced before any imputation is
carried out.
Imputation is crucial to the estimation of income measures, therefore, at present, measures of income are not
provided. The questions best suited to be used as early indicators are "opinion" questions or those relating to
"reported changes" (increase, decrease or stayed the same) in income, and so this has been the focus of the
analysis provided.
As with all survey-based sources, the data are subject to some limitations. For instance, the SLC is a sample of
the private household population, and therefore does not include those that live in institutionalised households,
such as care homes and hostels, or the homeless. As such, it is likely that many of the poorest in society are not
captured, which users should bear in mind when interpreting these statistics.
In response to the coronavirus pandemic, the SLC has been adapted from being collected face-to-face, using
computer-assisted questionnaires, to telephone collection. This has affected the sample that has responded to
the survey, which seems to have become biased towards people who own their home. To address this, the
weightings have been adjusted to include tenure.
Page 17 of 189 . Related links
Household income inequality, UK: financial year ending 2020
Bulletin | Released 21 January 2021
Provisional estimates of income inequality in the UK for the financial year ending 2020.
Average household income, UK: financial year ending 2020 (provisional)
Bulletin | Released 21 January 2021
Provisional estimates of median and mean disposable income for people in the UK for the financial year
ending 2020.
Personal well-being in the UK: April 2019 to March 2020
Bulletin | Released 30 July 2020
Estimates of life satisfaction, feeling that the things done in life are worthwhile, happiness and anxiety at the
UK, country, regional, county and local authority level. Covering the period in the build up to the national
lockdown of the UK in response to the coronavirus (COVID-19) pandemic.
Coronavirus and anxiety, Great Britain: 3 April 2020 to 10 May 2020
Article | Released 15 June 2020
The number of people reporting high levels of anxiety has sharply elevated during the coronavirus (COVID-
19) pandemic. This article will provide insights into which socio-demographic and economic factors were
most associated with high levels of anxiety during the first weeks of lockdown.
Coronavirus and the social impacts on Great Britain: 15 January 2021
Bulletin | Released 15 January 2021
Indicators from the Opinions and Lifestyle Survey covering the period 7 to 10 January 2021 to understand
the impact of the coronavirus (COVID-19) pandemic on people, households and communities in Great
Britain.
Page 18 of 18You can also read