Nepal 2016 Demographic and Health Survey Key Findings - Key Findings ...
←
→
Page content transcription
If your browser does not render page correctly, please read the page content below

Nepal 2016 Demographic and Health Survey Key Findings
The 2016 Nepal Demographic and Health Survey (2016 NDHS) was implemented by New ERA under the
aegis of the Ministry of Health of Nepal. Data collection took place from 19 June 2016 to 31 January 2017.
Funding for the survey was provided by the United States Agency for International Development (USAID).
ICF provided technical assistance through The DHS Program, a USAID-funded project providing support and
technical assistance in the implementation of population and health surveys in countries worldwide.

Additional information about the 2016 NDHS may be obtained from the Ministry of Health, Ramshahpath,
Kathmandu; Telephone: +977-1-4262543/4262802; Internet: www.mohp.gov.np; and New ERA, Rudramati
Marg, Kathmandu, P.O. Box 722, Kathmandu 44600, Nepal; Telephone: +977-1-4413603; Email: info@newera.
com.np; Internet: www.newera.com.np.

Additional information about The DHS Program may be obtained from ICF, 530 Gaither Road, Suite 500,
Rockville, MD 20850, USA; Telephone: +1-301-407-6500; Fax: 301-407-6501; E-mail: info@DHSprogram.com;
Internet: www.DHSprogram.com.

Recommended citation:

Ministry of Health, Nepal; New ERA; and ICF. 2017. 2016 Nepal Demographic and Health Survey Key Findings.
Kathmandu, Nepal: Ministry of Health Nepal.

                                    Cover photographs: © 2017 Ashess Shakya/Photo Zenith Pokhara/98560 37870;
                                                        © 2013 Valeria Caldas/JHU CCP, Courtesy of Photoshare.

                                                 New ERA                             Ministry of Health
About the 2016 NDHS
The 2016 Nepal Demographic and Health Survey (NDHS) is designed to provide data for monitoring the
population and health situation in Nepal. The 2016 NDHS is the fifth Demographic and Health Survey
conducted in Nepal since 1996. The objective of the survey is to provide up-to-date estimates of fertility
levels and preferences, marriage, sexual activity, family planning methods, breastfeeding practices, nutrition,
anemia, childhood and maternal mortality, maternal and child health, HIV/AIDS and other sexually
transmitted infections (STIs), women’s empowerment, domestic violence, and hypertension that can be used
by program managers and policymakers to evaluate and improve existing programs.

Who participated in the survey?
A nationally representative sample of 12,862 women age 15-49 in 11,040 surveyed households and 4,063 men
age 15-49 in half of the surveyed households were interviewed. This represents a response rate of 98% of
women and 96% of men. The 2016 NDHS provides reliable estimates at the national level, for urban and rural
areas, 3 ecological zones, 5 development regions, and 7 provinces.

2016 Nepal Demographic and Health Survey                                                                Page 1
Characteristics of Households and Respondents
Household Composition
The average household size in Nepal is 4.2 members.
More than 3 in 10 households (31%) are headed by
women. Nearly one-third (34%) of the population is
under age 15.

Water, Sanitation, and Electricity
The majority of households (95%) have access to
an improved source of drinking water. More than
6 in 10 households (62%) in Nepal use improved
sanitation. Access to an improved source of drinking
water and sanitation facility vary little by urban/                    © 2014 Basil Safi, Courtesy of Photoshare
rural residence. Thirty-eight percent of households
use unimproved sanitation—22% use a shared
facility, 2% use an unimproved facility, and 15% have   Migration
no facility. Nine in ten households have electricity.   Migration is quite common in Nepal—nearly half of
Nearly all urban households (94%) have electricity,     households (47%) reported at least one person who
compared to 85% of rural households.                    migrated from the household in the past 10 years.
                                                        One in three men migrated in the past year. Nearly
 Water, Sanitation, and Electricity by Residence        8 in 10 men migrated for work and two-thirds of
              Percent of households with:               women migrated due to marriage. The most common
                 Total Urban Rural                      destinations for male migration are the Middle East
                                                        (32%) and India (17%). External migration is not
     95 94 96                          91 94            common among women.
                                               85

                     62 61 63                           Education
                                                        One in three women and 1 in 10 men age 15-49 have
                                                        no education. Seventeen percent of women and 19%
                                                        of men have only attended primary school, while
                                                        26% of women and 34% of men have attended some
      Improved        Improved         Electricity      secondary education. Nearly one-quarter of women
      source of       sanitation
   drinking water                                       and 37% of men have their School Level Certificate
                                                        (SLC) or above. About 7 in 10 women (69%) and 9 in
Ownership of Goods                                      10 men (89%) are literate.

Nearly all households in Nepal have a mobile
telephone (93%), 52% have a television, and 29% have
a radio. Urban households are more likely than rural                        Education
households to own a mobile telephone or television.       Percent distribution of women and men age 15-49
In contrast, rural households are more likely to               by highest level of education attended
own agricultural land or farm animals than urban
households.                                                                                   SLC and above
                                                               24
                                                                                  37
                                                               26                             Some secondary

                                                               17                 34
                                                                                              Primary
                                                               33                 19
                                                                                  10          No education
                                                             Women               Men

Page 2                                                              2016 Nepal Demographic and Health Survey
Fertility and Its Determinants
Total Fertility Rate                                                                  Trends in Total Fertility Rate
Currently, women in Nepal have an average of 2.3                                      Births per woman for the three-year
                                                                                            period before the survey
children. Since 1996, fertility has decreased from
4.6 children per woman to the current level. This                               4.6
demonstrates a decline of 2.3 children within two                                           4.1
decades.                                                                                                 3.1
                                                                                                                 2.6
Fertility varies by residence and province. Women in                                                                         2.3
rural areas have an average of 2.9 children, compared
to 2.0 children among women in urban areas. Fertility
is lowest in Province 3 (1.8 children per woman) and
                                                                               1996       2001       2006       2011       2016
highest in Province 2 (3.0 children per woman).                                NFHS       NDHS       NDHS       NDHS       NDHS
Fertility also varies with education and economic
status. Women with no education have 1.5 more
children than women with SLC and above education                           Total Fertility Rate by Household Wealth
(3.3 versus 1.8). Fertility decreases as the wealth of                               Births per woman for the three-year
                                                                                           period before the survey
the respondent’s household* increases. Women living
in the poorest households have an average of 3.2
children, compared to 1.6 children among women
living in the wealthiest households.                                           3.2
                                                                                           2.5        2.5
                                                                                                                2.1
                                                                                                                            1.6

                                                                             Lowest Second Middle Fourth Highest
                                                                           Poorest                                     Wealthiest

                                                                             Total Fertility Rate by Province
                                                                              Births per woman for the three-year
                                                                                    period before the survey
                     Province 7
                        2.2
                                        Province 6                                               Nepal
                                           2.8                                                    2.3

                                                             Province 4
                                                                2.0
                                              Province 5
                                                 2.4                             Province 3
                                                                                    1.8
                                                                                                          Province 1
                                                                                                             2.3
                                                                  Province 2
                                                                     3.0

* Wealth of families is calculated through household assets collected from DHS surveys—i.e., type of flooring; source of water;
availability of electricity; possession of durable consumer goods. These are combined into a single wealth index. They are then divided
into five groups of equal size, or quintiles, based on their relative standing on the household wealth index.

2016 Nepal Demographic and Health Survey                                                                                           Page 3
Age at First Marriage, Sex, and Birth
Women in Nepal marry at an earlier age than men.
The median age at first marriage for women age 25-
49 is 17.9 years, compared to 21.7 years among men
age 25-49. Women with no education marry 4.6 years
earlier than women with SLC and above education
(16.8 years versus 21.4 years). More than half (52%)
of women are married by age 18, compared to 1 in 5
men (19%).

Women initiate sexual activity at the same time
                                                                  © 2013 Valerie Caldas/JHU CCP, Courtesy of Photoshare
of marriage at age 17.9, while men initiate sexual
activity 1.2 years before marriage at age 20.5. Women
with SLC and above education initiate sex 4.5 years
later than women with no education (21.4 years
                                                          Teenage Childbearing
versus 16.9 years). Eleven percent of women begin         In Nepal, 17% of adolescent women age 15-19 are
sexual activity before age 15, while 51% have sex         already mothers or pregnant with their first child.
before age 18.                                            Teenage fertility is higher in rural areas (22%) than in
                                                          urban areas (13%). By province, teenage pregnancy
Within 2.5 years of marriage, women are having their      ranges from 10% in Province 3 to 27% in Province
first birth. The median age at first birth for women is   2. Teenage pregnancy decreases with increased
20.4 years. One in five women give birth by age 18.       education; 33% of young women with no education
                                                          have begun childbearing, compared to 7% young
                                                          women with SLC and above education. Adolescent
  Median Age at First Marriage, Sex, and Birth            women in the three lowest wealth quintiles are more
          Among women and men age 25-49                   likely than those in the wealthiest households to have
                 Women Men                                begun childbearing.

              21.7           20.5                                Teenage Childbearing by Education
                                     20.4
       17.9           17.9                                Percent of women age 15-19 who have begun childbearing

                                            na
       Median          Median         Median                                 33       30
      age at first      age at         age at                     17                            17
       marriage        first sex     first birth                                                           7
                                                                 Total       No     Primary Some SLC and
                                                                          education        secondary above

Page 4                                                                   2016 Nepal Demographic and Health Survey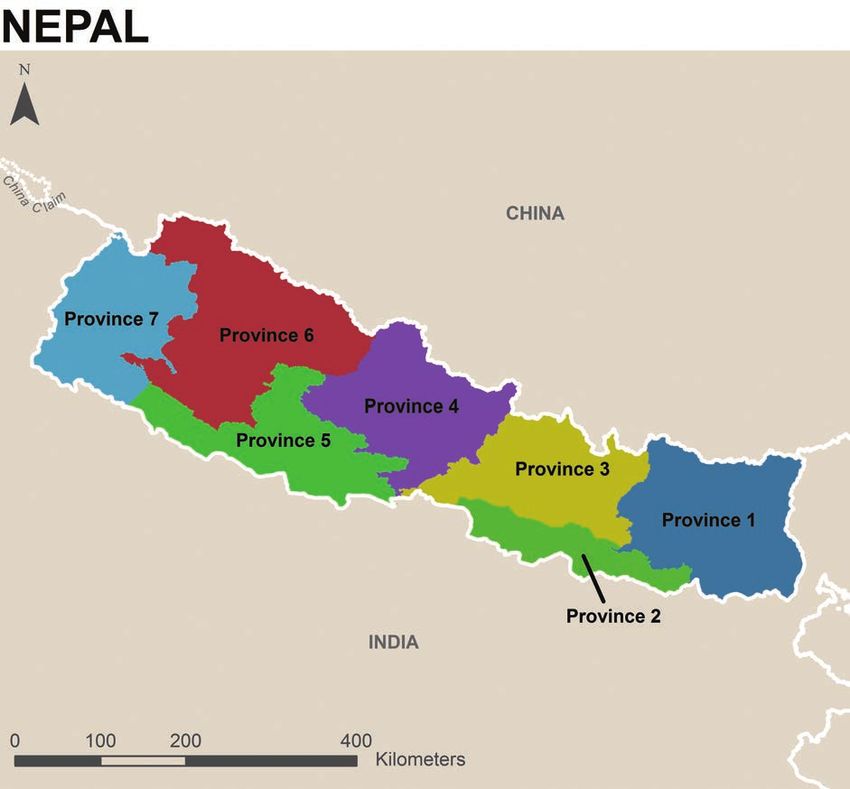
Family Planning
Current Use of Family Planning                                                       Family Planning
More than half (53%) of married women age 15-                               Percent of married women age 15-49
                                                                                   using family planning
49 use any method of family planning—43% use a
modern method and 10% use a traditional method.                                  Any method                   53
Female sterilization is the most popular modern
method (15%), followed by injectables (9%), male                      Any modern method                     43
sterilization (6%), the pill (5%), male condom (4%),                      Female sterilization        15
implants (3%), and the IUD (1%).
                                                                                  Injectables         9
Use of modern methods of family planning among
married women varies by province. Modern method                             Male sterilization    6
use ranges from a low of 37% in Province 4 to a high
                                                                                           Pill   5
of 49% in Province 3. Modern family planning use
decreases with higher levels of education. Fifty-two                           Male condom        4
percent of married women with no education use
                                                                                     Implants     3
a modern method of family planning, compared
to 34% of women with SLC and above education.                                              IUD 1
Female sterilization is the most common modern
                                                                    Any traditional method         10
method among women with no education (25%).

The use of any method of family planning by married
women has nearly doubled from 29% in 1996 to 53%
in 2016. Similarly, modern method use has increased                       Trends in Family Planning Use
from 26% to 43% during the same time period, but                          Percent of married women age 15-49
                                                                                 using family planning
has not changed since 2006. Traditional method use
has slightly increased from 3% in 1996 to 10% in 2016.
                                                                                                          Any method
                                                                                           48             50      53
                                                                                39
                                                                     29              44        43     43
                                                                           35           Any modern method
                                                                     26 Any traditional method        10
                                                                           4         4          7
                                                                     3
                                                                    1996  2001      2006     2011    2016
                                                                    NFHS NDHS       NDHS     NDHS   NDHS

                                                               Modern Method Use by Province
                                                              Percent of married women age 15-49 using
                                                                 a modern method of family planning
                Province 7
                   48%
                                Province 6                                         Nepal
                                   45%                                             43%

                                                 Province 4
                                                    37%
                                    Province 5
                                       39%                           Province 3
                                                                        49%
                                                                                            Province 1
                                                                                               40%
                                                       Province 2
                                                          42%

2016 Nepal Demographic and Health Survey                                                                               Page 5
Demand for Family Planning
Fifteen percent of married women want to delay
childbearing (delay first birth or space another birth)
for at least two years. Additionally, 61% of married
women do not want any more children. Women who
want to delay or stop childbearing are said to have
a demand for family planning. The total demand for
family planning among married women in Nepal is
76%.

The total demand for family planning includes both
met and unmet need. Met need is the contraceptive
prevalence rate. In Nepal, 53% of married women use
any family planning method.                                          © 2016 HC3 SMART CHOICE, Used with permission

Unmet Need for Family Planning
Unmet need for family planning is defined as the
                                                          Exposure to Family Planning Messages
proportion of married women who want to delay or
stop childbearing but are not using family planning.      The most common media source of family planning
One in four married women in Nepal have an                messages is a poster or hoarding board. Nearly
unmet need for family planning: 8% want to delay          half of women (46%) and 72% of men saw a family
childbearing, while 16% want to stop childbearing.        planning message on a poster or hoarding board
                                                          in the few months before the survey. Radio and
Demand for Family Planning Satisfied by                   television are other commons sources of family
Modern Methods                                            planning messages, while the least common methods
Demand satisfied by modern methods measures               are newspaper/magazine or street drama. Overall,
the extent to which women who want to delay or            35% of women and 13% of men have not been
stop childbearing are actually using modern family        exposed to family planning messages via any of the
planning methods. Fifty-six percent of the demand         five media sources.
for family planning in Nepal is satisfied by modern
                                                          Informed Choice
methods. Both total demand for family planning and
demand satisfied by modern methods have increased         Family planning clients should be informed about
since 1996, while unmet need has declined from 32%        the side effects of the method used, what to do if
in 1996 to 24% in 2016.                                   they experience side effects, and told about other
                                                          available family planning methods. Two-thirds of
                                                          current users of modern contraceptive methods were
     Trends in Demand for Family Planning                 informed of possible side effects or problems of their
           Percent of married women age 15-49             method, 56% were informed about what to do if they
                                                          experience side effects, and 64% were informed of
                          Total demand
                                   77      76             other available family planning methods. Overall,
                         73
      61
                67                                        half of women were informed of all three.
                          61       56      56
                53
      43                 Demand satisfied by
                         modern methods
      32        28                 28
                         25                24
                                 Unmet need
    1996       2001     2006      2011    2016
    NFHS       NDHS     NDHS     NDHS     NDHS

Page 6                                                                2016 Nepal Demographic and Health Survey
Childhood Mortality
Rates and Trends
Infant and under-5 mortality rates for the five-year
period before the survey are 32 and 39 deaths per
1,000 live births, respectively. At these mortality
levels, 1 in 25 children in Nepal does not survive to
their fifth birthday. The neonatal mortality rate for
the five-year period before the survey is 21 deaths per
1,000 live births.

Childhood mortality rates have declined since 1996.
Infant mortality has decreased by more than half
from 78 deaths per 1,000 live births in 1996 to 32 in                © 2016 Dipak Raj Sharma, Suaahara Program/JHUCCP,
                                                                                                   Courtesy of Photoshare
2016. During the same time period, under-5 mortality
has declined threefold from 118 to 39 deaths per 1,000
live births.
                                                            Birth Intervals
                                                            Spacing children at least 36 months apart reduces
                                                            the risk of infant death. The median birth interval
            Trends in Childhood Mortality
                                                            in Nepal is 36.7 months. Infants born less than
             Deaths per 1,000 live births for the
             five-year period before the survey             two years after a previous birth have high under-5
      118                                                   mortality rates. Under-5 mortality is three times
                                                            higher among children born less than two years
                  91   Under-5 mortality                    after a previous birth (78 deaths per 1,000 live births)
       78
                                                            than among children born four or more years after
                  64      61
                                     54                     a previous birth (25 deaths per 1,000 live births).
                          48      46
       50                                            39     Overall, 21% of children are born less than two years
                     Infant mortality
                  39
                          33         33
                                                       32   after their siblings.
                      Neonatal mortality             21

     1996       2001       2006       2011          2016
     NFHS       NDHS       NDHS       NDHS          NDHS      Under-5 Mortality by Previous Birth Interval
                                                                        Deaths per 1,000 live births for the
                                                                        ten-year period before the survey

Under-5 Mortality Rate by Background
Characteristics                                                    78

The under-5 mortality rate differs by province,
mother’s education, and wealth for the ten-year                                  44
                                                                                               32
period before the survey. By province, under-5                                                                 25
mortality ranges from 27 deaths per 1,000 live births
in Province 4 to 69 deaths per 1,000 live births
Maternal and Newborn Health Care
Antenatal Care
More than 8 in 10 women (84%) age 15-49 receive
antenatal care (ANC) from a skilled provider (doctor,
nurse, and auxiliary nurse midwife). The timing
and quality of ANC are also important. Two-thirds
of women have their first ANC visit in the first
trimester, as recommended. Seven in ten women
make four or more ANC visits.

The majority of women (91%) take iron tablets or
syrup during pregnancy. Eighty-nine percent of
women’s most recent births were protected against
                                                                                 © 2015 Tracy McClair, Courtesy of Photoshare
neonatal tetanus. Among women who received
ANC for their most recent birth, 91% had their blood
pressure measured, 76% had a urine sample taken,
and 66% had a blood sample taken.
                                                                          Trends in Maternal Health
Delivery and Postnatal Care                                 Percent of women age 15-49 who had a live birth in the
                                                             five years before the survey for the most recent birth
More than half of births (57%) are delivered in
a health facility, primarily in government sector                                                                     84
                                                                                       ANC by skilled provider
facilities. However, 41% of births are delivered at                                                                   69
                                                                                                           58
home. Women with SLC and above education (85%)
                                                                                             44                       57
and those in the wealthiest households (90%) are                                                           50
                                                                 4+ ANC 28                   29
more likely to deliver at a health facility. Only 8%              visits 14
                                                                                                           35
of births in 1996 were delivered in a health facility,         8                             18
                                                                          9                    Health facility delivery*
compared to 57% in 2016.                                       1996      2001             2006     2011        2016
                                                               NFHS     NDHS              NDHS     NDHS        NDHS
Overall, 58% of births are assisted by a skilled              *% of live births in the five years before the survey
provider, the majority by doctors. One in ten births
are assisted by no one. Women with SLC and above
education (85%), from the wealthiest households
(89%), and those for whom its their first birth (76%)
are more likely to receive delivery assistance from a
                                                           Maternal Mortality
skilled provider. Skilled assistance during delivery
has increased from 9% in 1996 to 58% in 2016.              The 2016 NDHS asked women about deaths of their
                                                           sisters to determine maternal mortality. Maternal
Postnatal care helps prevent complications after           mortality includes deaths of women during
childbirth. More than half of women (57%) receive a        pregnancy, delivery, and 42 days after delivery
postnatal check within two days of delivery, while         excluding deaths that were due to accidents or
42% did not have a postnatal check within 41 days          violence. The maternal mortality ratio (MMR) for
of delivery. Similarly, 57% of newborns receive a          Nepal is 239 deaths per 100,000 live births for the
postnatal check within two days of birth, while 40%        seven-year period before the survey. The confidence
did not have a postnatal check.                            interval for the 2016 MMR ranges from 134 to 345
                                                           deaths per 100,000 live births.
Umbilical cord infection is a severe bacterial infection
that contributes to neonatal morbidity and mortality.
Among births in the two years before the survey,
Chlorhexidine was applied on 39% of newborns,
whereas nothing was applied on 37% of newborns.

Page 8                                                                   2016 Nepal Demographic and Health Survey
Child Health
Vaccination Coverage
More than three-quarters (78%) of children age 12-23
months have received all eight basic vaccinations—
one dose each of BCG and Measles-Rubella and three
doses each of DPT-HepB-Hib and polio vaccine.
Basic vaccination coverage increases with mother’s
education; 68% of children whose mothers have
no education received all eight basic vaccinations,
compared to 91% of children whose mothers have
SLC and above education. Basic vaccination coverage
is lowest in Province 2 (65%) and highest in Province
4 (93%). Basic vaccination coverage has increased © 2014 Dipak Raj Sharma, Suaahara Program/JHUCCP,
Courtesy of Photoshare
since 1996 when 43% of children had received all
basic vaccinations, but has declined since 2011.
Childhood Illnesses
Basic Vaccination Coverage
Percent of children age 12-23 months vaccinated In the two weeks before the survey, 2% of children
at any time before the survey under five were ill with cough and rapid breathing,
98 97 94 98 95 symptoms of acute respiratory infection (ARI).
86 88 90
78 Three-quarters of children with symptoms of ARI for
whom treatment or advice was sought were taken to
the private medical sector, and 27% were taken to a
government facility.
One in five children under five had fever in the two
1
weeks before the survey. Among these children,
BCG 1 2 3 1 2 3 Measles- All None
Rubella basic 80% were taken to a health facility or providers for
DPT-HepB-Hib Polio
treatment or advice.
Eight percent of children under five had diarrhea
in the two weeks before the survey. Diarrhea was
Trends in Basic Vaccination Coverage
most common among children age 6-11 months
Percent of children age 12-23 months who
have received all basic vaccinations (15%). Nearly two-thirds of children under five with
87 diarrhea were taken to a health facility or providers
83 78 for treatment or advice.
66
All basic vaccinations Children with diarrhea should drink more fluids,
43
particularly through oral rehydration therapy (ORT)
20 No vaccinations which includes oral rehydration solution (ORS),
1 3 3 1 recommended home fluids, and increased fluids.
1996 2001 2006 2011 2016 Additionally, children under five with diarrhea
NFHS NDHS NDHS NDHS NDHS should receive zinc. While 68% of children under
five with diarrhea received ORT, 16% received no
treatment. Only 10% of children under five with
diarrhea received ORS and zinc.
2016 Nepal Demographic and Health Survey Page 9Feeding Practices and Supplementation
Breastfeeding and the Introduction of Vitamin A and Iron Supplementation
Complementary Foods Micronutrients are essential vitamins and minerals
Breastfeeding is very common in Nepal with 99% required for good health. Vitamin A, which prevents
of children ever breastfed. More than half (55%) blindness and infection, is particularly important for
of children are breastfed within the first hour of children. In the 24 hours before the survey, 63% of
life. Three in ten children who were ever breastfed children age 6-23 months ate foods rich in vitamin
received a prelactal feed, though this is not A. Eighty-six percent of children age 6-59 months
recommended. received a vitamin A supplement in the six months
prior to the survey.
WHO recommends that children receive nothing
but breastmilk (exclusive breastfeeding) for the first Iron is essential for cognitive development in
six months of life. Two-thirds of children under six children and low iron intake can contribute to
months are exclusively breastfed. Children under anemia. Thirty-five percent of children age 6-23
three breastfeed for an average of 30.5 months and months ate iron-rich foods the day before the survey,
are exclusively breastfed for 4.3 months. while 8% of children age 6-59 months received an
iron supplement in the week before the survey.
Complementary foods should be introduced
when a child is six months old to reduce the risk In Nepal, pregnant women should take iron tablets
of malnutrition. In Nepal, 83% of children age 6-8 for at least 180 days during pregnancy to prevent
months are breastfed and receive complementary anemia and other complications. More than 4 in 10
foods. women took iron tablets for at least 180 days during
their last pregnancy.
Use of Iodized Salt
Iodine is an important micronutrient for physical and
mental development. Fortification of salt with iodine
is the most common method of preventing iodine
deficiency. Ninety-five percent of households in
Nepal have iodized salt.
© 2015 Dharma Raj Bajracharya, Courtesy of Photoshare
Page 10 2016 Nepal Demographic and Health SurveyNutritional Status
Children’s Nutritional Status Women and Men’s Nutritional Status
The 2016 NDHS measures children’s nutritional The 2016 NDHS also took weight and height
status by comparing height and weight measurements of women and men age 15–49.
measurements against an international reference Overall, 17% of women are thin (body mass index
standard. Stunting is an indication of chronic or BMI < 18.5). Comparatively, 22% of women are
undernutrition. More than one-third (36%) of overweight or obese (BMI ≥ 25.0). Women from the
children under five in Nepal are stunted, or too wealthiest households (45%) and those from Province
short for their age. Stunting is more common in rural 3 (35%) are more likely to be overweight or obese.
children (40%), compared to urban children (32%). Since 2006, overweight or obesity among women has
By province, stunting ranges from 29% in Provinces 3 more than doubled from 9% to 22% in 2016.
and 4 to 55% in Province 6. Children from the poorest
Among men, 17% are thin (BMI < 18.5) and 17% are
households (49%) and whose mothers have no
overweight or obese (BMI ≥ 25.0). Men age 30-39
education (46%) are more likely to be stunted.
(28%) and those from the wealthiest households
Overall, 10% of children are wasted (too thin for (32%) are more likely to be overweight or obese.
height), a sign of acute malnutrition. In addition,
27% of children are underweight, or too thin for Anemia
their age. The nutritional status of children in Nepal The 2016 NDHS tested children age 6-59 months and
has improved since 1996. More than half (57%) of women age 15-49 for anemia. More than half (53%)
children under five were stunted in 1996 compared to of children age 6-59 months are anemic. Anemia
36% in 2016. is more common in rural children (56%) and those
whose mothers have no education (57%). Anemia
in children ranges from a low of 43% in Province 3
Trends in Children’s Nutritional Status and a high of 59% in Province 2. Anemia prevalence
Percent of children under five, among children has increased since 2011 when 46%
based on 2006 WHO Child Growth Standards of children were anemic.
Four in ten women age 15-49 in Nepal are anemic.
Stunted Anemia prevalence ranges from a low of 28% in
57 57
49 Province 4 to 58% in Province 2. Since 2006, anemia
42 43 39 41 36 among women has increased from 36% to 41% in
Underweight 29
15
27 2016.
11 13 11 10
Wasted
1996 2001 2006 2011 2016
NFHS NDHS NDHS NDHS NDHS Trends in Anemia among Children and Women
Percent of children age 6-59 months and
women age 15-49 with anemia
2006 NDHS 2011 NDHS 2016 NDHS
48 53
46 41
36 35
Children Women
2016 Nepal Demographic and Health Survey Page 11HIV Knowledge, Attitudes, and Behavior
Knowledge of HIV Prevention Methods Multiple Sexual Partners
Seven in ten women and 9 in 10 men know that the Having multiple sexual partners increases the risk
risk of getting HIV can be reduced by using condoms of contracting HIV and other sexually transmitted
and limiting sex to one monogamous, uninfected infections (STIs). Only 3% of men had two or more
partner. Knowledge of HIV prevention methods is sexual partners in the past 12 months. Among men
highest among women and men from the wealthiest who had two or more partners in the past year,
households and those with SLC and above education. 40% of men reported using a condom at last sexual
intercourse. Men in Nepal have an average of 2.4
Knowledge of Prevention of Mother-to-Child sexual partners in their lifetime.
Transmission (PMTCT)
Nearly half of women (47%) and 51% of men know HIV Testing
that HIV can be transmitted during pregnancy, Only one-third of women and 58% of men know
delivery, and by breastfeeding. Forty-four percent of where to get an HIV test. One in ten women and 2 in
women and 36% of men know that HIV transmission 10 men have ever been tested for HIV and received
can be reduced by the mother taking special the results. However, the majority of women (89%)
medication. and men (80%) have never been tested for HIV.
Within the past 12 months, 4% of women and 8%
of men have been tested and received the results.
Knowledge of HIV Prevention Methods HIV testing has slightly increased since 2011 when
Percent of women and men age 15-49 who know that 5% of women and 14% of men were ever tested for
the risk of HIV transmission can be reduced by: HIV and received the results. One in ten pregnant
Women women with a live birth in the last two years received
Men HIV testing and counseling and received the results
during an ANC visit.
72
Using condoms
92 Trends in HIV Testing
Percent of women and men age 15-49 who were
ever tested for HIV and received their results
Limiting sex to one 77
uninfected partner 2011 NDHS 2016 NDHS
93
70
Both
89
20
Knowledge of PMTCT 14
Percent of women and men age 15-49 who know that: 10
5
Women
Men Women Men
HIV can be transmitted 47
during pregnancy, delivery,
and by breastfeeding 51
Transmission can be 44
reduced by mother
taking special drugs 36
Page 12 2016 Nepal Demographic and Health SurveyWomen’s Empowerment
Employment
More than two-thirds of married women (68%)
were employed at any time in the past 12 months
compared to 97% of married men. Working men are
more likely to be paid in cash for their work (77%),
while working women are more likely to not be paid
for their work (52%). Half of married women who
are employed and earn cash make decisions on how
to spend their earnings. Overall, three-quarters of
working women reported earning less than their
husband.
© 2014 Ranju Sharma/Medic Mobile, Courtesy of Photoshare
Ownership of Assets
Women are less likely than men to own a home or
land alone or jointly. Among women, 8% own a
home and 11% own land alone or jointly. Among Participation in Household Decisions
men, 19% own a home and 21% own land alone or The 2016 NDHS asked married women about their
jointly. participation in three types of household decisions:
her own health care, making major household
In Nepal, 41% of women and 40% of men use a bank
purchases, and visits to family or relatives. Married
account. Nearly three-quarters of women and 89%
women in Nepal are most likely to have sole or joint
of men own a mobile phone. Among mobile phone
decision making power about their own health care
owners, only 9% of women and 8% of men use their
(58%) and visits to her family or friends (56%) and
phone for financial transactions.
less likely to make decisions about major household
Problems in Accessing Health Care purchases (53%). Overall, 38% of married women
participate in all three decisions. While women’s
More than 8 in 10 women (83%) report at least one
participation in decision making has improved since
problem accessing health care for themselves. More
2001, decision making has declined between 2011 and
than two-thirds (68%) of women do not want to
2016.
go alone to the health facility, while two-thirds are
concerned about the absence of a female health
service provider. Fifty-five percent are worried about Trends in Women’s Participation
getting money for treatment, while 53% are worried in Decision Making
about the distance to the health facility. Less than Percent of married women age 15-49 who make
one-quarter of women are worried about getting decisions by themselves or jointly with their husband
permission to go for treatment.
No decisions
46
54 38 38
17 35
24 28
All 3 decisions
2001 2006 2011 2016
NDHS NDHS NDHS NDHS
2016 Nepal Demographic and Health Survey Page 13Domestic Violence
Attitudes toward Wife Beating Spousal Violence
Three in ten women and 23% of men agree that a More than one-quarter of ever-married women (26%)
husband is justified in beating his wife for at least one have experienced spousal violence, whether physical,
of the following reasons: if she burns the food, argues sexual, or emotional. Fourteen percent of ever-
with him, goes out without telling him, neglects married women report having experienced spousal
the children, or refuses to have sex with him. Both violence within the past year. The most common
women and men are most likely to agree that wife type of spousal violence is physical violence (23%).
beating is justified if the wife neglects the children Women who are divorced/separated/widowed
(24% and 19%, respectively). (48%) are nearly twice as likely to have experienced
spousal violence than currently married women
Experience of Physical Violence (26%).
More than 1 in 5 women (22%) have ever experienced
physical violence since age 15. In the past year,
9% of women have experienced physical violence. Spousal Violence
Experience of physical violence decreases with Percent of ever-married women who have experienced
the following types of spousal violence
increased education, from 34% of women with no
Ever Past 12 months
education to 8% of women with SLC and above
education. The most common perpetrator of physical
violence among ever-married women is a current
husband (84%).
24 26
23
Experience of Sexual Violence
12 14
11
Seven percent of women have ever experienced 8 10
7
4
sexual violence; 3% have experienced sexual violence
in the past year. Divorced/separated/widowed Emotional Physical Sexual Physical Physical,
women are most at risk (20%), compared to never or sexual sexual, or
emotional
married women (2%). The most common perpetrator
of sexual violence among ever-married women is a
current husband (80%). Help Seeking Behavior
More than 1 in 5 women (22%) who have experienced
physical or sexual violence sought help to stop the
violence. Yet, two-thirds of women never sought help
nor told anyone. The most common sources of help
for women who have experienced physical or sexual
violence are their own family (65%) and neighbors
(31%).
Page 14 2016 Nepal Demographic and Health SurveyAbortion Hypertension
Knowledge about Abortion History of High Blood Pressure
Four in ten women know abortion is legal in In Nepal, 80% of women and 65% of men age 15 and
Nepal. Among these women, 29% know abortion is above have ever had their blood pressure measured.
allowable for termination of pregnancies of up to 18 Among those who have had their blood pressure
weeks in the case of rape or incest and 23% know measured, 13% of women and 18% of men were told
abortion is allowable up to 12 weeks gestation for on two or more occasions that they had high blood
any women (23%). Yet, 3% of women believe that pressure. Among those with high blood pressure,
abortion can be done if the fetus is a daughter. one-third of both women and men are taking
prescription medicine to lower their blood pressure.
Pregnancy Outcomes
Among all pregnancies in the five years before the Prevalence of Hypertension
survey, 81% were live births, 9% miscarriages, 9% The 2016 NDHS measured the blood pressure of
abortions, and 1% stillbirths. The proportion of women and men age 15 and above. In Nepal, 17% of
abortion increases with pregnancy order; 2% of first women and 23% of men are hypertensive. A large
pregnancies end in abortion, compared to 21% of proportion of both women (24%) and men (31%) are
fifth-or-higher order pregnancies. The proportion of pre-hypertensive. Among those with normal blood
abortion is higher among women age 35-49 (27%) pressure, 2% are taking medication to lower their
and those from the wealthiest households (16%). blood pressure. The prevalence of hypertension
increases with age among both women and men.
Pregnancy Outcomes
Hypertension is highest in Province 4 among both
Percent distribution of pregnancies in the
five years before the survey women (24%) and men (31%). Obese women (38%)
and men (54%) are more likely to have hypertension.
Stillbirth
1% Prevalence of Hypertension
by Nutritional Status
Abortion
9% Live birth Percent of women and men age 15 and above
81% with hypertension
Miscarriage
9% Women Men
54
Reason and Method for Abortion 43 38
28
Half of abortions in the five years before the survey 21
11 14 13
were performed because the woman did not want
any more children. Twelve percent of abortions were Thin Normal Overweight Obese
performed because the woman wanted to delay
childbearing, 10% due to concerns for the health of
the mother, and 9% wanted to space childbearing.
© 2016 Yogendra Prasai, New ERA
Nearly 7 in 10 abortions were medication abortions.
Other abortion procedures include manual vacuum
aspiration (17%) and dilation and evacuation (D&E)/
dilation and curettage (D&C) (7%). A doctor, nurse,
or auxiliary nurse midwife were the most common
abortion provider (71%). Government sector facilities
were the most common place for abortion services
(31%), followed by home and the private sector (27%
each).
2016 Nepal Demographic and Health Survey Page 15Indicators
Residence
Fertility Nepal Urban Rural
Total fertility rate (number of children per woman) 2.3 2.0 2.9
Median age at first birth for women age 25-49 (years) 20.4 20.6 19.9
Women age 15-19 who are mothers or currently pregnant (%) 17 13 22
Family Planning (among married women age 15-49)
Current use of any method of family planning (%) 53 55 49
Current use of a modern method of family planning (%) 43 44 41
Unmet need for family planning1 (%) 24 23 25
Demand satisfied by modern methods (%) 56 57 55
Maternal Health (among women age 15-49)
ANC visit with a skilled provider2 (%) 84 87 80
Births delivered in a health facility (%) 57 69 44
Births assisted by a skilled provider2 (%) 58 68 47
Child Health (among children age 12-23 months)
Children who have received all basic vaccinations3 (%) 78 79 77
Nutrition
Children under five who are stunted (moderate or severe) (%) 36 32 40
Women age 15-49 who are overweight or obese (%) 22 26 15
Men age 15-49 who are overweight or obese (%) 17 20 12
Prevalence of any anemia among children age 6-59 months (%) 53 49 56
Prevalence of any anemia among women age 15-49 (%) 41 40 43
Childhood Mortality (deaths per 1,000 live births)4
Neonatal mortality 21 16 26
Infant mortality 32 28 38
Under-five mortality 39 34 44
HIV/AIDS
Women age 15-49 who know that HIV can be prevent by using condoms and
limiting sexual intercourse to one uninfected partner (%) 70 74 63
Men age 15-49 who know that HIV can be prevent by using condoms and
limiting sexual intercourse to one uninfected partner (%) 89 89 89
Women age 15-49 who have ever been tested for HIV and received the results (%) 10 12 8
Men age 15-49 who have ever been tested for HIV and received the results (%) 20 20 20
Domestic Violence (among women age 15-49)
Women who have ever experienced physical violence since age 15 (%) 22 21 24
Ever-married women who have ever experienced spousal physical, sexual, or
emotional violence (%) 26 25 28
Hypertension
Prevalence of hypertension among women age 15 and above (%)5 17 17 16
Prevalence of hypertension among men age 15 and above (%) 5
23 25 21
1
Currently married women who do not want any more children or want to wait at least two years before their next birth but are not currently using a method of family
planning. 2Skilled provider includes doctor, nurse, and auxiliary nurse midwife. 3Basic vaccinations include BCG, Measles-Rubella, three doses each of DPT-HepB-Hib and
polio vaccine (excluding polio vaccine given at birth). 4Figures are for the ten-year period before the survey except for the national, urban, and rural rates, in italics, which
represent the five-year period before the survey.Province
Province 1 Province 2 Province 3 Province 4 Province 5 Province 6 Province 7
2.3 3.0 1.8 2.0 2.4 2.8 2.2
21.5 19.2 21.4 20.6 20.3 19.8 19.8
16 27 10 14 13 19 16
55 48 61 49 48 51 57
40 42 49 37 39 45 48
25 21 20 30 28 26 21
50 62 61 48 51 58 61
83 82 85 87 85 73 91
62 45 71 68 59 36 66
63 49 70 70 57 35 66
79 65 85 93 78 75 83
33 37 29 29 39 55 36
27 11 35 32 19 10 9
15 15 24 22 16 6 11
55 59 43 46 53 48 50
43 58 29 28 44 35 39
22 30 17 15 30 29 41
31 43 29 23 42 47 58
36 52 36 27 45 58 69
73 36 83 83 75 77 80
88 89 87 88 91 85 92
8 3 13 12 14 8 18
14 30 17 20 19 13 20
19 34 20 12 23 15 17
22 37 26 16 29 19 22
18 13 19 24 19 10 10
21 18 29 31 25 22 18
5
A woman or man is classified as having hypertension if they have the average systolic blood pressure level ≥140 mmHg and/or the diastolic blood pressure level of ≥90
mmHg at the time of the survey, or the average blood pressure isYou can also read