BLUELINX INVESTOR PRESENTATION - AUGUST 30, 2018
←
→
Page content transcription
If your browser does not render page correctly, please read the page content below

BlueLinx
Investor Presentation

                        August 30, 2018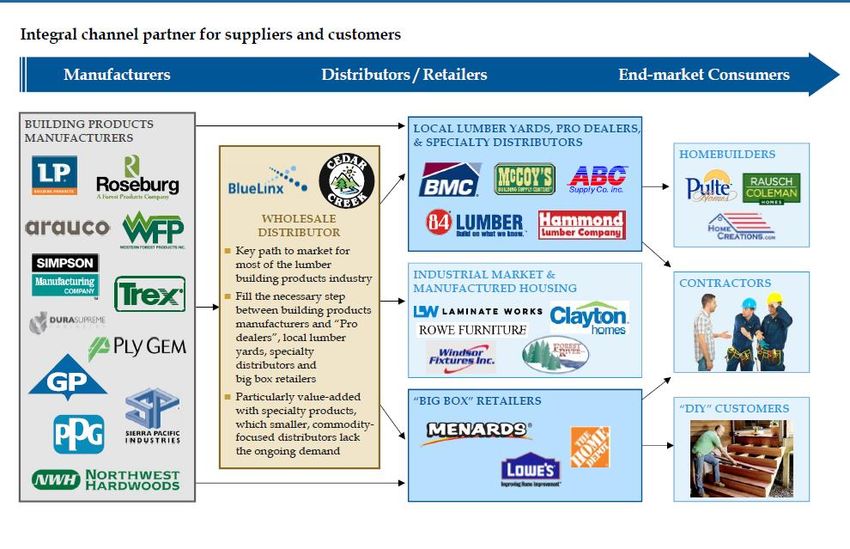
Forward-Looking Statements

Forward-Looking Statements. This presentation includes “forward-looking statements" within the meaning of the Private Securities
Litigation Reform Act of 1995. These forward-looking statements include, without limitation, any statement that may predict, forecast,
indicate or imply future results, performance, liquidity levels or achievements, and may contain the words "believe," "anticipate,"
"expect,” "estimate," "intend," "project," "plan," "will be," "will likely continue," "will likely result" or words or phrases of similar meaning.
The forward-looking statements in this presentation include statements regarding our potential for growth; our positioning and ability to
capitalize on housing trends; the amount, composition and timing of potential synergies, cost savings, and costs to achieve that may or
are expected to result from the combination with Cedar Creek; our capital structure and its ability to support growth and future
deleveraging; the potential benefits of the acquisition of Cedar Creek; our outlook for the housing market, single family housing starts,
residential construction and repair and remodeling spending; our strategic initiatives; the success and timing of plans for the
integration of Cedar Creek; and our plans and expectations for our existing real estate portfolio. These forward-looking statements are
based on estimates and assumptions made by our management that, although believed by us to be reasonable, are inherently
uncertain. Forward-looking statements involve risks and uncertainties, including the factors described in the "Risk Factors" section in
our Annual Report on Form 10-K for the year ended December 30, 2017, our Quarterly Reports on Form 10-Q, and in our other
periodic reports filed with the Securities and Exchange Commission from time to time. Given these risks and uncertainties, you are
cautioned not to place undue reliance on forward-looking statements. Unless otherwise indicated, all forward-looking statements are
as of the date they are made, and we undertake no obligation to update these forward-looking statements, whether as a result of new
information, the occurrence of future events, or otherwise.

Non-GAAP Financial Measures and Supplementary Financial Information. BlueLinx reports Its financial results in accordance with
accounting principles generally accepted in the United States ("GAAP"). We also believe that presentation of certain non-GAAP
measures, such as Adjusted EBITDA, Net Debt, and the ratio of Net Debt to Adjusted EBITDA, as well as GAAP-based and non-
GAAP supplemental financial measures, may be useful to investors and may provide a more complete understanding of the factors
and trends affecting the business than using reported GAAP results alone. Explanations of these non-GAAP measures and these
GAAP-based and non-GAAP supplemental financial measures are included in the accompanying Appendix to this presentation. And
any non-GAAP measures used herein are reconciled herein or in the financial tables in the Appendix to their most directly comparable
GAAP measures. We caution that non-GAAP measures and supplemental financial measures should be considered in addition to, but
not as a substitute for, our reported GAAP results.

Immaterial Rounding Differences. Immaterial rounding adjustments and differences may exist between slides, press releases, and
previously issued presentations.

                              This presentation and the associated remarks made during this conference call
                             are integrally related and are intended to be presented and understood together.

                                                                                                                                                 2
Executive Management

Highly experienced executive team with proven leadership in the building products industry

                Executive                 Years Experience                                Past Experience

    Mitchell B. Lewis
                                                30+
    CEO, President and Director                                            CEO                President                 Attorney

     Susan C. O’Farrell                         30+
     CFO and Treasurer                                                                                                  Associate
                                                                Vice President, Finance        Director                  Partner

     Alex Averitt
                                                20+
     Chief Operating Officer
                                                                      CEO, COO, Vice President             General Manager

     Shyam K. Reddy
                                                15+          Chief Administrative Officer, General     Regional
     Chief Transformation Officer                                                                                          Partner
                                                                Counsel & Corporate Secretary        Administrator

     D. Wayne Trousdale                         30+
     Vice Chairman, Operating Companies
                                                                                            CEO / Founder

     Ron Herrin
                                                30+
     VP, Procurement
                                                                        Director, Sales                   General Manager

     Libby Wanamaker
     Chief Human Resources Officer               20+
                                                                     SVP, Human Resources            Manager, Business Consulting

     Justin Heineman                            20+
     General Counsel                                                                                                                 3
                                                                 VP, Chief Corporate Counsel                  Partner
BlueLinx Provides A Compelling Opportunity

Industry leader with opportunity to continue transformative profitable growth

                                      STRONG FOUNDATION FOR SUCCESS

     •   A leading building products distributor with a strong geographic presence East of the Rockies and over
         700 sales associates

         •       Comprehensive product and services portfolio provides opportunity for accelerated growth

             •     Diversified and established customer base offers efficient growth potential

             •      Well-positioned to capitalize on a continued recovery in the U.S. housing market

         •       Synergies from Cedar Creek acquisition estimated to be at least $50 million annually

     •   Capital structure provides financial flexibility to support growth and long term deleveraging plan

                                                                                                                  4
BlueLinx Overview
▪ BlueLinx is a leading wholesale two-step distributor of building NATIONAL FOOTPRINT
and industrial products in the United States
▪ BlueLinx operates 68 warehouses East of the Rockies with
approximately 2,500 employees
▪ Completed transformative acquisition of Cedar Creek in April
2018
▪ Revenue generated from the sale of structural and specialty
products Denotes corporate
headquarters in
▪ Structural and specialty products are utilized in home
Atlanta, Georgia
construction
▪ The company offers over 50,000 branded and private-
label products STRUCTURAL PRODUCTS
Representative
▪ BlueLinx also provides a wide range of value-added services,
Products
including:
▪ Milling & fabrication services Lumber Remesh
▪ “Less-than-truckload” delivery services Plywood Oriented Strand Board
▪ Inventory stocking & automated order processing
Rebar Particleboard
▪ Backhaul services
SPECIALTY PRODUCTS
Representative
▪ Several end markets including new residential and light
Products
commercial construction, industrial OEM, and residential
repair & remodel Outdoor Living Molding
Cedar Roofing & Siding
▪ Bluelinx’s product suite provides a “one-stop” shopping Insulation Engineered Lumber
experience for its customers
5
Wholesale Distributors Critical to the Supply Chain

                     WHOLESALE
                     DISTRIBUTOR

                ▪   Key path to market for
                    most of the lumber
                    building products
                    industry

                ▪   Fill the necessary step
                    between building
                    products manufacturers
                    and "pro dealers", local
                    lumberyards, specialty
                    distributors and big box
                    retailers

                ▪   Particularly value–added
                    with specialty products,
                    with higher inventory
                    and service requirements

                                                      6
Diversified Customer Base

BlueLinx has an extensive roster of high-quality national and regional customers

      Regional                 National           Home Improvement              Industrial               Manufactured
      Dealers                  Dealers                Centers                  Manufacturers               Housing
Contractors, builders,   Contractors, builders,   Retailers with national   Makers of furniture,      Makers of mobile
renovators and other     renovators and other     scale                     sheds, crates and other   homes, prefab homes
end-users                end-users                                          wood-based products       and RVs

                                                                                                                            7
Market Demand Drivers Create a Long Runway for
Ongoing Value Creation
Room To Run: Single family housing growth of 20% just to reach historical average annual growth rates
▪ The Company is well-positioned to continue to grow market share as leading economic indicators continue to paint a favorable
picture for building products and its distribution
RESIDENTIAL CONSTRUCTION REPAIR & REMODELING SPENDING
▪ Meaningful multi-year growth projected ▪ Strong and consistent recovery expected in R&R
spending
▪ Supportive population demographics combined with
aging housing stock ▪ Powerful ongoing, long-term demand drivers such as
home ownership and housing prices
▪ Favorable credit availability
▪ Consumer trends rebounding after prolonged period
▪ Economics of buying remain favorable to renting
of “austerity” during the downturn
SINGLE FAMILY HOUSING STARTS CONSTRUCTION MARKET
2.0
1.5 1969-2018 median
SFH starts: 1.03M
SFHS (inMs)
1.0
0.5
0.0
1969A
1971A
1973A
1975A
1977A
1979A
1981A
1983A
1985A
1987A
1989A
1991A
1993A
1995A
1996A
1998A
2000A
2002A
2004A
2006A
2008A
2010A
2012A
2014A
2016A
2018A
2020E
Source: U.S. Census Bureau. (2018, July 18). Monthly New Residential Construction
8
Two Industry Leaders Merge

                                                                                2017
                                                                           After holding
                          May 2004                                        its investment
     1954                 Cerberus                                         for 13 years,
 Formed as a             purchased       Dec. 2004          2014              Cerberus
  division of           BlueLinx from   Initial Public   New senior           conducts
Georgia-Pacific             G-P           Offering        executive          secondary
                                                         team put in       offering of its
                                                            place              shares
       BlueLinx

                                                                                   April 2018
                                                                                  Completed
                                                                                transformative
                                                                                 acquisition of
                                                                                 Cedar Creek

                                                                              2016
                                              2010        2010 - 2016     New painting
         1977           1982               Acquired by   9 Acquisitions     facility for
       Founded in       First              Charlesbank                     prefinished
       Tulsa, OK     expansion               Capital                       siding line
                    beyond initial          Partners                       completed
                      location

                                                                                                  9
A Complementary Combination Poised for Growth
Compelling combination has created a market leader with a strong breadth of product / service offering
OPERATIONS SERVICES NATIONAL FOOTPRINT
Distribution, milling &
38 locations fabrication, “less-
Headquarters in than-truckload”
Atlanta, GA delivery, inventory
stocking &
2017 sales of automated order
$1.8 billion processing and
backhaul services
30 locations Distribution, milling &
Headquarters in fabrication, custom
Oklahoma City, OK moldings, inventory
11 wood stocking &
manufacturing, 6 automated order
molding, 6 timber processing, backhaul
and 2 prefinished services and
siding facilities prefinished painting
and staining services
2017 sales of
$1.4 billion
10Acquisition Of Cedar Creek Expected To Yield
Significant Cost Savings
Opportunity Description ESTIMATED $50M COST SAVINGS BY
OPPORTUNITY
• Supplier rationalization
Procurement Supply Chain &
• Cost disparity
Network
Supply Chain • Overlap markets ~35%
Efficiencies • Route optimization
General &
• Efficiency improvements
Administrative
Procurement General &
~45% Administrative
~20%
EXPECTED YEAR-END RUN-RATE SYNERGIES
$ in millions
$50
$48 • Costs to achieve synergies
estimated $25 - $40 million, down
from $40 - $55 million originally
• ~$25 million of potential gross
$15 proceeds on sale of owned
BlueLinx real estate in overlap
markets
2018E 2019E 2020E
11Highly Attractive Combined Profile
The combined company will offer potential for significant cost savings to realize improved margins
2017 REVENUE 2017 NET INCOME 2017 ADJ EBITDA & MARGIN2
2.4% 4.1% 4.8%
$3.24B
$154M
Expected
Run-Rate
$137M Cost
Savings:
Expected
Run-Rate ~$50M
$1.82B Cost
Savings:
$1.42B ~$50M
$63M $60M
$44M
$24M
Notes:
1.
2.
2017 BlueLinx audited Financials as of 12/30/2017; 2017 Cedar Creek audited Financials as of 12/31/2017
EBITDA Margin is equal to Adjusted EBITDA / Revenue; Consolidated Adjusted EBITDA includes run rate synergies of $50M
12Cash Flow Generation Supports Deleveraging
The combined company is expected to generate significant cost savings with strong working
capital and real estate to provide strong asset coverage and ability to quickly delever
Based on publicly announced pro
forma funded debt of ~$580 million at ENHANCED LEVERAGE PROFILE
close1
Leverage o ~$400M drawn at close 6.4x
o $180M First Lien Term Loan
(with favorable call features)
▪ BlueLinx has high-quality ABL
collateral, significantly exceeding the
total net ABL debt
~4.0x
o Inventory with quick turnover and
low obsolescence
o Low bad debt expense over the ~2.5x – 3.0x
last three years
Liquidity
o Low customer concentration
~$150 - $160M value of owned real
estate based on recent appraisals
o Real estate appraised at ~4.0x
2017 year-end net book value
BXC 2017 Combined Projected
Excess availability plus cash of Year End2 Q1 20183 Q4 2019
$157M at closing
Notes:
1. Pro Forma ABL Revolver and term loan debt as of Q1 2018
2. ABL debt of $183M plus $98M mortgage / 2017 Adj. EBITDA of $44M
3. Pro Forma ABL Revolver and term loan debt as of Q1 2018 /2017 Combined Adj. EBITDA plus run-rate cost savings of $50M 13Strategic Initiatives
1 2 3
Successful Integration Emphasize Sales Enhance Margins
of Two Companies Growth
Over $3 billion of Emphasize local Emphasis on products
addressable spend for customer interaction and markets with high
cost savings to grow market share margin profiles
opportunities
Develop and deploy Differentiate offering
Identifiable and best practices in based on customer
achievable cost selling processes characteristics
savings of at least
Utilize broad product Maintain price
$50M through supply
offering across vast discipline with
chain, G&A and
distribution network systematic pricing
procurement
processes
Dedicated leadership
team assigned to
integration
14Investment Considerations
1 ABILITY TO CAPITALIZE ON STRONG HOUSING MARKET MOMENTUM
2 REALIZATION OF AT LEAST $50 MILLION IN SYNERGIES FROM CEDAR CREEK ACQUISITON
3 RECOGNIZED LEADER IN A CONSOLIDATING INDUSTRY
4 CAPITAL STRUCTURE PROVIDES FINANCIAL FLEXIBILITY AND LONG TERM DELEVERAGING
15Appendix
Non-GAAP And Supplementary Financial Measures

 BlueLinx reports its financial results in accordance with GAAP, but we also believe that presentation of certain
 non-GAAP measures, as well as GAAP-based and non-GAAP supplemental financial measures, may be useful
 to investors and may provide a more complete understanding of the factors and trends affecting the business
 than using reported GAAP results alone. We caution that non-GAAP measures and supplemental financial
 measures should be considered in addition to, but not as a substitute for, our reported GAAP results.

 Adjusted EBITDA. We define Adjusted EBITDA as an amount equal to net income plus interest expense and
 all interest expense related items, income taxes, depreciation and amortization, and further adjusted to exclude
 certain non-cash items, and other adjustments to Consolidated Net Income, including, as applicable,
 compensation expense from SARs, and one-time charges associated with the legal, consulting, and
 professional fees related to the Cedar Creek acquisition, and interest charges on debt modification fees under
 the CMBS mortgage payoff in the first quarter of fiscal 2018.

 We present Adjusted EBITDA because it is a primary measure used by management to evaluate operating
 performance and, we believe, helps to enhance investors' overall understanding of the financial performance
 and cash flows of our business. We believe Adjusted EBITDA is helpful in highlighting operating trends. We
 also believe that Adjusted EBITDA is frequently used by securities analysts, investors and other interested
 parties in their evaluation of companies, many of which present an Adjusted EBITDA measure when reporting
 their results. However, Adjusted EBITDA is not a presentation made in accordance with GAAP, and is not
 intended to present a superior measure of the financial condition from those determined under GAAP. Adjusted
 EBITDA, as used herein, is not necessarily comparable to other similarly titled captions of other companies due
 to differences in methods of calculation.

                                                                                                                    17
Reconciliation of GAAP to Adjusted Measures
2017 Adjusted EBITDA Reconciliation
BlueLinx Cedar Creek Combined
Net income (loss) $63 $24 $87
Adjustments:
Depreciation and amortization 9 14 23
Interest expense 21 10 31
Provision for (benefit from)
income taxes (53) 8 (45)
Other 4 4 8
Adjusted EBITDA $44 $60 $104
18Please reference our Financial
Information and SEC Filings
available on our website
www.BlueLinxCo.comYou can also read