Vodafone Group Plc Q1 FY21 Trading Update 24 July 2020 - #StayConnected - Vodafone IR

Page created by Renee Turner
 
CONTINUE READING
Vodafone Group Plc Q1 FY21 Trading Update 24 July 2020 - #StayConnected - Vodafone IR
Vodafone Group Plc
Q1 FY21 Trading Update
24 July 2020

        #StayConnected
Vodafone Group Plc Q1 FY21 Trading Update 24 July 2020 - #StayConnected - Vodafone IR
Agenda & contents

Highlights    Nick Read                 p3
              Chief Executive

Trading       Margherita Della Valle    p7
performance   Chief Financial Officer

Appendices                              p13                          We connect for a better future

                                                                A leading technology communications
                                                              company building an inclusive, sustainable
                                                                            digital society

                                                Q1 FY21
                                                                                                           2
                                             Trading Update
Vodafone Group Plc Q1 FY21 Trading Update 24 July 2020 - #StayConnected - Vodafone IR
Highlights ⫶ Trading in-line with expectations, Tower IPO early 2021

       Commercial                    Strategic                                 Social
       performance                   progress                                 contract

 • Good commercial            • Deepening customer                 • Supporting society             • Europe’s leading tower
   performance during           engagement – stronger                    through our essential        infrastructure company
   lockdown                     customer loyalty                         infrastructure
                                                                                                    • 68k macro sites across
 • Q1 service revenue         • Accelerating digital               • Donated >€100m in                9 markets
   -1.3% (Q4: 1.6%)             transformation – digital                 direct contributions &
                                sales +50% YoY                           services in-kind           • Facilitating network
 • Resilient trading in                                                                               sharing across Europe
   Germany, SR growth flat    • Improving asset                    • Actively looking to
                                utilisation                              support the ‘recovery’     • Driving operational
 • 1.6ppt roaming & visitor                                              phase                        synergies through
   impact from COVID-19       • Optimising the portfolio                                              enhanced focus
                                 - VHA/TPG merger                  • Engaging with policy
 • Reconfirming FY21 free        - Egypt MoU extended                    makers to accelerate the   • On track for Frankfurt
   cash flow guidance            - Vantage Towers                        digital agenda               IPO in early 2021

                                                           Q1 FY21
                                                                                                                               3
                                                        Trading Update
Vodafone Group Plc Q1 FY21 Trading Update 24 July 2020 - #StayConnected - Vodafone IR
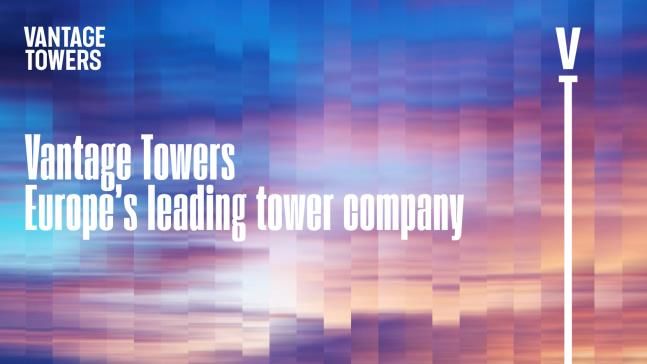
Trading update ⫶ Good commercial performance during lockdown
        7th consecutive quarter of improved loyalty1                                                                         Broadband net additions stable2
                                                                       YoY churn                                                                                                    Broadband                                 Converged
                                                                                                                                                                                                                  NGN
                                                                       reduction
                                                                                                                                                                       417                             421                    429
                                                                                                                                       370

                (0.6ppt)   (0.5ppt)                                                                       237                                                                                                           230
                                                 (0.8ppt)                                                                                                     205                             214
     (1.4ppt)                                               (1.1ppt)
                                      (1.6ppt)                                                                                142              132                              142                            141
                                                                                                                115                                                                                                                 105
                                                                                                    54
                                                                       (3.2ppt)

     Q3 19      Q4 19      Q1 20      Q2 20      Q3 20      Q4 20      Q1 21                             Q1 20                      Q2 20                           Q3 20                           Q4 20                 Q1 21

                           Commercial actions                                                                                                    Commercial focus

 •   Competing effectively in high/mid/low tiers                                                    •     Winning ‘fair share’ across all market segments
 •   Reducing ATL reliance – digital CRM, in-house marketing                                        •     Driving ARPU accretion across our customer base
 •   Selling ‘one more product’ to customers                                                        •     Greater demand for u/l mobile & high-speed broadband
 •   Increasing loyalty programme penetration                                                       •     Launched customer ‘delight’ initiatives
 •   Supporting Businesses – developing new propositions                                            •     New offers – thermal cameras, smart tracker (Curve)
                                                                                                            1. European mobile contract churn – excludes inactive data only SIM losses in Italy during Q3 to Q4 FY20
                                                                                      Q1 FY21               2. European fixed broadband additions - includes acquired Unitymedia and UPC assets from Q2 20 onwards                        4
                                                                                   Trading Update
Vodafone Group Plc Q1 FY21 Trading Update 24 July 2020 - #StayConnected - Vodafone IR
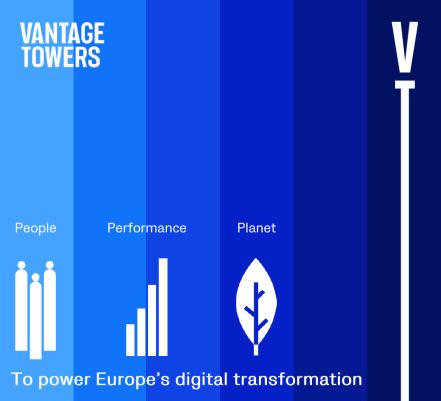
Social contract ⫶ Supporting Governments’ digital agenda…
  Governments’ digital                      Vodafone’s                                   Policy
       priorities                      5-point response plan                           objectives

 Roll-out of next-generation,           Expand & future-proof our           Healthy, sustainable market structure
      resilient networks                network infrastructure
                                                                             Pro-investment and pro-innovation
                                        Accelerate support to                       regulatory approach
                                        Governments (eHealth, eEducation)
                                                                             End of extractive spectrum auctions
   Restarting economy &                 Enhance digital accessibility &
      supporting jobs                   literacy for the most vulnerable
                                                                                Vendor supply chain diversity
                                        Promote widespread digital
                                        adoption for business
                                                                              Supportive deployment regulation

    Digital access & skills             Support exit strategies through
                                        targeted digital adoption           Defined framework for network sharing

         …promoting a healthier, sustainable industry & enabling a fair return on capital employed
                                                    Q1 FY21
                                                                                                                    5
                                                 Trading Update
Vantage Towers ⫶ Europe’s leading tower infrastructure company
                                                                      Vivek             Thomas               Sonia
                                                                      Badrinath         Reisten              Hernandez
                                                                      CEO               CFO                  CCO
The brand

                                                         The team
                                                                      Christian         Jose                 Nikolaus
                                                                      Sommer            Rivera               Rama
                                                                      General           CTO                  HR Director
                                                                      Counsel

                                                                           68k                    #1 or #2
Mission & values

                                                                        macro sites               in most markets

                                                         Key facts
                                                                          9 markets               90% revenues
                                                                        across Europe             from anchor tenant

                     Further information available at investors.vodafone.com
                                               Q1 FY21
                                                                                                                    6
                                            Trading Update
Trading performance
Margherita Della Valle
Chief Financial Officer
Q1 trading ⫶ Performance in-line with expectations
                                         YoY quarterly service revenue growth
                                                                                                                                   • COVID-19 impact largely driving QoQ movement
          1.6%

          1.1%
                     Europe            Group                                             1.6%

                                                    0.7%
          0.6%

                                                                       0.8%
          0.1%

                                                                                (0.4)%
                                                                                                                                   • Germany performance resilient
         -0 .4%

                            (0.2)%
                                           (1.4)%                                                             (1.3)%1
                                                                                                                                   • Rest of Europe
         -0 .9%

                                                              (1.4)%
         -1 .4%
                   (1.7)%
         -1 .9%

         -2 .4%
                                                                                                    (2.6)%1                           - Good underlying commercial momentum
         -2 .9%

                                                                                                                                      - Significant roaming & visitor impacts
                       Q1                       Q2                Q3                Q4                   Q1
                      FY20                     FY20              FY20              FY20                 FY21                          - B2B project delays
                                                                                                                                   • Vodacom
                                                Contribution to Q1 SR growth
                                                                                                                                      - South Africa: strong data & voice usage
  80 00.0%

                                                                                            20bps
                                                                                                              60bps                   - International: macro-economic pressure
  30 00.0%

                    Flat
 -2 000.0%

                                     (20bps)
 -7 000.0%

                                                    (40bps)                                                                                 FY21 EBITDA outlook: flat to slightly down2
                                                                (70bps)       (80bps)
                                                                                                                                         FY21 guidance: FCF (pre-spectrum) at least €5bn2
-1 2000 .0 %

                  Germany             UK             Other      Spain         Italy      Vodacom         Other
                                                    Europe                                              markets

                                                                                                                                           1. Includes Unitymedia and UPC assets as of Q1 FY21
                                                                                                                           Q1 FY21         2. Based on prevailing assessments of global macro-economic outlook   8
                                                                                                                        Trading Update
COVID-19 ⫶ Driving service revenue slowdown
            Q4 FY20 to Q1 FY21 service revenue growth movement                                           Roaming & visitors

2.0
                     COVID-19 impact              Non-COVID-19 related                                    -          c.70% reduction across Europe
                                                                                                          -          Non-EU related roaming down c.85%
1.5                                                                                                                  – no near-term recovery expected

1.0
           1.6%           (1.6%)1
                                                                                                         Business
0.5
                                                                                                          -          Deferral in project work
0.0                                                                                                       -          Automotive – lower activity
                                        (0.5%)
                                                                                                          +          Increased working from home
-0.5
                                                                           (1.3%)
                                                         (0.8%)
-1.0                                                                                                     Other

-1.5                                                                                                      -          Prepaid top-up access challenges
                                                                                                          -          Macro economic pressure & M-Pesa free P2P
-2.0                                                                                                                 transfers in Vodacom Internationals
          Q4 FY20
         SR growth
                        Roaming
                        / visitors
                                       Business          Other            Q1 FY21
                                                                         SR growth
                                                                                                          -          Competitive pressures in Greece & Ireland
                                                                                                          +          Partially offset by out-of-bundle traffic elasticity

                                                                                                     1. The reduction in roaming and visitor revenue & prepaid SIM sales to tourists and migrant workers
                                                                                       Q1 FY21
                                                                                                                                                                                                           9
                                                                                    Trading Update
Germany ⫶ Resilient performance with good underlying momentum
              34% of Group EBITDA1

Service revenue growth                                               Unitymedia in        Net customer additions (‘000)
                                                                     organic SR
                                                                                                                                                      190
                            2.0%                                                2.0%

                                                                     from FY21                  DSL                            19 0

                                                                                                                                                             160
                            1.5%                                                1.5%
                                                                                                Cable
                                     1.6%
         Retail 2                                                                               Cable (pro-forma)
                                                                                                                               14 0

                                                                                                                                                                    118
                                                     1.3%
                            1.0%

                                                            1.2%                1.0%

                                                                                                                                                       12
                                                                                                Mobile contract                 90

                                                                                                                                         74                                573
         Reported organic                   0.9%                                                                                                             153
                                                                                                                                         35                         118
         service revenue
                            0.5%                                                0.5%

                                                                        0.4%
                                                                                                                                40

                                                                                                                                                       75                   74
         growth
                                     0.4%                                                                                                35
                            0.0%                                                0.0%

                                                                                                                               -10
                                                                                                                                        (11)
                                                     0.0%              0.0%                                                                           (46)
                                                            (0.1%)                                                                                           (60)          (44)
                            -0 .5%
                                            (0.2%)                              -0 .5%

                                                                                                                               -60
                                                                                                                                                                    (48)
                                      Q1     Q2       Q3     Q4         Q1                                                             Q1              Q2     Q3     Q4     Q1
                                     FY20   FY20     FY20   FY20       FY21                                                           FY20            FY20   FY20   FY20   FY21

• Roaming & visitor drag (-1ppt)                                                           •     Good cable growth despite lockdown
      - partially offset by increased usage                                                •     1.8m broadband customers on plans 400+Mbps
• Stable fixed SR growth +2.4%                                                             •     New harmonised TV offer from August
                                                                                           •     Integration on track
                                                                                                        1. Based on FY20 EBITDA contribution
                                                                                  Q1 FY21               2. Pro-forma for Unitymedia in FY20                                       10
                                                                               Trading Update           3. Includes Unitymedia migrations of 63,000
Other markets ⫶ Solid commercial performance, impacted by COVID-19
                     Service revenue
                                                                Market                                                                  Performance
                       growth (%)

    14% of Group                             • Competition remains challenging                                             • Net neutral on mobile number portability
    EBITDA1         -6.5% (Q4: -3.7%)        • Lapping price increases in Q2                                               • +45k broadband customer additions

    10% of Group                             • Inflationary price increases implemented                                    • Mobile contract net adds +61k
    EBITDA1         -1.9% (Q4: +1.2%)        • Delay in large corporate activity                                           • Record broadband net additions, +74k2

                                             • Mobile and fixed ports back to pre-COVID                                    • Revenue impacted by extensive lockdown
    7% of Group                                levels in June                                                                measures
    EBITDA1         -6.9% (Q4: -2.7%)
                                             • Increase in price & promotional intensity                                   • Good commercial momentum maintained

                                             • Increased competition in Ireland &                                          • Resilient consumer fixed performance
     12% of Group                              Greece
     EBITDA1        -3.1% (Q4: +3.4%)                                                                                      • UPC & AbCom integrations on track
  Other Europe
                                             • Prepaid top-up challenges

    14% of Group                             • SA: lockdown driving increased usage                                        • SA: Data volume growth +101%
    EBITDA1         +1.5% (Q4: +3.2%)        • Internationals: lower economic activity                                     • M-Pesa: zero rating P2P transfers
                       South Africa: +6.4%
                      International: -5.2%

                                                            Q1 FY21       1. Based on FY20 EBITDA contribution
                                                                          2. Excludes a customer base restatement of 32k                                             11
                                                         Trading Update
Summary ⫶ Creating sustainable value for all stakeholders
 Deepening     Accelerating
  customer        digital
engagement    transformation

Improving      Optimising
                               Strategic priorities ⫶ momentum maintained during lockdown
   asset          the
utilisation     portfolio

                               Resilient trading ⫶ in-line with our expectations

                               Vantage Towers ⫶ on track for early 2021 IPO

                               Social contract ⫶ strong engagement with Governments

                                                            Q1 FY21
                                                                                            12
                                                         Trading Update
I     Definitions              p14
II    Supporting information   p15
III   Importance notice        p16
                                                 Appendices

                                   Q1 FY21
                                                              13
                                                              13
                                Trading Update
Appendix I ⫶ Definitions
Term          Definition                                                                  Term      Definition

Adds          Customer additions within a defined period                                  MTM       Mark-to-market or fair value accounting refers to accounting for
                                                                                                    the value of an asset or liability based on the current market price
AI            Artificial intelligence / machine learning                                            of the asset or liability

Churn         Total gross customer disconnections in the period divided by                NGN       Fibre or cable networks typically providing high-speed broadband
              the average total customers in the period                                             over 30Mbps

Converged     A customer who receives both fixed and mobile services (also                On-net    Direct connections to Vodafone owned or operated fixed-line
              known as unified communications) on a single                                          infrastructure
              bill or who receives a discount across both bills
                                                                                          Organic   An alternative performance measure which presents performance
EBIT          Earnings before interest & tax                                              growth    on a comparable basis, in terms of M&A activity, movements in
                                                                                                    foreign exchange rates and the impact of the implementation of
EBITDA        Earnings before interest, tax, depreciation & amortisation                            IFRS 16 ‘Leases’

EPS           Earnings per share
                                                                                          Roaming   Allows customers to make calls, send and receive texts and data
FCF           Free cash flow                                                                        on other operators’ mobile networks, usually
                                                                                                    while travelling abroad
Gbps / Mbps   Gigabits (billions) / megabits (millions) of bits per second
                                                                                          ROCE      Return on capital employed
IoT           Network of physical objects embedded with electronics,
              software, sensors & network connectivity, including built-in                Service   Service revenue comprises all revenue related to the provision of
              mobile SIM cards, that enables collection of data & exchange                revenue   ongoing services including, but not limited to, monthly access
              communications with one another or a database                                         charges, airtime usage, roaming, incoming and outgoing network
                                                                                                    usage by non-Vodafone customers and interconnect charges for
MNP           Mobile number portability                                                             incoming calls

                                                                                Q1 FY21
                                                                                                                                                                           14
                                                                             Trading Update
Appendix II ⫶ Supporting information
1.    Quarterly revenue                             The information opposite is available in spreadsheet format
2.    Adjusted income statement                                    via investors.Vodafone.com
3.    Segmental information
4.    Income statement information
5.    Cash flow
6.    Mobile customers
7.    Fixed-line broadband customers
8.    Marketable homes passed
9.    TV & fixed-line voice customers
10.   Converged customers
11.   Mobile customer churn
12.   Mobile ARPU
13.   Average foreign exchange rates
14.   Average FX rates

                                           Q1 FY21
                                                                                                              15
                                        Trading Update
Appendix III ⫶ Important notice
By accessing these slides, you agree to be bound by the following conditions. You may not              Forward-looking statements are sometimes, but not always, identified by their use of a date in
disseminate these slides or any related recording, in whole or in part, without the prior              the future or such words as “plans”, “targets” “gain”, “grow”, or “accelerate” (including in their
consent of Vodafone. Information in this presentation relating to the price at which relevant          negative form). By their nature, forward-looking statements are inherently predictive,
investments have been bought or sold in the past or the yield on such investments cannot be            speculative and involve risk and uncertainty because they relate to events and depend on
relied upon as a guide to the future performance of such investments.                                  circumstances that may or may not occur in the future. There are a number of factors that
                                                                                                       could cause actual results and developments to differ materially from those expressed or
This presentation does not constitute an offering of securities or otherwise constitute an
                                                                                                       implied by these forward-looking statements.
invitation or inducement to any person to underwrite, subscribe for or otherwise acquire or
dispose of securities in any company within the Vodafone Group.                                        A review of the reasons why actual results and developments may differ materially from the
                                                                                                       expectations disclosed or implied within forward-looking statements can be found under
This presentation also contains non-GAAP financial information which Vodafone’s
                                                                                                       “Forward-looking statements” and “Risk management” in the Vodafone Group Plc Annual
management believes is valuable in understanding the performance of the Vodafone Group.
                                                                                                       Report for the year ended 31 March 2020. The Annual Report can be found at
However, non-GAAP information is not uniformly defined by all companies and therefore it
                                                                                                       investors.vodafone.com.
may not be comparable with similarly titled measures disclosed by other companies,
including those in the Vodafone Group’s industry. Although these measures are important in             All subsequent written or oral forward-looking statements attributable to Vodafone, to any
the assessment and management of the Vodafone Group’s business, they should not be                     member of the Vodafone Group or to any persons acting on their behalf are expressly
viewed in isolation or as replacements for, but rather as complementary to, the comparable             qualified in their entirety by the factors referred to above. No assurances can be given that the
GAAP measures.                                                                                         forward-looking statements in or made in connection with this presentation will be realised.
                                                                                                       Any forward-looking statements are made as of the date of this presentation. Subject to
References to Vodafone are to Vodafone Group Plc and references to Vodafone Group are to
                                                                                                       compliance with applicable law and regulations, Vodafone does not intend to update these
Vodafone Group Plc and its subsidiaries unless otherwise stated. Vodafone, the Vodafone
                                                                                                       forward-looking statements and does not undertake any obligation to do so.
Speech Mark Devices, Vodacom and The future is exciting. Ready? are trade marks owned by
Vodafone. Vantage Towers is a trademark owned by Vantage Towers. Other product and
company names mentioned herein may be the trade marks of their respective owners.
This presentation, along with any oral statements made in connection therewith, contains
“forward- looking statements” including within the meaning of the US Private Securities
Litigation Reform Act of 1995 with respect to the Vodafone Group’s financial condition, results
of operations and businesses, the Vodafone Group’s FY21 EBITDA outlook and FCF
(pre-spectrum) guidance and certain of the Vodafone Group’s plans and objectives.

                                                                                               Q1 FY21
                                                                                                                                                                                                      16
                                                                                            Trading Update
Group
   Investor
                   www.vodafone.com/investors                Upcoming events
   Relations
                   ir@vodafone.co.uk

                   1 Kingdom Street, London, W2 6BY
                                                       28     Annual General Meeting
                                                      July
Matthew Johnson
Director           matthew.johnson@vodafone.com
Group IR

Daniel Morris
Deputy Director
Group IR
                   daniel.morris@vodafone.com         17      H1 FY21 Results
                                                      Nov
Roy Teal
Deputy Executive   roy.teal@vodafone.com
Group IR

Victoria Garnham                                       3      Q3 Trading Update
Access Manager     victoria.garnham@vodafone.com
Group IR                                              Feb
You can also read