HSBC Commercial Banking - Barry O'Byrne, CEO, CMB April 2021
←
→
Page content transcription
If your browser does not render page correctly, please read the page content below

HSBC Commercial Banking
Barry O’Byrne, CEO, CMB
April 2021

CMB Appendix
Commercial Banking – Introduction
Global franchise with presence in 53 markets generating significant value for the Group
FY2020 Performance1 Value Generated for the Group
Adjusted $13.3bn Credit & $5.6bn Adjusted Revenue RWAs
Revenue 12% ($1.9bn) Lending 4% ($0.2bn)
$13.3bn $328bn
26% 38%
Adjusted $4.75bn Customer $470bn 38%
ECLs >200% ($3.6bn) deposits $50.4bn $857.5bn
18% ($73bn)
Adjusted $6.7bn $328bn CMB
RWAs
Costs 2% ($0.1bn) 1% ($5bn)
Rest of Group
Recognised Market-Leading International Transaction Bank
#1 Global Trade Finance Bank for fourth consecutive year2 Best Global Cash Manager for ninth consecutive year5
Improved GTRF market share at 9% in Asia (+28bps)3 Best Cash Management service provider across 22 markets6
c.15% GTRF market share in both Hong Kong and Singapore4
1
1. All financial data is presented on an adjusted basis (an alternative performance measure). For a reconciliation of reported to alternative performance measures, see the HSBC Holdings plc Annual Report and Accounts 2020. For definitions, refer to the HSBC Holdings plc Annual
Report and Accounts 2020. 2. Euromoney 2021 Trade Finance Survey 3. OW Coalition 3Q20 revenue benchmarking report. 4. Market share by HKMA and MAS 5. Best Global Cash Manager by Corporates - Euromoney Cash Management Survey 2020. 6. Best domestic cash
manager - Euromoney Cash Management Survey 2020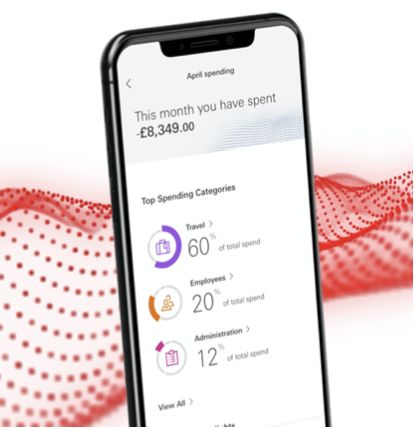
CMB               Appendix
   Commercial Banking – Introduction

    Strong franchise with clear participation strategy aligned with our competitive advantage

    Deep coverage across customer segments                                                            Distinct participation models                        Few competitors match coverage

                                           Global                                                                                                                    Global peers
                                          Banking

                            c.8k         Large                                                      Full            Corporate     Corporate   Corporate
                                       Corporate                                                    Participatio    &                         overseas
                                     ($500m-5bn)                                                    n               Business                  subs. only
                                                                                                    Corporate       Banking                                   Entrepreneurial heartland
                                     Mid Market                                                     BB Upper        Upper                                      CMB’s ‘sweet spot’
                   c.26k
                                      Corporate                                                     BB Mass
                                                                                                                                                                   Providing deep,
                                     ($50-500m)                                                                                                                international coverage

                           Business Banking Upper
                                  ($5-50m)
     c.1.3m
                                                                                                                                                                  Regional & local
                           Business Banking Mass                                                                                                                    competitors
                                  ($0-5m)

                                                                                                                                                                                            2
1. As at 31 December 2020 excludes Hang Seng. Large Corporates includes Corporate Real Estate customers
CMB                         Appendix
Commercial Banking – Financial Performance

Well-diversified revenue streams targeted at entrenching relationships across products and geographies

FY20 adjusted revenue by product ($bn)                                                                                      FY20 adjusted revenue by market1 ($bn)

                                                                                                                                   3.6
                     Markets products,
                   Insurance and Other3                               Credit & Lending
                                                                                                                                                    3.4
                                                                                                                                                                                                                     x      % of total revenue

                                              14%
                                                                                                                                                                     2.4
     Global Trade &
Receivables Finance
                                13%                                                                                                                                                    1.8
                                                                                  42%
                                                $13.3bn                                                                                                                                                 1.2

                                                                                                                                                                                                                         0.6              0.6

                                            31%
                  Global Liquidity &                                                                                          Hong Kong HSBC UK                    Rest of          North            Rest of           Latin            MENA
                 Cash Management2                                                                                                                                   Asia           America           Europe4          America
                                                                                                                                 27%                25%              18%              13%               9%                4%               4%

Note: numbers presented on an adjusted basis and totals may not cast due to rounding. 1. Market breakdown excludes amounts relating to intercompany eliminations which have been booked outside of the regions and consolidated at a
Global level 2. GLCM includes payments and cash management, current accounts, and savings deposits 3. Includes revenue from Foreign Exchange, insurance manufacturing and distribution, interest rate management and Global Banking
products. It also includes an allocation revenue relating to Markets Treasury, Holdings interest expense and Argentina hyperinflation. 4. Rest of Europe includes the elimination of intercompany transactions between HSBC UK and the rest of   3
Europe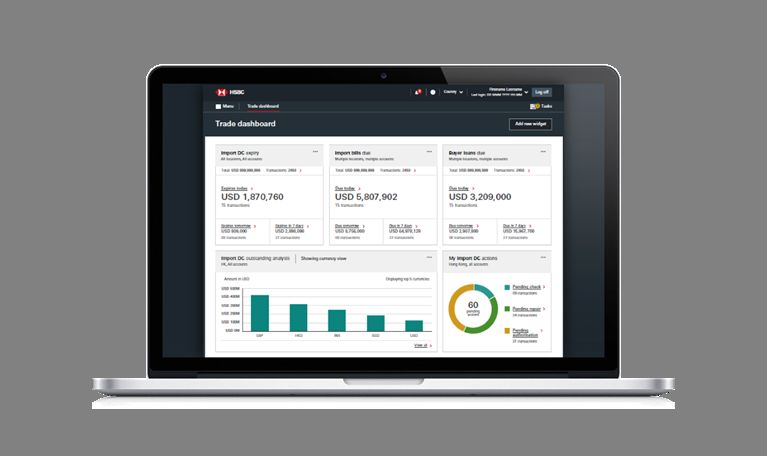
CMB Appendix
Commercial Banking – Strategy
Significant investment of c.$2bn planned over 5 year period to accelerate growth and future-proof franchise
Strategic priorities 2020 Achievements
8% increase in international account openings year-on-year1
1 Enable our customers to internationalise
International Subsidiary Banking deposits grew 23%2
151%3 increase in volume of payments through HSBCnet mobile
Continue to leverage transaction banking as our core Launched next generation virtual accounts in 8 markets
2
strength Deployed market-leading supply chain cloud platform in 13 markets (c. 40% volume)
with 100% digital client and supplier experience
100% online account opening in Hong Kong
Focus on Asia for growth, investment and capital
3 deployment Launched digital multicurrency wallet, enabling customers to pay
& receive like a local, an answer to international money transfer challengers
Integrated client management system live across 50 markets
Innovate our business model to stay relevant for our
4 customers
Supporting clients transitioning to sustainable solutions and supply chain resilience
Business to Business platform Serai connecting +3.2k businesses
Collaborate across business lines so we can operate as Strong collaboration revenues, especially in Europe and US
5 partners Growing referrals in Wealth and Private Bank, particularly in Asia
4
1. FY 20 vs FY 19 2. FY20 vs FY19 3. Increase in wholesale customer payments FY20 vs FY19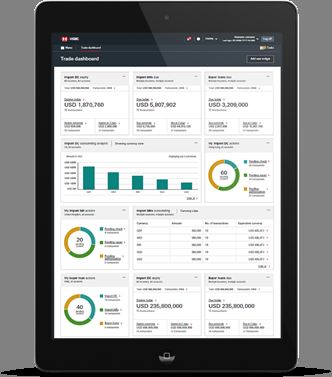
CMB Appendix
Commercial Banking – Strategy
Delivering Digital Services for our customers: Transaction Banking
Global Wallet, Multi-Currency Account Trade, Transforming and Digitising
Enable customers to manage, send, and spend like a local Full suite of product capabilities across Core and
with real-time FX rates Structured Trade
Transact across 6 currencies without need of local accounts New trade platform in HSBCnet live in Hong Kong
Commercial launch in Singapore of mobile-first 2k Hong Kong customers benefiting from enhanced
proposition, meeting international banking needs experience
5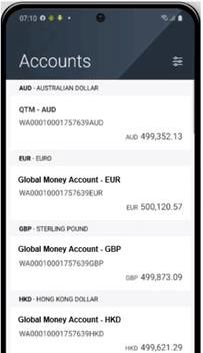
CMB Appendix
Commercial Banking – Strategy
Delivering Digital Services for our customers: Business Banking
Kinetic, Mobile-First Business Banking Proposition in the UK Business Banking, New Mobile Experience
Built on the cloud, a truly mobile-first banking service designed for Our new digital experience (BBX) for Business Banking customers
small businesses in the UK
Digital channel connecting customers to their transactional banking
Simple, user-friendly experiencing, enabling same-day onboarding needs
and insights for customers
49k customers using BBX across 9 markets
>5k1 users; 4.7 / 5.0 iOS App store rating; 93%2 satisfaction rating
1. As at 26 March 2021
2. In January 2021 6CMB Appendix
Commercial Banking – Supporting Our Customers
Extending support to customers during a period when they needed it most
Value of drawn loans under market-wide schemes $bn Supporting customers Customers Feedback
“ When we needed you most,
you w ere there for us. Your
personal actions on our behalf
+24% -22% have literally saved my business
Supported 237k1 customers globally through and the jobs of my employees “
government and HSBC schemes
Digital credit portals for government schemes “HSBC supported us very
deployed in 6 days2 (average) strongly through that period,
we were able to get our credit
facility approved in record time.
Majority of branches and call centres remained
open throughout the pandemic
40.2 “ You have tak en tremendous
32.4 31.2 100% of Relationship Managers digitally care of us and have helped and
enabled to stay connected to customers supported us through this very
challenging and difficult phase.”
“HSBC is our trusted advisor in
the good times and the bad
times“
2Q20 3Q20 4Q20
7
1. As at 31 December 2020 for wholesale lending 2. Average time taken to deploy UK lending portals. 3. Based on an average of 14,000 loans processed p.a.CMB Appendix
Key Highlights of CMB
Significant businesss with diversified revenue streams across products and geographies
Digitising through c. $2bn of planned investments over 5 year period
A franchise with the position and ability to serve SMEs and MMEs globally
Customer-centric franchise that have supported over 237k businesses through relief measures during Covid-19
Driving capital efficiency by reducing non-strategic RWAs by $13bn in 2020
8Appendix
9CMB Appendix
Commercial Banking – Financial Performance
Adjusted Financial Performance (FY20)
Adjusted Revenue 12% lower mainly in GLCM and other
$m FY20 FY19 Δ products due to lower global interest rates
GTRF 1,744 1,826 (4)%
Credit and Lending 5,640 5,421 4% Adjusted PBT of $1.9bn down $5.3bn (74%) vs FY19,
primarily from higher ECL and lower revenue, partly offset by
GLCM 4,178 5,932 (30)%
lower costs
Markets products, Insurance and Other1 1,750 1,985 (12)%
Revenue 13,312 15,164 (12)% Adjusted ECL $3.6bn higher reflecting global impact of
Covid-19 on forward economic outlook
ECL (4,754) (1,162) >(200)%
Costs (6,689) (6,832) 2% Adjusted costs decreased 2% vs FY19 continued
Share of profits in associates and JVs (1) 0 - investment was offset by reductions in discretionary spending
Adjusted PBT and cost saves
1,868 7,170 (74)%
Significant items and FX translation (229) (3,011) (92)% Customer loans decreased $11bn (3%) vs. FY19 primarily
Reported PBT 1,639 4,159 (61)% due to lower trade and overdraft balances, partly offset by
government scheme lending
$m FY20 FY19 Δ
Customer loans 343,182 353,781 (3)% Customer deposits increased $73bn (18%) vs. FY20 as
customers held liquidity
Customer deposits 470,428 397,182 18%
RWAs 327,734 332,543 (1)% RWAs down $5bn (1%) vs FY19 as we delivered $13bn
RoTE, %2 1.3% 13.0% (11.7)ppts transformation programme reductions, which mitigated an
increase from asset quality deterioration
1. Includes Markets Treasury allocations, Holdings interest expense and Argentina hyperinflation. 2. RoTE excluding significant items and UK bank levy.
10CMB Appendix
Commercial Banking – Financial Performance
Geographic financial performance (FY20)
Adjusted income Of which: Of which: North Latin
Asia Europe MENA
statement, $m Hong Kong HSBC UK America America
NII 4,408 2,645 2,782 2,400 1,223 515 390
Other Income 1,638 989 1,810 965 580 91 213
Revenue 6,046 3,634 4,592 3,365 1,803 606 603
ECL (1,565) (489) (2,022) (1,611) (496) (282) (388)
Costs (2,531) (1,355) (2,890) (1,534) (930) (344) (334)
Associates 0 0 0 0 0 (1) 0
Profit/(loss) before tax 1,950 1,790 (320) 220 377 (21) (119)
Significant items (6) (3) (209) (52) (11) (1) (1)
Reported profit/(loss)
1,944 1,787 (529) 168 366 (22) (120)
before tax
Of which: Of which: North Latin
Balance sheet, $bn Asia Europe MENA
Hong Kong HSBC UK America America
Net customer loans 156 99 126 91 44 7 11
Customer deposits 190 131 201 135 63 8 9
Reported RWAs 139 72 115 80 49 10 15
11Disclaimer
Important notice
The information, statements and opinions set out in this presentation and accompanying discussion (“this Presentation”) are for informational and reference purposes only and do not constitute a public offer for the purposes of any applicable law or
an offer to sell or solicitation of any offer to purchase any securities or other financial instruments or any advice or recommendation in respect of such securities or other financial instruments.
This Presentation, which does not purport to be comprehensive nor render any form of legal, tax, investment, accounting, financial or other advice, has been provided by HSBC Holdings plc (together with its consolidated subsidiaries, the “Group”)
and has not been independently verified by any person. You should consult your own advisers as to legal, tax investment, accounting, financial or other related matters concerning any investment in any securities. No responsibility, liability or
obligation (whether in tort, contract or otherwise) is accepted by the Group or any member of the Group or any of their affiliates or any of its or their officers, employees, agents or advisers (each an “Identified Person”) as to or in relation to this
Presentation (including the accuracy, completeness or sufficiency thereof) or any other written or oral information made available or any errors contained therein or omissions therefrom, and any such liability is expressly disclaimed.
No representations or warranties, express or implied, are given by any Identified Person as to, and no reliance should be placed on, the accuracy or completeness of any information contained in this Presentation, any other written or oral information
provided in connection therewith or any data which such information generates. No Identified Person undertakes, or is under any obligation, to provide the recipient with access to any additional information, to update, revise or supplement this
Presentation or any additional information or to remedy any inaccuracies in or omissions from this Presentation. Past performance is not necessarily indicative of future results. Differences between past performance and actual results may be
material and adverse.
Forward-looking statements
This Presentation may contain projections, estimates, forecasts, targets, opinions, prospects, results, returns and forward-looking statements with respect to the financial condition, results of operations, capital position, strategy and business of the
Group which can be identified by the use of forward-looking terminology such as “may”, “will”, “should”, “expect”, “anticipate”, “project”, “plan”, “estimate”, “seek”, “intend”, “target” or “believe” or the negatives thereof or other variations thereon
or comparable terminology (together, “forward-looking statements”), including the strategic priorities and any financial, investment and capital targets described herein. Any such forward-looking statements are not a reliable indicator of future
performance, as they may involve significant stated or implied assumptions and subjective judgements which may or may not prove to be correct. There can be no assurance that any of the matters set out in forward-looking statements are
attainable, will actually occur or will be realised or are complete or accurate. The assumptions and judgments may prove to be incorrect and involve known and unknown risks, uncertainties, contingencies and other important factors, many of which
are outside the control of the Group. Actual achievements, results, performance or other future events or conditions may differ materially from those stated, implied and/or reflected in any forward-looking statements due to a variety of risks,
uncertainties and other factors (including without limitation those which are referable to general market conditions, regulatory changes or due to the impact of the Covid-19 outbreak). Any such forward-looking statements are based on the beliefs,
expectations and opinions of the Group at the date the statements are made, and the Group does not assume, and hereby disclaims, any obligation or duty to update, revise or supplement them if circumstances or management’s beliefs,
expectations or opinions should change. For these reasons, recipients should not place reliance on, and are cautioned about relying on, any forward-looking statements. No representations or warranties, expressed or implied, are given by or on
behalf of the Group as to the achievement or reasonableness of any projections, estimates, forecasts, targets, prospects or returns contained herein.
Additional detailed information concerning important factors that could cause actual results to differ materially from this Presentation is available in our Annual Report and Accounts for the fiscal year ended 31 December 2020 filed with the Securities
and Exchange Commission (the “SEC”) on 24 February 2021 (the “2020 Form 20-F”), which is available at www.hsbc.com.
Non-GAAP financial information
This Presentation contains non-IFRS measures used by management internally that constitute alternative performance measures under European Securities and Markets Authority guidance and non-GAAP financial measures defined in and presented
in accordance with SEC rules and regulations (“Alternative Performance Measures”). The primary Alternative Performance Measures we use are presented on an “adjusted performance” basis which is computed by adjusting reported results for the
period-on-period effects of foreign currency translation differences and significant items which distort period-on-period comparisons. Significant items are those items which management and investors would ordinarily identify and consider
separately when assessing performance in order to better understand the underlying trends in the business.
Reconciliations between Alternative Performance Measures and the most directly comparable measures under IFRS are provided in our 2020 Form 20-F, which is available at www.hsbc.com.
Information in this Presentation was prepared as at 31 March 2021, unless otherwise stated.
12You can also read