NOVELIS INVESTOR PRESENTATION - May 2017 Megan Cochard Director, Investor Relations 404-760-4170

Page created by Calvin Dawson
 
CONTINUE READING
NOVELIS INVESTOR PRESENTATION - May 2017 Megan Cochard Director, Investor Relations 404-760-4170
NOVELIS INVESTOR
  PRESENTATION
 May 2017

 Megan Cochard
 Director, Investor Relations
 404-760-4170
 Megan.cochard@novelis.adityabirla.com

© 2017 Novelis
NOVELIS INVESTOR PRESENTATION - May 2017 Megan Cochard Director, Investor Relations 404-760-4170
SAFE HARBOR STATEMENT

Forward-looking statements
Statements made in this presentation which describe Novelis' intentions, expectations, beliefs or predictions may be forward-
looking statements within the meaning of securities laws. Forward-looking statements include statements preceded by, followed
by, or including the words "believes," "expects," "anticipates," "plans," "estimates," "projects," "forecasts," or similar
expressions. Examples of forward-looking statements in this presentation including statements concerning our plan to complete a
joint venture transaction with Kobe Steel. Novelis cautions that, by their nature, forward-looking statements involve risk and
uncertainty and that Novelis' actual results could differ materially from those expressed or implied in such statements. We do not
intend, and we disclaim, any obligation to update any forward-looking statements, whether as a result of new information, future
events or otherwise. Factors that could cause actual results or outcomes to differ from the results expressed or implied by forward-
looking statements include, among other things: changes in the prices and availability of aluminum (or premiums associated with
such prices) or other materials and raw materials we use; the capacity and effectiveness of our hedging activities; relationships
with, and financial and operating conditions of, our customers, suppliers and other stakeholders; fluctuations in the supply of, and
prices for, energy in the areas in which we maintain production facilities; our ability to access financing for future capital
requirements; changes in the relative values of various currencies and the effectiveness of our currency hedging activities; factors
affecting our operations, such as litigation, environmental remediation and clean-up costs, labor relations and negotiations,
breakdown of equipment and other events; the impact of restructuring efforts in the future; economic, regulatory and political factors
within the countries in which we operate or sell our products, including changes in duties or tariffs; competition from other aluminum
rolled products producers as well as from substitute materials such as steel, glass, plastic and composite materials; changes in
general economic conditions including deterioration in the global economy, particularly sectors in which our customers operate;
cyclical demand and pricing within the principal markets for our products as well as seasonality in certain of our customers’
industries; changes in government regulations, particularly those affecting taxes, environmental, health or safety compliance;
changes in interest rates that have the effect of increasing the amounts we pay under our credit facilities and other financing
agreements; the effect of taxes and changes in tax rates; and our level of indebtedness and our ability to generate cash. The above
list of factors is not exhaustive. Other important risk factors included under the caption "Risk Factors" in our upcoming Annual
Report on Form 10-K for the fiscal year ended March 31, 2017 are specifically incorporated by reference into this presentation.

© 2017 Novelis                                                                                                                     2
NOVELIS INVESTOR PRESENTATION - May 2017 Megan Cochard Director, Investor Relations 404-760-4170
AGENDA

   1       Business Profile & Strategy

   2       Auto & Can Market Outlook

   3       Financial Performance

   4       Appendix

© 2017 Novelis                           3
NOVELIS INVESTOR PRESENTATION - May 2017 Megan Cochard Director, Investor Relations 404-760-4170
BUSINESS PROFILE &
                     STRATEGY

© 2017 Novelis
NOVELIS INVESTOR PRESENTATION - May 2017 Megan Cochard Director, Investor Relations 404-760-4170
NOVELIS IS A GLOBAL INDUSTRY LEADER

          Novelis is the #1 aluminum rolled products supplier worldwide
          Global footprint with 24 operations spanning 10 countries with
           ~11,000 employees
          For the fiscal 2017 year ended 3/31/2017, achieved:
                       3,067kt shipments
                       $9.6 billion revenue
                       $1,085 million of adjusted EBITDA excluding metal price lag*
                       $361 million in free cash flow

    © 2017 Novelis                                                                     5
    *Adjusted EBITDA excluding metal price lag
NOVELIS INVESTOR PRESENTATION - May 2017 Megan Cochard Director, Investor Relations 404-760-4170
OUR GLOBAL FOOTPRINT

                                                  Norf, Germany
                               Ohle/Luedenscheid, Germany
                                                                          Nachterstedt, Germany
        Kingston, Canada                     Latchford, UK
                                                                          Göttingen, Germany
        Warren, Ohio            Oswego, New York
                                                                                                        Yeongju, S.Korea
     Berea, Kentucky                                                       Pieve/Bresso, Italy                                   Ulsan, S. Korea
                            Fairmont, W. Virginia
Terre Haute, Indiana                                 Crick, UK
                           Logan, Kentucky                                                                                   Changzhou, China
                                                    Sierre, Switzerland
                            Greensboro, Georgia

                                                                                                                           Binh Duong, Vietnam

                                         Pinda/Santo Andre, Brazil

                                             Automotive          Beverage Can       Specialty & Other

  © 2017 Novelis                                                                                                                           6
NOVELIS INVESTOR PRESENTATION - May 2017 Megan Cochard Director, Investor Relations 404-760-4170
CONSISTENT STRATEGY

                                      Optimize our global rolling
                 Utilize our global   capacity
                          capacity

                                                Grow shipments of premium
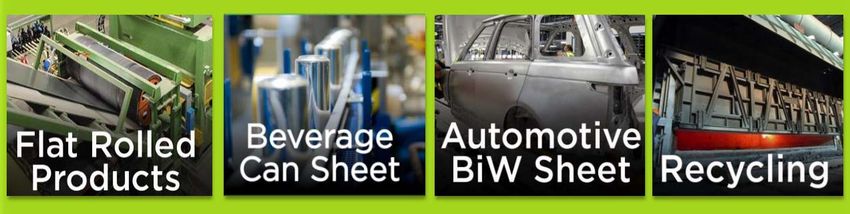
                          Strengthen our        flat rolled products
                        product portfolio

                                                            Improve operational
                               Drive operational            efficiency, safety, customer
                                      excellence            service, product quality, and
                                                            metal mix to manage costs

                                                                         Building financial flexibility
                                             Strengthen our              while evaluating strategic
                                              balance sheet              opportunities

© 2017 Novelis                                                                                      7
NOVELIS INVESTOR PRESENTATION - May 2017 Megan Cochard Director, Investor Relations 404-760-4170
AUTO & CAN MARKET
                     OUTLOOK

© 2017 Novelis
NOVELIS INVESTOR PRESENTATION - May 2017 Megan Cochard Director, Investor Relations 404-760-4170
GLOBAL AUTOMOTIVE PRODUCTION

       Overall global production is expected to stay flat over the next 3 years for Europe and N. America
       China will continue to be the largest automotive market with growth exceeding all other regions
       Aluminum intensive vehicles, such as trucks, SUVs, and electric vehicles, will continue to grow at a
        faster rate than the overall market in North America, Europe, and China

Global Production (million units)1                                    Production Changes by Segment (million units)1

     North America        Europe     China
                                                                                       -0.2                           2012 - 2016
                                                               29.3   N America Car
                             27.9             27.9                                    -0.4                            2016 - 2019
            27.4

                                                                                                                2.6
                                                                      N America LT
                                       22.2             22.4                                       0.5
     21.5             22.0

                                                                                        -0.1
 17.8              17.6             17.8             18.0               Europe Car
                                                                                      -0.4

                                                                                                               2.3
                                                                         Europe LT
                                                                                                         1.3

                                                                                                         1.4
                                                                          China Car
                                                                                      -0.5

                                                                                                                                    7.4
                                                                          China LT
                                                                                                                2.4

     CY16             CY17             CY18             CY19

© 2017 Novelis                                                                                                                9
                                                                                        1Source:   IHS Markit
NOVELIS INVESTOR PRESENTATION - May 2017 Megan Cochard Director, Investor Relations 404-760-4170
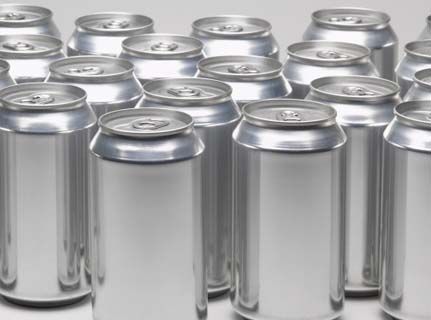
ALUMINUM PENETRATION

     Flat rolled aluminum demand will continue to grow as OEMs lightweight vehicles to comply with strict
      emission standards and meet customer performance demands
     Ducker Worldwide projects increased penetration of aluminum sheet leading to significantly higher
      demand over the next 8 years
     Higher penetration rates expected in hang-ons due to higher value and lower complexity

European Average AL Body Sheet Per Vehicle1 (kg)                  European AL Sheet Penetration1

     Low Scenario    High Scenario               45                                                       33%
                                     41                            Hoods                                     37%
                                                                                                                           50%

                                                                                      11%
                                31                                 Doors                 15%
                    29                                                                                 29%

                                                                                               20%
        22                                                       Fenders                         23%
                                                                                                             35%

                                                                                               21%
                                                                    Boots                         25%
                                                                                                              37%

                                                                                 6%
                                                                   Roofs          8%
                                                                                   9%
 2016                    2020             2025

                                                                                        2016      2020       2025

© 2017 Novelis                                                                                                               10
                                                      1Source:   Ducker Worldwide- Aluminum Content in Cars Presentation
GLOBAL REGULATORY LANDSCAPE

                                                            Europe
                                              The European Commission adopted a long-
         United Sates                         term strategy in 2017 to drive emission                      China
                                              reduction through research, innovation,
Although CAFE standards are being             legislation, and EV infrastructure           China has announced the development of
reviewed we expect little impact on the       • Stable emission reduction legislation is   the EV industry is a strategic target and will
strategy of OEMs to lightweight                  supported at the federal and municipal    be supported through policies promoting
• A final CAFE determination will take           level                                     charging infrastructure, batteries, and
   years to develop                           • Following the diesel scandals European     adoption
• The global market requires domestic            OEMs are seeking new ways to reduce       • Introduced strict emission standards for
   OEMs to continue to produce vehicles          emissions                                    2020 and 2025
   that are competitive and comply globally                                                • EVs receive subsidies, immediate
• The United States is not a “technology                                                      access to vehicle plates, and no driving
   island”                                                                                    limitations

   © 2017 Novelis                                                                                                                  11
DEMAND IN CHINA FOR ELECTRIC VEHICLES TO GROW
AND LEAD THE WAY

  KEY ATTRIBUTES
   Government policies
    supporting emission
    regulation and infrastructure
    driven by decrease in
    dependence on imported oil

   EVs do not have driving         Beijing Before and After Banning 2.5M Cars for 2 Weeks
    restrictions

   Most OEMs regard EVs
    as a key strategic focus

                                    Source: CNN

© 2017 Novelis                                                                               12
LIGHTWEIGHTING IS A MULTI- MATERIAL OPPORTUNITY

       Aluminum sheet has a small share of the Body-in-White market
       Lighter materials have significant opportunity to increase market share compared to mild steel
       Novelis is continuing to produce innovative alloys that provide OEMs with lighter and stronger
        material options

Global Steel and Aluminum Market Share1                            N. America Body and Closure as a % of Weight2

     85.5 Mt Steel for automotive, 2016
                                                                             2015                              2025

                                                                              4.0%                                 2.0%
                                                                                                                    1.0%
                                                                                                           16.0%
                                                                     20.0%
                                                                                                                             41.0%

                                                                                        76.0%              40.0%

     2.2 Mt Aluminum sheet for automotive, 2020
       1.4 Mt Aluminum sheet for automotive, 2017                         Mild & HSLA           AL Sheet           AL VD Castings
                                                                          AHSS/UHSS          AL Extrusions

© 2017 Novelis                    1Source:                                                                                      13
                                           OICA, World Steel, Novelis Internal
                                  2Source: Ducker Worldwide- 2015 N America Light Vehicle Aluminum Content Study
CAN MARKET DYNAMICS

     Customer consolidation creating
      pricing pressure, but Novelis is
      offsetting through operational
      improvements
     Continued overcapacity,
      particularly in China
     Multi-year economic downturn in
      Brazil, expect some recovery by
      year-end
     Relatively balanced North
      American market

© 2017 Novelis                           14
FINANCIAL HIGHLIGHTS

© 2017 Novelis
FISCAL 2017 FULL YEAR HIGHLIGHTS

           Record Adjusted EBITDA* $1,085 million, up 13% YoY
           Adjusted EBITDA* per ton $354
           Generated record free cash flow $361 million
           Reduced net debt leverage ratio below 4x

Full year Adjusted EBITDA* ($ millions)                                  Full year free cash flow ($ millions)

                                                                          $600
 $1,100                                                                                                          361
                                                                          $400
                                                                                                           160
                                                                          $200                     71
 $1,000
                                                                            $0
                                                                                          (16)
                                                                         ($200)
  $900
                                                                         ($400)

  $800                                                                   ($600)   (565)
              FY13          FY14           FY15            FY16   FY17             FY13   FY14    FY15    FY16   FY17

       Strategic product shift and operational efficiencies drive record results
   © 2017 Novelis                                                                                                       16
*Adjusted EBITDA excludes metal price lag in all periods
AUTOMOTIVE GROWTH

           Record automotive shipments up 17% FY17 versus FY16
                      Driven by seamless ramp up of all new finishing assets
                      Strong customer demand for aluminum sheet
           Automotive increased to 18% of FY17 FRP shipments
                      Q4FY17 exit rate at 20% of shipments

 Quarterly global Automotive shipments (kt)          Product mix % of total FRP shipments
175
                                                                FY16                                  FY17
150
                                                          21%                64%           22%                    60%
125

100
                                                    15%
 75                                                                                  18%

 50
                                                                       Can         Auto     Specialties

      © 2017 Novelis                                                                                         17
MEANINGFUL OPERATIONAL IMPROVEMENTS

       Operational excellence
               Safety rates at industry-leading low levels of
                recordables
               Improved end-to-end recovery leading to
                increased asset utilization and uptime
               Increased use of recycled materials from 53% to
                55% of inputs

                                      Customer focused
                                            Driving quality through 26% reduction in parts
                                             per million defects
                                            Increased satisfaction scores 22 percentage
                                             points

    Focus on business fundamentals drives better service, quality and value
    © 2017 Novelis                                                                     18
FULL YEAR ADJUSTED EBITDA* BRIDGE
  $ Millions

                                                                           Higher mix of Auto
                                                                           Partially offset by some lower
        Excluding Alcom, shipments
                                                                            prices and unfavorable mix
         down 45kt YoY
                                                                            within Can and Specialty
        Auto up 80kt
        Can down ~150kt
$1,100                                                                                                                        28           1,085
                                                                                                   112
$1,050

$1,000
                     963
                                                                          18
 $950

 $900                                         (36)
                                                                                          Operating cost efficiencies
 $850
                                                                                          Better metal mix
                                                                                          Partially offset by cost inflation

 $800
                   FY16                     Volume                    Price/Mix             Operating Cost              SG&A, FX & Other   FY17

 © 2017 Novelis                                                                                                                                    19
 *EBITDA excluding metal price lag in both periods
  Bridge components adjusted to remove net impact of divested ALCOM business, reflected in SG&A, FX & Other as ($3M).
FREE CASH FLOW
$ Millions

                                               FY17         FY16

                 Adjusted EBITDA                1,054        791
                 Capital expenditures           (224)        (370)
                 Interest paid                  (279)        (313)
                 Taxes paid                     (128)        (126)
                 Working capital & other        (62)         179
                 Free cash flow                 361          160

      Free cash flow increase year over year driven by:
            Higher Adjusted EBITDA
            Completion of prior strategic capital expenditure program
            Refinancing driven interest savings
            Partly offset by higher working capital due to rising aluminum prices

                         Generating sustainable free cash flow
© 2017 Novelis                                                                       20
NET DEBT LEVERAGE RATIO

                   Net debt/Adjusted EBITDA, excluding metal price lag
                  7.0

                  6.5

                  6.0

                  5.5

                  5.0

                  4.5

                  4.0

                  3.5

                  3.0

                 Below 4x target one year earlier than anticipated
© 2017 Novelis                                                           21
KEY TRANSACTIONS

© 2017 Novelis
REFINANCING OF CAPITAL STRUCTURE IN FY17

     Total of $4.3 billion in debt refinanced in FY17

     Refinanced $2.5 billion of Senior Notes in Q2
                Reduced coupon and annual cash interest by ~$55 million
                Significantly improved maturity profile

     Refinanced $1.8 billion Term Loan in Q4
                Lender base moved from US to Asian market
                Reduces annual cash interest by ~$24 million

                   In total, ~$80 million in annual cash interest savings
© 2017 Novelis                                                              23
ENTERING A PRODUCTION JOINT VENTURE IN ASIA

    Novelis will sell 50% of its ownership interest in its Ulsan, South
     Korea facility to Kobe Steel for US $315 million
    This venture, named Ulsan Aluminum Ltd., will allow Novelis to:
            More efficiently utilize our rolling assets in Korea
            Deepen the plant’s focus on the growing automotive aluminum sheet market
            Drive operational efficiencies and process enhancements through a
             partnership with a high-quality manufacturing company
            Provide cash proceeds to enhance our strategic flexibility and reduce net
             debt
            Leverage our deep experience in successful JVs to more efficiently serve
             our customers

                                            Key Facts
                                            ■   Year Built: 1969; major upgrade in 2013
                                            ■   Employment: 600
                                            ■   Plant size: 396,660 square feet (36,850 square
                                                meters)
                                            ■   Capabilities: Remelt/recycle, hot & cold rolling,
                                                finishing

    © 2017 Novelis                                                                                  24
SUMMARY

© 2017 Novelis
SUMMARY

      FY17 demonstrated sustainable step-up in
       Adjusted EBITDA and free cash flow
              Headwinds from Can market overcapacity and
               customer consolidation
              Mix continues to improve as Automotive
               shipments increase
              Focus on operational efficiencies and metal
               management to manage costs
      Strengthening the balance sheet to provide
       strategic flexibility ahead of next stage of
       growth

                        Strong sustainable operating performance
    © 2017 Novelis                                                 26
THANK YOU AND QUESTIONS

                 THANK YOU
                  QUESTIONS?

© 2017 Novelis
APPENDIX

© 2017 Novelis
INCOME STATEMENT RECONCILIATION TO ADJUSTED
       EBITDA

                                                                  (in $ m)       Q1          Q2         Q3          Q4        FY16         Q1         Q2          Q3         Q4        FY17

Net (loss) income attributable to our common shareholder                         (60)       (13)         6          29         (38)        24         (89)        63          47          45

- Noncontrolling interests                                                         -          -           -          -           -          -           -          1           -           1
- Interest, net                                                                  (78)       (80)        (77)       (79)       (314)       (80)        (79)       (65)        (59)        (283)
- Income tax (provision) benefit                                                 (15)         3         (16)       (18)        (46)       (36)        (27)       (47)        (41)        (151)
- Depreciation and amortization                                                  (87)       (89)        (88)       (89)       (353)       (89)        (90)       (88)        (93)        (360)

EBITDA                                                                           120        153         187        215         675        229         107        264         240         840

- Unrealized gain (loss) on derivatives                                           35        (15)         (2)       (22)         (4)        (7)         4          21         (13)         5
- Realized gain (loss) on derivative instruments not included in
                                                                                  1          (3)         1           -          (1)         1           -          1          3           5
  segment income
- Proportional consolidation                                                      (7)        (8)         (7)        (9)        (30)        (8)         (8)        (4)         (8)         (28)
- Loss on extinguishment of debt                                                 (13)         -           -          -         (13)         -        (112)         -         (22)        (134)
- Restructuring and impairment, net                                              (15)        (4)        (10)       (19)        (48)        (2)         (1)        (1)         (6)         (10)
- Loss on sale of business                                                         -          -           -          -           -          -         (27)         -           -          (27)
- (Loss) gain on sale of fixed assets                                             (1)         -          (1)        (2)         (4)        (4)         (2)         2          (2)          (6)
- Gain on assets held for sale, net                                                -          -           -          -           -          1           1          -           -            2
- Others (costs) income, net                                                      (7)         1          (6)        (3)        (16)        (7)         (4)        (6)         (4)         (21)

Adjusted EBITDA                                                                  127        182         212        270         791        255         256        251         292       1,054

Other income (expense) included in adjusted EBITDA
- Metal price lag                                                                (85)       (54)        (26)        (7)       (172)       (13)        (14)        (4)         -          (31)
- Foreign currency remeasurement                                                  4          (3)         4          (3)         2          (3)          2          2          3           4
Explanation of other income (expense) Included in adjusted EBITDA
1) Metal price lag net of related hedges: On certain sales contracts we experience timing differences on the pass through of changing aluminum prices from our suppliers to our customers.
Additional timing differences occur in the flow of metal costs through moving average inventory cost values and cost of goods sold. This timing difference is referred to as metal price lag.
2) Foreign currency remeasurement net of related hedges: All balance sheet accounts not denominated in the functional currency are remeasured every period to the period end exchange
rates. This impacts our profitability. Like metal price lag, we have a risk management program in place to minimize the impact of such remeasurement.

       © 2017 Novelis                                                                                                                                                               29
FREE CASH FLOW AND LIQUIDITY

                                                (in $ m)    Q1     Q2     Q3      Q4     FY16     Q1      Q2      Q3      Q4     FY17

       Cash (used in) provided by operating activities     (288)   225     64     540     541    (107)    80      178    424     575
       Cash used in investing activities                   (137)   (84)   (75)    (82)   (378)    (39)   (48)    (35)    (90)    (212)
       Less: (proceeds) outflows from sales of assets        -     (1)    (1)     (1)     (3)      -      12     (12)     (2)     (2)

      Free cash flow                                       (425)   140    (12)    457     160    (146)    44      131    332     361

      Capital expenditures                                  129     75     78     88      370     44      46      48      86     224

                                               (in $ m)     Q1     Q2     Q3      Q4     FY16     Q1      Q2      Q3      Q4     FY17

       Cash and cash equivalents                           456     462    457    556     556     457     473     505     594     594
       Availability under committed credit facilities      708     506    489    640     640     633     573     534     701     701

       Liquidity                                           1,164   968    946    1,196   1,196   1,090   1,046   1,039   1,295   1,295

© 2017 Novelis                                                                                                                           30
NET INCOME EXCLUDING SPECIAL ITEMS

                                           (in $ m)   Q1     Q2     Q3     Q4    FY16   Q1    Q2     Q3    Q4    FY17

      Net (loss) income attributable to our
                                                      (60)   (13)    6     29    (38)   24    (89)   63    47     45
     common shareholder
      Special items:
       Gain on assets held for sale                    -      -      -      -     -     (1)   (1)     -     -    (2)
       Loss on sale of business                        -      -      -      -     -      -    27      -     -     27
       Loss on extinguishment of debt                 13      -      -      -     13     -    112     -    22    134
       Restructuring and impairment, net              15      4     10     19     48    2      1     1     6      10
       Metal price lag                                85     54     26     7     172    13    14     4      -     31
       Tax effect on special items                    (29)   (20)   (10)   (5)   (64)   (5)   (4)    (1)   (2)   (12)

     Net Income, excluding special items              24     25     32     50    131    33    60     67    73    233

© 2017 Novelis                                                                                                          31
METAL PRICE LAG EFFECT MINIMIZED

             Local market premiums reverted back towards historical norms
             Reduced premium volatility minimizing metal price lag

 $700
                                                         Regional Premiums                                                              in $/mt

 $650
                          MWP         ECDP        MJP     Brazil
 $600
 $550
 $500
 $450
 $400
 $350
 $300
 $250
 $200
 $150
 $100
  $50
   $0

         (in $ m)   Q1    Q2    Q3     Q4    FY14   Q1    Q2       Q3   Q4     FY15   Q1   Q2    Q3    Q4   FY16   Q1   Q2   Q3    Q4    FY17
Metal price lag     (2)   2     (7)    24    17     2     9        8    (13)    6     (85) (54) (26)   (7) (172) (13) (14)   (4)   -     (31)

        © 2017 Novelis                                                                                                                  32
You can also read