European Segment Business Update "1 LKQ Europe" - September 10, 2019 - Apres ...
←
→
Page content transcription
If your browser does not render page correctly, please read the page content below
European Segment Business Update
“1 LKQ Europe”

September 10, 2019

Forward Looking Statements and Financial Measures

Statements and information in this presentation that are not historical are forward-looking statements within the meaning
of the Private Securities Litigation Reform Act of 1995 and are made pursuant to the “safe harbor” provisions of such Act.
Forward-looking statements include, but are not limited to, statements regarding our outlook, guidance, expectations,
beliefs, hopes, intentions and strategies. These statements are subject to a number of risks, uncertainties, assumptions
and other factors including those identified below. All forward-looking statements are based on information available to
us at the time the statements are made. We undertake no obligation to update any forward-looking statements, whether
as a result of new information, future events or otherwise, except as required by law.
You should not place undue reliance on our forward-looking statements. Actual events or results may differ materially
from those expressed or implied in the forward-looking statements. The risks, uncertainties, assumptions and other
factors that could cause actual results to differ from the results predicted or implied by our forward-looking statements
include the factors disclosed under the captions “Risk Factors” and “Management’s Discussion and Analysis of Financial
Condition and Results of Operations” in our Annual Report on Form 10-K for the year ended December 31, 2018 and in
our subsequent Quarterly Reports on Form 10-Q. These reports are available on our investor relations website at
lkqcorp.com and on the SEC website at sec.gov.
The presentation references Segment EBITDA, which is our measure of segment profitability as defined in our public
filings. See the “Segment and Geographic Information” footnote in our forms 10-Q and 10-K for further detail.

                                                           2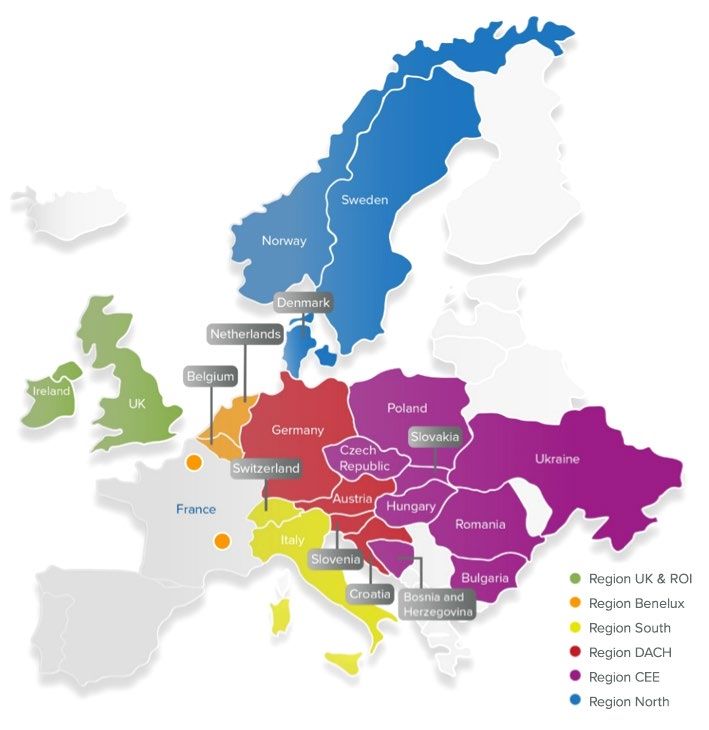
Agenda

• “1 LKQ Europe”

• New LKQ Europe Leadership

• Path to Sustainable Double-Digit Margins

• Transformation Costs and Sources of Funding

• Testimonials

• Q&A

                                                3
Mission Statement

“      To be the leading global value-added distributor of
           vehicle parts and accessories by offering our
       customers the most comprehensive, available and
          cost effective selection of part solutions while
      building strong partnerships with our employees and

                                                     ”
              the communities in which we operate

                             4
LKQ Europe – The market leader

          $6.0 B                                       ~700,000
      Estimated revenue in 2019                    Independent Wholesale Customers

             21*                                      #1                   ~1,100
   Countries with LKQ locations in                     Ranking
              Europe                                  in Europe                 locations

     > 27,000                                          >500,000
   Employees throughout Europe                                    Unique SKU’s

* Includes countries where Mekonomen, of which LKQ owns 26.6%, operates. All other figures exclude
Mekonomen

                                                                                               5
“1 LKQ Europe”

                                                                                                     Maintain Strong
              21 Different            Unchanged Customer             … In the Hands of
                                                                                                     Entrepreneurial
               Countries                 Experience….                Local Managers
                                                                                                         Culture

        29 ERP                  50 Customer
        Systems                    Portals

       24 Financial
        Systems

        15 E-mail       90 Private              Transformation
        Systems        Label Brands

        38 Phone                   10
        Systems                Catalogues

Fragmented Procurement and Product Management                                                Rationalized Product Portfolio
                                                                                   LKQ Europe Headquarters    Common ERP Platform

                                                                 6
Segment EBITDA margin progress since Q1 2018

                                                                    Impact of the Initiatives: Q1’18 vs. Q2’19

                                                                                        0.3%            -0.5%
                                                                       0.1%
                                                       0.3%
                                      0.1%                                                                               -0.4%
                                                                                                                                          -0.3%
                     1.1%                                                                                                                                  -0.2%       7.7%
    7.3%

   Q1 2018             T21        Andrew Page      Procurement       Catalogue          Other       Market Impact2       Working      Transformation    Stahlgruber   Q2 2019
   Segment                                                                                                              Day Effect        Costs3          Impact4     Segment
    EBITDA                                                                                                                                                             EBITDA

Note: In the chart above the sum of the individual percentages may not equal to the total due to rounding
Source: Company analysis
1) Represents the benefit of lower NDC operating costs and reduced inventory losses in 2019 compared to the base period
2) Market impact represents the difference between reported Q2 2019 Segment EBITDA % and “Estimated Q2 2019 Segment EBITDA%”; Estimated Q2 2019 Segment
   EBITDA% assumed flat organic revenue (on a per day basis) vs Q2 2018 and consistent GM% and variable SG&A% in Q2 2019. Market Impact calculation excludes
   Stahlgruber
3) See page 15 for details and definitions
4) All factors are shown excluding the effect of Stahlgruber, except for “Stahlgruber Impact”, which captures the net impact from the acquisition on Segment EBITDA
   margin                                                                                            7
Arnd Franz - Chief Executive Officer, LKQ Europe*
Prior to joining LKQ Europe, Arnd served as Corporate
Executive Vice President and Member of the Management
Board of MAHLE Group. MAHLE is an automotive parts
manufacturer based in Stuttgart, Germany with over €12
billion in annual sales. At MAHLE, Arnd was responsible for
global OEM sales and aftermarket parts development for
MAHLE’s entire product portfolio.
* On August 15, 2019 the Company announced that Arnd Franz will succeed John Quinn as Senior Vice President of LKQ Corporation and CEO of LKQ Europe
effective October 1, 2019
8Arnd Franz – First 150 days observations
Accomplishments
• Unique growth story from acquisitions
• Market slow but LKQ gaining share in most markets
• Transition to consolidated procurement initiated with significant further opportunities
• Product management: Activities ready for implementation
• Maintained strong entrepreneurial culture
Key enablers have been initiated
• First successful big data pilot projects for revenue and yield optimization
• Experienced international cross-functional team for ERP implementation
• Catalog data harmonization
• More digital customer solutions under way
What’s next
• Time to integrate: organization ready to change to “1 LKQ Europe”
• LKQ set to be a leader in key value drivers for the Aftermarket of the future
• Leverage scale in procurement and operations by consistent plan execution
• Medium-term opportunity to grow aftermarket collision parts in certain key markets
9Representative benefits from LKQ Europe initiatives
LKQ is uniquely positioned to leverage its scale and capabilities in Europe
Revenue
Procurement Private Label ERP
Optimization
Revenue Impact
Complexity
Reduction
Cost Reduction
Customer Value
Leveraging LKQ
Scale
Positive Impact Minimal Impact
10Where we believe LKQ Europe can be in 2021 and beyond
LKQ Europe: Path to Sustainable Double Digit Segment EBITDA Margin
Initiatives’ Benefit Post 2021
0.6% -0.3%
0.3% 11.1% • Procurement
2.2% 0.2% 0.1% -0.5% • Private Label
2 • Centralization and Shared
1.9% More details on the Services
following pages
8.3% • Logistics
• Digital Services
1 9.5% • ERP
7.8%
More details on the
following pages
Forecasted Key Initiatives Asset Rationalization Organic Growth Incremental Expected 2021 Segment Additional 0.5% - 1.0%
2019 Segment Transformation Costs EBITDA Margin2 Segment EBITDA Margin
EBITDA Margin1 Benefit
Potential Incremental Range
1) Includes 30 bps negative impact from transformation costs
2) Includes 60-80 bps negative impact from transformation costs Expected Segment EBITDA Margin / Impact
111
Expected benefit of initiatives
LKQ Europe Initiatives’ Expected Segment EBITDA Benefit 2019 - 2021
0.6% 2.2%1
0.5%
• LKQ Supplier Rebates 0.5%
• Indirect Spend
Reduction • T2
• Pan-European 0.5% 0.3% • Andrew Page
Supplier Pricing Integration
• Big Data • Other Local
0.4% Initiatives
1.9%
0.8% • Yield
Management
• Private Label
0.7% Strategy
• Catalog
Procurement Product Strategy Revenue Optimization Local Initiatives Total Initiatives
Potential Incremental Range t
Expected Margin Benefit
1) Numbers may not foot due to rounding
122
Growing Market with Aging Fleet
Parc Size
1
2 Expected Organic Growth for LKQ
LKQ Europe Footprint Age of Fleet Europe 2020-2025 CAGR
(millions)
Germany 47.1 9.3 2.5%
United Kingdom 36.0 7.8
Netherlands 8.6 10.4
Italy 39.0 10.8 1.5%
CEE Region3 49.3 14.2
2020 - 2025 CAGR
LKQ Europe Coverage 180.0 10.7
Higher Range Lower Range
European Union 282.1 10.5
2013 – 2017 CAGR 2.0% 1.4%
Sources: Industry Sources, LKQ Analysis, European Automobile Manufacturers Association
1) Passenger and Light Commercial Vehicles as of 2019; 2) As of 2016; 3) Includes Czech Republic, Slovakia, Ukraine, Hungary, Poland, Romania
13Expected margin progression through 2021
Expected European Segment EBITDA Margin
11.1%
9.2%
8.1% 8.3%
9.5%
7.8% 8.5%
-0.5% -0.6%
-0.3% -0.7% -0.8%
2018A 2019F 2020F 2021F
Expected Segment EBITDA Margin Including Transformation Cost
Potential Range for Segment EBITDA Including Transformation Cost
Expected Impact of Transformation Cost
Potential Range of Transformation Cost
14“1 LKQ Europe” Program Costs
Expected Cash Outlays 2019 – 2021 in $M1
Cost Definitions
Previously Announced:
• Transformation-related opex: Period costs incurred to
• Estimated restructuring charges of ~$20-
$23M for cost reduction initiatives execute the “1 LKQ Europe” project that are classified
• Opex transformation costs of ~$7M in the outside of restructuring expense and Capex. E.g. non-
YTD June 2019 period $55 - $65 $155 - $185 capitalizable implementation costs for the new ERP, such as
• June 2019 life to date Capex for the ERP training and data conversion.
implementation is $13M; Projected 2019 –
2025 Capex of ~$50-$60M • Transformation-related capex: These are expenditures for
long-lived assets, such as software and facilities that
Opex
directly relate to the “1 LKQ Europe” project and impact
$55 - $65 free cash flow, but are capitalized onto LKQ’s balance sheet.
E.g. design and coding costs to implement the new ERP.
• Restructuring expenses: Non-recurring costs resulting
Capex directly from (i) the implementation of the “1 LKQ Europe”
$45 - $55 project from which the business will derive no ongoing
benefit and (ii) efforts to eliminate underperforming assets
and cost inefficiencies as previously announced during
Restructuring
2019. E.g. lease breakage costs when consolidating
branches. Estimates in this presentation exclude one-time
2019 2020 2021 2019 – 2021 Total gains or losses related to asset rationalizations
Note: Cash outlays for the program between 2022-2024 are expected to be in the range of $80M - $100M in total
1) Local currency amounts translated to USD at current exchange rates
15Funding of Transformation
Cash Flow Considerations Vendor Financing Program - Update
• Trade Working Capital (TWC) • European segment’s annual direct spend is approximately $3.6 billion with ~1,800
improvement in Europe launched as suppliers with annualized spend >$23,000
a key objective in 2019, primarily
driven by: • The Top 40 suppliers - key strategic partners - represent 60% of the annual spend, or
about $2.2 billion
‒ Supplier payment terms
normalization, incl. vendor • Launched the European vendor financing program in 2019:
financing program ‒ Initiated negotiations with the Top 40 suppliers in order to extend the average
‒ Stock level rationalization payment terms in line with market convention for customers of similar spend
scale globally
‒ Improved supply chain approach
(e.g. Category management) ‒ Secured financing partners in key markets such as Germany, Italy and UK
‒ Past due receivables • By end-July 2019, completed meetings with suppliers representing 80%+ of the spend
in scope.
• Expectation that transformation
costs will be entirely funded by the • Preliminary feedback, incl. suppliers that have already signed up to the program is
improved TWC performance largely positive. Our intention is to secure longer payment terms that will generate
>$200 million in incremental OCF by 2021
16Supplier Testimonials
“ The European automotive aftermarket is expected to face technology and geographical developments that will
push both, distributors and manufacturers to shift toward stronger partnerships supporting the digitization of
channels and interface.
The strategy of LKQ in combination with the offer of Bosch Automotive Aftermarket in terms of Products,
Diagnostics and Workshop Services, supports the trends of the future aftermarket.”- Manfred Baden, President
of Automotive Aftermarket, Bosch
“ LKQ is pursuing its strategic path consequently and we as Schaeffler would like to continue to be a reliable
partner. Together we are engaged for fair competition with unrestricted access to repair and connectivity data.
Both of us put the independent workshop at the center of our service and training activities for future
affordable repair and service to secure individual mobility.
Moreover we support LKQ in the consolidation of the European distribution, as consolidation and efficiency
gains are required on all levels of the independent market. We are convinced that we can generate above
average value with this spirit of partnership.” – Michael Soeding, Member Executive Board and CEO,
Automotive Aftermarket, Schaeffler
17Customer Testimonials
“ As an online retailer with an extensive "long-tail" of product we offer our customers, Kfzteile24 wishes for
competent and available parts assortments from its suppliers. The efficiency of LKQ in the procurement of
ordered particles is best in class and far above average. From Kfzteile24’s perspective, we see a high sales
potential between our companies for the foreseeable future based on the performance in price and order
fulfilment LKQ offers.” - Wolfgang Riegel, COO, Kfzteile24
“ Stahlgruber is the partner of our choice, because in addition to the important immediate availability of high-
quality spare parts and tools on the same day, we can also make use of an extensive service and training offer.
Furthermore, the good personal relationship with my sales representatives and their superiors is extremely
important.
By joining the LKQ Group we hope to gain further advantages in the medium term. You can be sure of a close
exchange with your international colleagues - not only through our international workshop concept. The industry
has great challenges to deal with - for this we need the best partners.”- Vogt GmbH, Heilbronn
18Customer Testimonials
“ In November 2018 we moved our roadside parts supply to Euro Car Parts. The initial transition took place as we
entered our busiest period, given the nature of our business it had to be seamless. Thanks to the professional and
supportive approach taken by all levels from Branch to the Exec the transition went to plan and had only a positive
effect on the business.
Post transition the leadership team have continued to support our parts strategy, provided Management Information to
shape our ranging, and continue to look for ways to improve our patrol efficiencies, engagement, and sales ratios.
Feedback from Patrols has been positive and we look forward to continuing to develop the partnership.”-
Simon Benson, Commercial Director, UK Automotive Association
“ Halfords have worked with Euro Car Parts for a number of years, and over that time, we have developed strong
working relationships at all levels of the business. We find them to be a supportive partner in a number of areas, from
delivering great service levels to our garage network, through to working together to grow sales and market share for
both parties. Looking ahead, there are some exciting developments that could further strengthen the relationship and
provide mutual benefit for both parties. We look forward to approaching these with the usual energy, tenacity and
rigour that we have become used to when working with Euro Car Parts.”-
Dan Williams, Commercial Director, Halfords Autocentres
19Questions and Answers
20You can also read