Investor Presentation - August 2017 - StockDeck.io

Page created by Freddie Rivera
 
CONTINUE READING
Investor Presentation - August 2017 - StockDeck.io
Investor Presentation
August 2017
Investor Presentation - August 2017 - StockDeck.io
Safe Harbor

This presentation contains forward-looking statements. All statements other than statements of historical
fact contained in this presentation, including statements regarding our future results of operations and
financial position, business strategy and plans and objectives of management for future operations, are
forward-looking statements. In some cases, you can identify forward-looking statements by terms such as
"may," "will," "should," "expects," "plans," "anticipates," "could," "intends," "target," "projects,"
"contemplates," "believes," "estimates," "predicts," "potential" or "continue" or the negative of these terms
or other similar expressions.

Forward-looking statements are based on current expectations of future events. We cannot guarantee that
any forward-looking statement will be accurate, although we believe that we have been reasonable in our
expectations and assumptions. Investors should realize that if underlying assumptions prove inaccurate or
that known or unknown risks or uncertainties materialize, actual results could vary materially from the
Company’s expectations and projections. Investors are therefore cautioned not to place undue reliance on
any forward-looking statements. These forward-looking statements speak only as of the date of this
presentation and, except as required by applicable law, we undertake no obligation to publicly update or
revise any forward-looking statements contained herein, whether as a result of any new information, future
events or otherwise.

Factors that could cause or contribute to differences in our future results include, but are not limited to:
economic factors, such as interest rates and currency exchange fluctuations; our ability to acquire new
customers and retain existing customers; our ability to sustain and/or manage our growth; our ability to
increase our net revenue per active customer; and our ability to build and maintain strong brands. A further
list and description of these risks, uncertainties and other factors can be found under Part I, Item 1A, Risk
Factors in our Annual Report on Form 10-K for the fiscal year ended December 31, 2016 and the
Company’s subsequent filings with the Securities and Exchange Commission. We qualify all of our forward-
looking statements by these cautionary statements.
                                                                                                                2
Investor Presentation - August 2017 - StockDeck.io
Our Mission

              To transform the way people
                  shop for their homes

                                            3
Investor Presentation - August 2017 - StockDeck.io
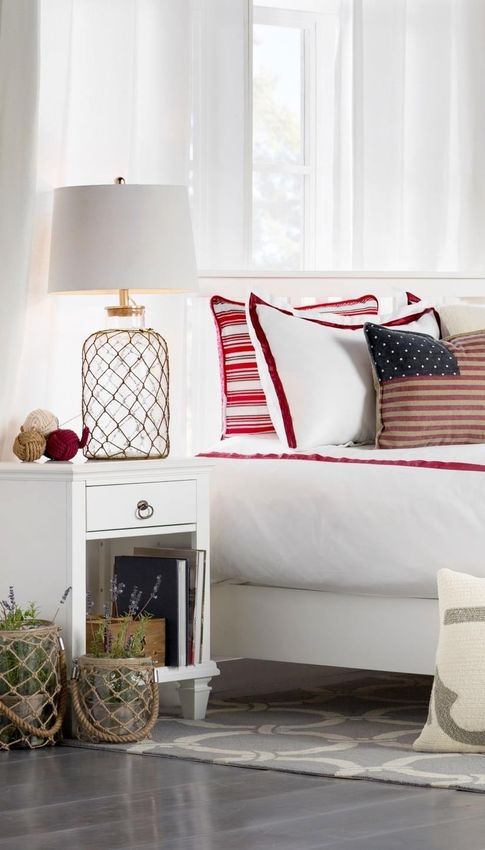
A Clear Online Leader in Home Goods

                                                                                                                           $3,930
 •     MASSIVE ONLINE CATALOG with over 8,000,000 home products
 •     INVENTORY-LIGHT MODEL partnering with ~10,000 suppliers                                                    $3,380
 •     FOUNDER-LED since inception; co-founders own significant equity
 •     $3.93 BILLION of LTM net revenue with minimal inventory
 •     46% Q2 YoY GROWTH in direct retail, 43% total growth
                                                                                                         $2,250

                                                                                               $1,319

                                                                                    $916

                                                                             $601
                                                                      $517

2002    2003   2004   2005   2006   2007     2008      2009    2010   2011   2012      2013      2014     2015     2016     Q2'17
                                                                                                                            LTM
                      240+ Niche Websites;                             Wayfair Brand           Brand
                      Platform Development                              Launched              Building
                                             Direct Retail    Other
                                                                                                                                    4
Investor Presentation - August 2017 - StockDeck.io
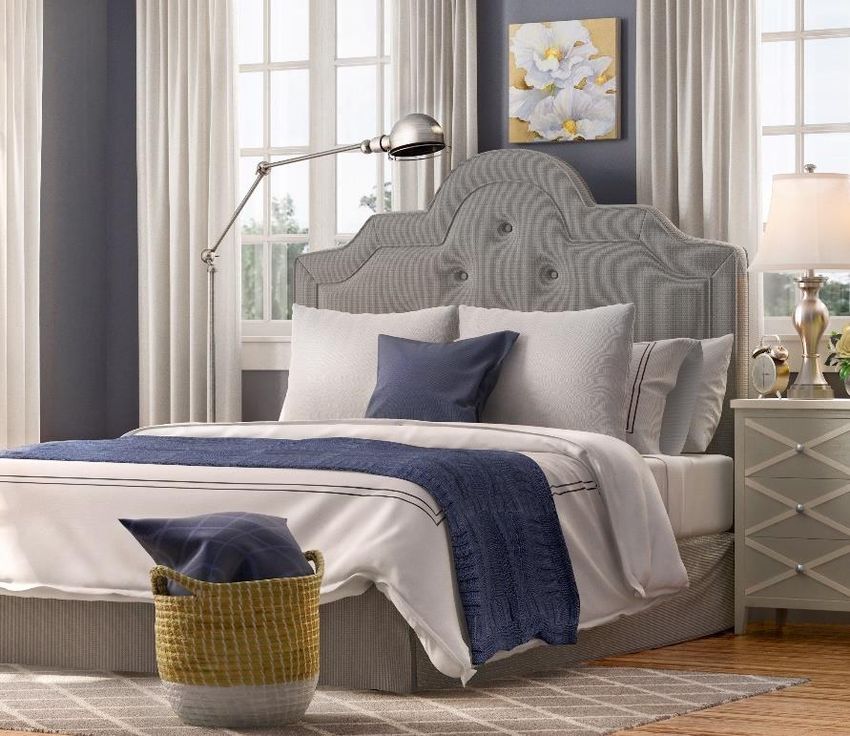
Large, Highly Fragmented Market Moving Online

                                                                                                        Significant Upside in
                        US Home Market Growth by Channel
                                                                                                         Online Penetration

                                                                                                     Estimated Online Penetration of
                                                                    CAGR                                   Selected Verticals
                                                                 ‘16-’20 ‘20-25
                                                                  4.1%        4.1%                                                 35%
                                                                                                                  20%
                                                  $386                                            9%

                                 $316
                                                   $96            15.0%      15.0%            Home Goods         Apparel        Consumer
  ($US in Billions)

                                                                                                                                Electronics
                       $269       $48
                        $27
                                                                                                  Millennials Beginning to Enter
                                                                                                        Our Target Demo

                                  $268            $291            2.6%       1.7%                  Illustrative Distribution of Home Goods
                       $242                                                                                    Customers by Age

                                                                                              Millennials
                                                                                              Age 21 - 34
                       2016      2020             2025

                              Online         Offline                                                   Age 35                   Age 65

Source: Euromonitor for market size and penetration, Wayfair estimates for growth 2015-2025
                                                                                                                                              5
Investor Presentation - August 2017 - StockDeck.io
Home Is Largely Browsed…

                           6
Investor Presentation - August 2017 - StockDeck.io
…And Not Searched

Most ecommerce shopping is done via branded search

This is not possible in home where brands are not known…

                       Leading Furniture and Home Décor Brands

…And consumers can’t describe what they are looking for
                                                                 7
Investor Presentation - August 2017 - StockDeck.io
Unlike Other Retail Categories, Home Shoppers
Desire Uniqueness

CPG Category Example:                Home Category Example:
    Paper Towels                            Lighting

                        VS.

                                                              8
Investor Presentation - August 2017 - StockDeck.io
Wayfair Is Focused on Mass Market and Is Well-Positioned vs.
    Other Retailers
Our typical customer: 35 to 65 year old woman with annual household income of $50k to $250k;
                         comScore median household income of $82k

                                  High End                                      Design Centers
                                   ($175K+)

                                Mass Market
                                 ($60K-$175K)

                                  Low End
                                    ($60K)

                                                                                                 9
Investor Presentation - August 2017 - StockDeck.io
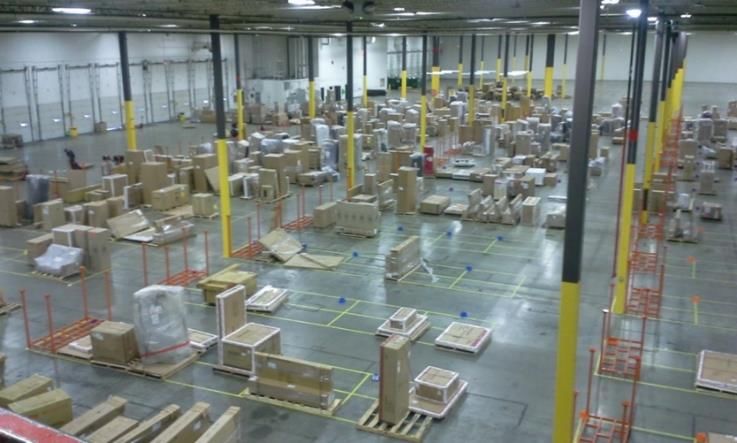
Five Distinct Home Sites Each with Unique Brand Identity

     Est. 2011                   Est. 2011                Est. 2006                   Est. 2014               Acq. 2013
An online destination        Where beautiful       Your home for affordable     A collection of classic   A design house with a
 for all things home    furniture and finds meet        modern design         furnishings and timeless    decidedly modern vibe
                           irresistible savings                                      home décor

                                                                                                                           10
Brand Awareness Has Grown to 81% Since Wayfair Brand
     Launch in 2011

                                             US Aided Brand Awareness

                                                                                                         81%
                                                                All TV buying
                                                               moved in-house

                                   Began Ramping
                                      TV Ads

   Launched first
     magazine
  partnership with                                                  First HGTV integration
   Coastal Living                                                  launched with “Brother
                                                                          vs. Brother”

                                         Tested TV
                                            Ads

February 2012                                                                                July 2017
Source: Qualtrics and Hanover Research
                                                                                                          11
Investing in Advertising Across Multiple Channels

• Three broad advertising channels - Online, TV and Direct Mail
• Online is the largest channel followed by TV and Direct Mail
• Strict adherence to channel derived ROIs
• Proprietary advertising technology stack

                               Online                                 TV

• Display                  • Social             • Transactional

                                                                  Direct Mail

                                                                                12
Award-Winning, In-House Customer Service Organization

•   Over 1,500 customer service employees located in the US and Europe
•   Winner of multiple awards for best retail customer service
•   Specialists with deeper expertise and training for select areas of the catalog, such as lighting,
    flooring and upholstery

                                         Customer Service Locations

                                                                                                        13
Proprietary Software Powers Key Parts of Our Business

• Company culture deeply rooted in technology and data
• Over 1,100 engineers and data scientists
• Becoming employer of choice for engineering and developer talent in Boston

                                  Examples of Proprietary Technology

       Ad Tech Stack                           Storefront                         Business Operations

      Keyword Search and                 Product         Stability and         Warehouse
      Retargeting Bidding               Discovery        Performance                            Transportation
                                                                                 Mgmt

    Campaign Management                Desktop and                               Product
                                                      Personalization                              Pricing
                                         Mobile                                  Catalog

   Measurement and Analytics                               Product
                                       Conversion                              Infrastructure    Order Mgmt
                                                         Globalization

                                                                                                              14
Growing Our House Brands in Partnership with Suppliers

• House brand penetration of Wayfair.com revenue is growing rapidly
• Partnering with suppliers to develop over 40 proprietary brands with exclusive products and no inventory
• Products are photographed and merchandized by Wayfair to create a curated brand experience across
  multiple styles and price points, enabling customers to more easily discover the products they are looking for

                                                                                                                   15
Investing in New Categories to Grow Share of Wallet

                   Home Improvement                             Wedding Registry & Housewares

    •   ~$45 billion US addressable market              •   ~$5 billion US wedding registry market and
    •   Focused on the finished areas of plumbing,          $25 billion US housewares market
        lighting, flooring that our customer chooses    •   Opportunity to capture millennials as they enter
        herself                                             key age for buying home goods

                    Key Competitors                                      Key Competitors

•   Other category investment areas include mattresses, seasonal décor, and decorative accents

                                                                                                               16
Large Incremental Addressable Markets in Canada,
     UK & Germany
• Europe total addressable market approximately equal to North America
• Localized Wayfair sites currently live in Canada, the United Kingdom and Germany
• Fragmented markets with no real online market leader; competitive landscape similar to US

                            Addressable Market for Home Goods by Region

                                                                         ~$50B
                                     Europe
               USA                   $300B
            (~$270B)
            & Canada                                                                          ~$75B
             (~$20B)

                                                                                                      17
3D Models Enable Visual Imagery and Exciting Future
         A/R Applications
• 3D images allow for inspiring visual imagery without the expense of product samples and physical photo studios
• Experimenting with augmented reality applications using Wayfair app on Tango enabled smartphones

           Image Rendered from 3D Models                           Wayfair App on Tango Device

                                                                                                            18
Search with Photo: See it Anywhere, Buy it on Wayfair

• Search with Photo capability enables shoppers to conveniently find the product they are looking for on
  Wayfair
• Wayfair shoppers are able to simply take a photo, or upload an image, of a product they like and Wayfair will
  leverage artificial intelligence and deep learning to find similar items from our selection of more than 8 million
  products
                                                  Tap.                   Snap.                  Results.

                                                                                                               Exact
                                                                                                               Match!

                                                                                                                       19
Home Category Characterized by Heavy, Bulky, and
Damage-Prone Items

         Average Wayfair Small         Average Wayfair Large
              Parcel Item                   Parcel Item

     •     ~30 pounds              •     ~80 pounds
     •     ~3 cubic feet           •     ~22 cubic feet

                                                               20
Investing in Proprietary Logistics Network Purpose-Built for
      the Home Category
• Traditional drop-ship network leverages technology integration into supplier warehouses
• CastleGate warehouses forward-position supplier inventory to create very fast delivery for small
  parcel (1 – 2 day) and large parcel (1 week plus)
• Wayfair Delivery Network (WDN) directly manages Wayfair’s large parcel deliveries via consolidation
  centers, cross docks and last mile home delivery facilities, thereby speeding up deliveries, reducing
  damage and improving the customer delivery experience

                       CastleGate and Wayfair Delivery Network (WDN) Locations

                                                                                          - CastleGate
                                                                                          Warehouse

                                                                                          - Consolidation
                                                                                          Centers and Cross
                                                                                          Docks (3rd Party
                                                                                          and Wayfair
                                                                                          Leased)

                                                                                           - Wayfair Last Mile
                                                                                           Home Delivery Agent

                                                                                                                 21
CastleGate Warehouses Enable Next-Day &
            2-Day Delivery for Small Parcel¹

                                        Traditional Drop Ship Model for Small Parcel Example

SUPPLIER WAREHOUSE IN                                                      FEDEX / UPS                                       END CUSTOMER IN
 SOUTHERN CALIFORNIA                                                                                                            NEW YORK

                                                                6-8 total touches, 4 – 5 day delivery time

                                                     CastleGate for Small Parcel Example¹
CASTLEGATE WAREHOUSE IN NEW JERSEY                                                                                          END CUSTOMER IN
                                                    WAYFAIR DEDICATED                                         FEDEX / UPS
                                                     TRANSPORTATION                                                            NEW YORK

   •       Pre-sorting at CastleGate •          Wayfair builds dedicated
           warehouse                            trailer for destination hubs

                                                             2-4 total touches, 1 day delivery time
                                                                                                                                               22
       1. Large parcel shipments can also go out of CastleGate but would use WDN instead of FedEx / UPS for last mile
Wayfair Delivery Network (WDN) for Large Parcel Deliveries

  • Wayfair Delivery Network (WDN) describes several areas of our large parcel network where we are taking
    direct operating control instead of relying on contracted third party operators
  • Enables schedule in cart, faster delivery speeds, increased customer satisfaction, reduced damage and
    costs
  • By end of 2017, expect to have virtually all large parcel shipments flowing through Wayfair-controlled
    “middle mile” and Wayfair last mile delivery facilities covering 50 - 60% of US population

                                Traditional Drop Ship Model for Large Parcel Example
    SUPPLIER WAREHOUSE IN   3RD PARTY CARRIERS TRAVELING LESS THAN TRUCKLOAD (MULTIPLE STOPS AND       3RD PARTY LAST MILE   END CUSTOMER IN
     SOUTHERN CALIFORNIA                       CARRYING NON-WAYFAIR PRODUCTS)                            DELIVERY AGENT         NEW YORK

                                                 6-8 total touches, 2 – 3 week delivery time

                                         Wayfair Delivery Network (WDN) Example

                                                           FULL TRUCKLOAD               WAYFAIR LAST MILE DELIVERY AGENT
SUPPLIER WAREHOUSE IN WAYFAIR CONSOLIDATION CENTER &                                     (MAJOR MARKETS) OR 3RD PARTY        END CUSTOMER IN
                                                        TRANSPORTATION (ONLY
 SOUTHERN CALIFORNIA           CROSS DOCKS                                                       (OTHER AREAS)                  NEW YORK
                                                          WAYFAIR PRODUCTS)

                                                 3-4 total touches, 1+ week delivery time
                                                                                                                                           23
Wayfair Delivery Network (WDN) for Large Parcel Deliveries

• Wayfair employees inside the four walls of the last mile home delivery facility; highly trained drivers
  running trucks out to the customer’s home
• Feedback loop and incentives consistent with our brand, including bonuses based on the NPS score
  provided by the customer post-delivery

                                                                                                            24
Wayfair.com Annual Cohort Performance as of 6/30/17

                                      $24x

                                      $22x                                        • Each cohort line is a function of the percent of customers
                                                                                    in the cohort who make repeat purchases and how much
                                      $20x
                                                                                    these repeating customers spend
                                      $18x
                                                                                  • Cohort lines show a steady tail of repeating revenue
 Wayfair.com Revenue/Customer/Month

                                      $16x
                                                                                  • Newer cohorts have higher revenue yield per customer
                                                                                    due to improvements in Wayfair site, selection,
                                      $14x
         (includes all customers)

                                                                                    merchandising and delivery since early days of Wayfair
                                      $12x                                          brand in 2011

                                      $10x

                                       $8x

                                       $6x

                                       $4x

                                       $2x

                                       $0x
                                             31-60   181-210   331-360    481-510      631-660      781 - 810      931 - 960    1081 - 1110   1231 - 1260   1381 - 1410
                                             Days     Days      Days       Days         Days          Days           Days          Days          Days          Days

                                                                         2011        2012        2013       2014         2015         2016

                                                                                Time Since Initial Purchase
Note on Methodology: First data point in chart is 31-60 days after the customer’s initial purchase. Cohort numerator includes revenue (indexed)                           25
                  25
from cohort customers in all future periods with at least 4 cohort data points through 6/30/17.
Customer Economics Continue to Improve:
        Strong Customer Acquisition
                                                                                                                             9.55
                                                                                                                     8.85
                                                                                                             8.25

                                                                                                     7.36
                                                                                         6.67
                                                                               6.07
                                                                        5.36
                                                            4.59
                                                 4.04
                                     3.60                                               $404        $406                    $402
                         3.22                                                  $392                         $395    $394
                 2.86                                                   $381
         2.64                                               $371
2.41
                                                 $357
                 $342    $342         $346
          $332
 $323

Q1'14    Q2'14   Q3'14   Q4'14       Q1'15      Q2'15       Q3'15      Q4'15   Q1'16    Q2'16      Q3'16    Q4'16   Q1'17   Q2'17

                                Direct Retail Net Revenue / Active Customer      Active Customers (mil)

                                                                                                                                    26
26
Customer Economics Continue to Improve:
           Growing Repeat Orders

                            Orders from repeat customers (’000s)               Orders from new customers (’000s)

                                                                                                                   2,739
                                                                                                                                    2,622
                                                                                                                            2,544

                                                                                                        1,943
                                                                      1,679       1,659      1,687                 1,983

                                                           1,282                                                            1,669   1,656
                                                1,109                 1,412                             1,473
                                      968                                         1,337
                           856                                                               1,243
                  654                                      1,042
577      560               846        829        850
                  659
561      524

                                                                                                                            60.4%    61.3%
                                                                                              57.6%                58.0%
                                                  56.6%                                                  56.9%
                                                             55.2%                 55.4%
                                      53.9%                            54.3%
 50.7%    51.6%
                  49.8%    50.3%

 Q1'14    Q2'14    Q3'14    Q4'14      Q1'15      Q2'15      Q3'15     Q4'15       Q1'16      Q2'16      Q3'16      Q4'16   Q1'17    Q2'17
                                                        % Orders from Repeat Customers

                                                                                                                                        27
Capital-Efficient Business Model

                                      Inventory                         Receivable and Payable Days1

                                                             $3,930                            43.2

                                                 $3,380

                                      $2,250

                        $1,319
          $916

                                                                              1.9
                 $15            $20        $20        $19         $15

             2013           2014        2015       2016        LTM      Days Receivable    Days Payable
                                         ($M)                 Q2'2017
                               Net Revenue       Inventory

                     FCF Performance Consistently Better than Adjusted EBITDA
1   Average of last four quarters.

                                                                                                          28
Long-Term Target Model

                                                                                                                                Long-Term
                                                                           2014             2015               2016    Q2’ 17     Target

                       Net Revenue                                          100%              100%             100%    100%       100%

                       Gross Margin                                         23.6%             24.0%           24.0%    24.2%     25 - 27%

                       Customer Service +
                                                                             4.1%              3.6%            3.7%     3.4%       4%
                       Merchant Fees

                       Advertising                                          14.5%             12.4%           12.1%*   11.1%*     6 - 8%
 Primarily headcount

                       Merchandising, Marketing,
                                                                             3.9%              4.0%            4.5%     3.9%      2 - 3%
                       and Sales
                       Operations, Technology,
                                                                             5.9%              4.9%            6.2%     5.9%      3 - 4%
                       General & Administrative

                       Total Operating Expenses                             28.4%             24.8%           26.6%    24.4%     15 - 19%

                       Adjusted EBITDA                                      (4.7%)            (0.7%)          (2.6%)   (0.2%)    8 - 10%

*US ad spend leverage muted by investment in international
Note: All expense line items exclude equity based compensation and related taxes and depreciation and amortization                         29
       29
Key Strategic Priorities

                       • Continue building our leading retail home brands
                       • Grow active customer base
                       • Increase repeat purchasing
                       • Continue scaling depth, breadth and penetration of our
                         house brands
                       • Invest in product/technology to further improve the
                         customer experience
                       • Grow newer categories such as home improvement and
                         housewares
                       • Enhance logistics infrastructure for faster and higher
                         quality customer delivery experience
                       • Invest in and grow international business
                       • Opportunistically pursue strategic acquisitions

                                                                                  30
Appendix

           31
Segment Adjusted EBITDA ($ in Millions)

                           Q1'16    Q2'16    Q3'16    Q4'16    FY 2016    Q1'17    Q2'17

US Direct Net Revenue      $672.7   $702.4   $759.7   $858.6   $2,993.4   $837.6   $976.7
Direct Growth              91.5%    67.9%    45.6%    31.3%     53.9%     24.5%    39.0%

US Total Net Revenue       705.9    732.7    787.8    884.1    3,110.5    858.0    997.1
Total Growth               76.2%    57.7%    39.1%    25.6%     45.7%     21.5%    36.1%

US Adjusted EBITDA          (1.0)    (2.9)    (7.9)    12.0      0.2       3.7      20.4
Margin                     -0.1%    -0.4%    -1.0%    1.4%      0.0%      0.4%     2.0%

International Direct Net
Revenue                     39.1     53.2     72.7    100.4     265.5     102.8    125.8
Direct Growth              116.5%   141.9%   214.5%   217.9%   180.0%     162.6%   136.2%

International Total Net
Revenue                     41.4     54.3     73.7    100.5     269.9     102.8    125.8
Total Growth               74.1%    100.3%   165.7%   181.0%   136.0%     148.1%   131.8%

International Adjusted
EBITDA                     (19.9)   (21.9)   (23.0)   (24.0)    (88.9)    (24.6)   (22.7)
Margin                     -48.1%   -40.4%   -31.2%   -23.9%   -32.9%     -24.0%   -18.0%
                                                                                            32
Reconciliation of Adjusted EBITDA ($ in Millions)

                                           2014       2015       2016      Q2
                                                                           Q4 2016   Q2 2017
          Net Loss                         ($148.1)   ($77.4)   ($194.4)   ($48.3)   ($38.9)

          Depreciation and Amortization     $22.0     $32.4      $55.6      $12.6    $19.3

          Equity-Based Compensation¹        $63.2     $33.0      $52.0      $11.3    $16.0

          Interest (Income) Expense, net    ($0.4)    ($1.3)     ($0.7)     ($0.5)    $1.6

          Other Expense (Income), net       $0.5      ($2.7)     ($1.8)     ($0.2)   ($0.5)

          Taxes                             $0.2       $0.1      $0.6       $0.3      $0.2

          Adjusted EBITDA                  ($62.5)    ($15.9)   ($88.7)    ($24.9)   ($2.2)

1. Includes related taxes

                                                                                               33
Reconciliation of Free Cash Flow ($ in Millions)

                                 2014      2015      2016      Q2 2016   Q2 2017

Net Cash Provided by Operating
                                  $4.1     $135.1    $62.8      $24.9       $18.1
Activities

Purchase of Property and
                                 ($31.9)   ($44.6)   ($96.7)   ($37.5)     ($33.5)
Equipment

Site and Software Development
                                 ($14.1)   ($17.5)   ($31.4)    ($6.8)     ($11.7)
Costs

Free Cash Flow                   ($41.9)   $72.9     ($65.3)   ($19.4)     ($27.2)

                                                                                     34
Headcount Summary

   • Total headcount of 6,049; 341 net new FTEs in Q2 2017
   • These employees augment existing business areas (e.g., customer service) but also help us build new
     revenue streams (e.g., international, new product and service offerings)

                                                     Customer Service,              Merchandising &                          Operations, Technology,
                                                    Warehouse, and Sales               Marketing                             General & Administrative
        Total Headcount by Functional Group

                                                                                                                                                      = 50 FTEs
Note: Totals may not match regulatory filings due to rounding. The expense related to a portion of the headcount in Technology is included in capitalized software
development costs.

                                                                                                                                                                     35
Illustrative Customer Acquisition Cost

                   (All units in millions, except per customer figures)
                                                                              2016

                   Total Advertising Spend                                           $409.1
                   Partner Ad Spend (1)                                               $11.0
                   Direct Retail Ad Spend                                            $398.1

                   Active Customers                                                   8.25
                   Total Orders                                                      14.06
                   % of Orders from Repeat Customers                                 57.1%
                   Implied New Customers (2)                                          6.04

                   Customer Acquisition Cost (3)                                       $66

                   Annual Direct Retail Revenue per Customer                           $395
                   Annual Contribution per Customer (4)                                 $79
                   Contribution Margin                                               20.0%

Note: Analysis above is most conservative calculation of customer acquisition cost. In reality, a
significant portion of the direct retail ad spend goes toward repeat customers, which makes the true
customer acquisition cost for new customers lower than the conservative calculation shown here
Notes:
1.   Retail partner fees disclosed in the 10K
2.   Calculated as (1- % of Orders from Repeat Customers)*Total Orders.
3.   Calculated as Direct Retail Ad Spend divided by Implied New Customers.
                                                                                                 36
4.   Represents 2016 Gross Margin less Customer Service and Merchant Fees .
You can also read