Quarterly Presentation - Q3 2020 - Cision
←
→
Page content transcription
If your browser does not render page correctly, please read the page content below

Meet the world
with video communication as it should be

Quarterly Presentation
Q3 2020
10 November 2020

Important notice and disclaimer
These materials have been produced by Pexip Holding AS (the "Company“, and with subsidiaries the “Group”). The materials have been prepared for the exclusive
use of persons attending an oral briefing and meeting to which these materials relate given by a representative of the Company and/or persons to whom these
materials have been provided directly by an authorized representative of the Company (the “Recipients”). For purposes of this notice, "materials" means this
presentation, its contents and appendices and any part thereof, any oral presentation and any question or answer session during or after or in relation to any of
the foregoing.
The materials are for information purposes only, and does not constitute or form part of any offer, invitation or recommendation to purchase, sell or subscribe for
any securities in any jurisdiction and neither the issue of the information nor anything contained herein shall form the basis of or be relied upon in connection
with, or act as an inducement to enter into, any investment activity. The materials comprise a general summary of certain matters in connection with the Group,
and do not purport to contain all of the information that any recipient may require to make an investment decision. Each recipient should seek its own
independent advice in relation to any financial, legal, tax, accounting or other specialist advice.
No representation or warranty (expressed or implied) is made as to any information contained herein, and no liability whatsoever is accepted as to any errors,
omissions or misstatements. Accordingly, the Company or any such person's officers or employees accepts any liability whatsoever arising directly or indirectly
from the use of the materials.
The materials may contain certain forward-looking statements relating to the business, financial performance and results of the Company and/or the industry in
which it operates. Forward-looking statements concern future circumstances and results and other statements that are not historical facts, sometimes identified
by the words "believes", "expects", "predicts", "intends", "projects", "plans", "estimates", "aims", "foresees", "anticipates", "targets", and similar expressions. Any
such forward-looking statements are solely opinions and forecasts which are subject to risks, uncertainties and other factors that may cause actual events to
differ materially from any anticipated development. No liability for such statements, or any obligation to update any such statements or to conform such
statements to actual results, is assumed.
These materials are not intended for distribution to, or use by, any person in any jurisdiction where such distribution or use would be contrary to local laws or
regulations, and by accepting these materials, each recipient confirms that it is able to receive them without contravention of an unfulfilled registration
requirements or other legal or regulatory restrictions in the jurisdiction in which such recipients resides or conducts business.
This presentation and related materials speaks only as of the date set out on the cover, and the views expressed are subject to change based on a number of
factors. The Company does not undertake any obligation to amend, correct or update the materials or to provide any additional information about any matters
described herein.

                                                                                                                                                         2
Q3 highlights

                                                       Added
                       Accelerating long-term
         70%
                        target with one year:
     growth in ARR                                   as customers
                        300 MUSD by 2024
                                                + 7 new F500 accounts

        Visionary
                       Private Cloud is ready       307 employees
    in Gartner Magic
                             to launch           up 80% year-on-year
        Quadrant

                                                                 3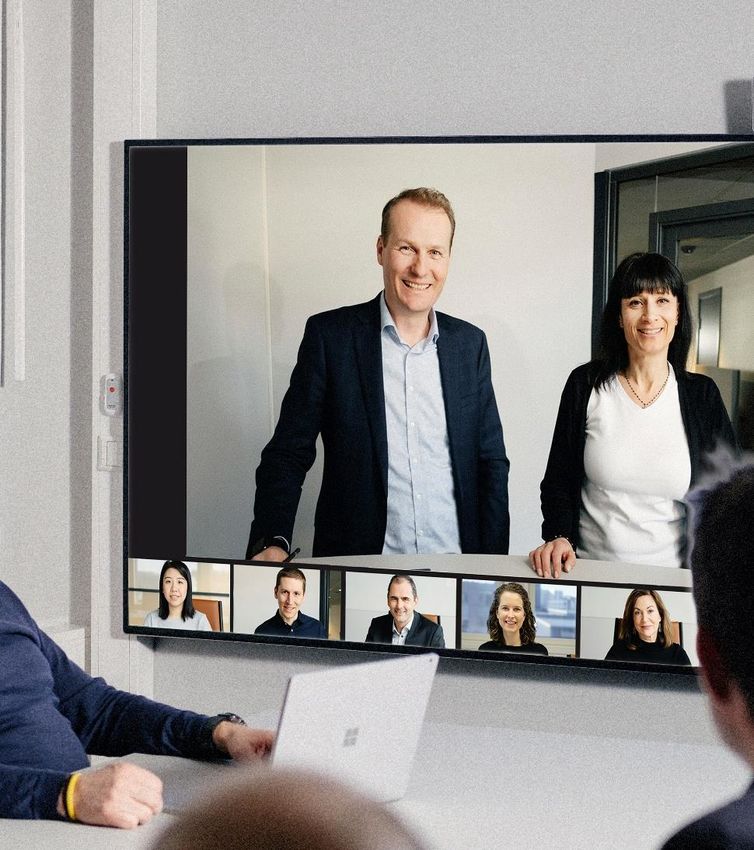
Business update

✓A better way to meet with business-quality
                              audio/video
Video communications as it
                             ✓Securely join from anywhere across multiple
        should be             technologies
                             ✓Powerful administration tools and integrations to
                              meet the requirements of IT
                             ✓Full control of data privacy and sovereignty, and
                              compliance with data security standards
Pexip is a high-growth subscription-based video
communication company
Booked Annual Recurring Revenue (“ARR”)
portfolio per year end, USDm
                                                                  73

                                                                        •   Users in ~190 countries
                                     CAGR
                                                                        •   ~300 partners in 75 countries
                                                           47           •   +300 employees in 20+ countries
                                ~70%
                                                                        •   97% of revenue from subscriptions
                                                   36
                                            29

                                21
                                                                                           EMEA       Americas       APAC
                       12
             5                                                              Share of ARR   55%          35%          10%
    2

  2013      2014     2015      2016         2017   2018   2019   2020
                                                                  Q3

                                                                                                                 6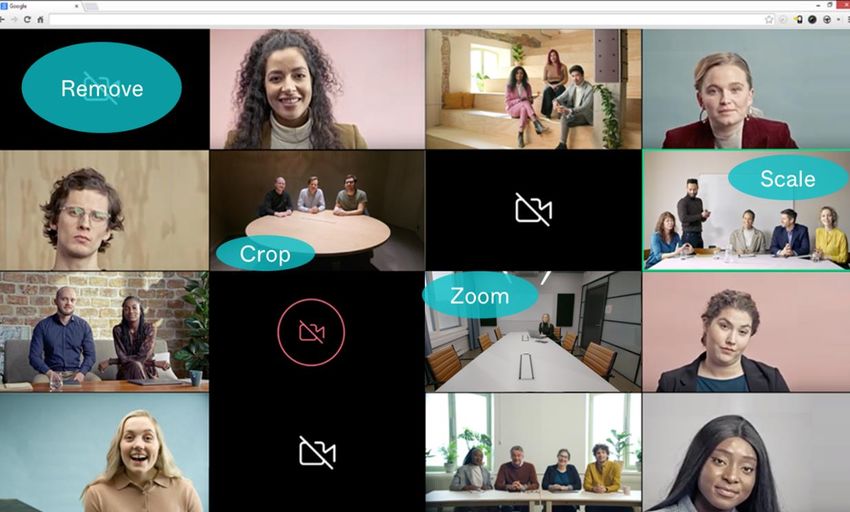
Solid growth path to USD 300 million

                               6                                1
                                                                    Massive, high-growth market
                                   Solid growth path to reach
                                                                    with unique position towards
                                           USD 300m
                                                                    lucrative enterprise segment

    5                                                                                 2
         Massively scalable business                                                        Industry recognized video
        model with high sustainability                                                    communication platform with
                   impact                                                                      unique technology

                               4                                3
                                   Trusted by high demanding        Exceptional R&D team with a
                                    enterprise customers and         history of industry defining
                                   government organizations                   innovation

                                                                                                                   7
Pexip accelerates long-term target of reaching USD 300 million

                                                           ARR of USD 300m by end-of-2024, one year earlier than previously
                         Revenue growth                    communicated

                                             2025 EBITDA of +25% with +25% revenue growth
            Long-term profitability
                                            Plan for neutral to positive EBITDA in 2023, negative 25-35% EBITDA margin in 2021/2022

    Market recognition        Recognized leader position in the Meeting Solutions market within 3-4 years

                                                                                                                                      8
Enterprise IT will re-assess video strategy
post-Covid

       “Everybody” has started using video
       in 2020                                          Key questions to be asked by customers

                                                        Do we have the features we need?

                                                        Given we use video so much, are we having the right
       PC-to-PC has been the primary use                meeting quality and experience?
       case
                                                        Is data about our conversations protected?

                                                        Is our current solution in line with our security
                                                        policies?
       As Organizations plan their return to
       the office, many will need to re-
       evaluate their existing solution

          Pexip will be more relevant than ever, both as stand-alone and add-on solution to others

                                                                                                              9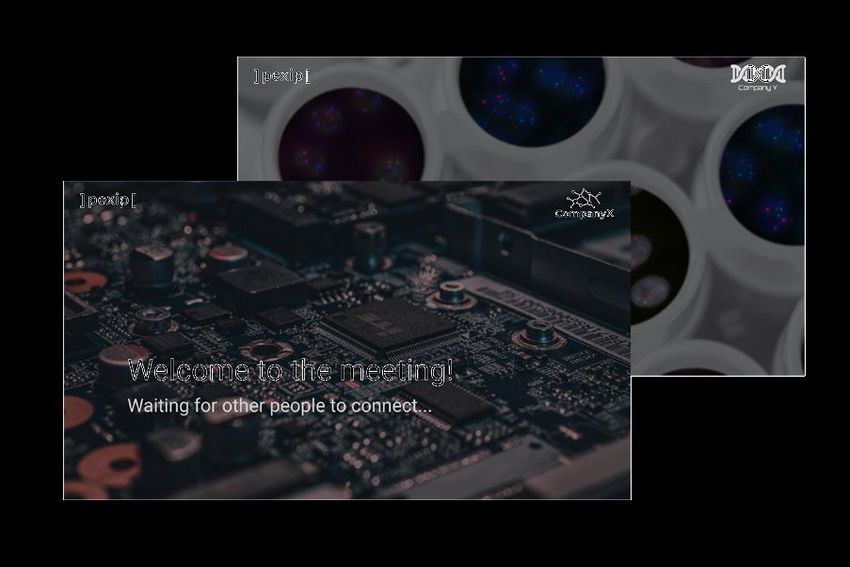
Pexip ideally positioned for enterprises’ reality as
organizations return to the office
                        Conference rooms

                                                               The new normal will be hybrid working

                                                               •   People combining working from home
                                                                   and the office
                                                               •   “Every” room in the office will have a
                                                                   video device
                                                               •   “Every” meeting will be a video meeting
                                                               •   Need to connect everything from the
                                                                   browser to the board room – internally
                                                                   and externally

   Small huddle rooms                      Working from home

                                                                                                             10
Bring meetings to life A natural, engaging meeting experience provided by AI-driven adaptive experience Bring meetings to life Focus on your conversation Say goodbye to black screens and hard-to-see faces. Naturally With real-time image framing that automatically crops, pans, arranges your screen layout to elevate large groups and active and tilts, you can maintain better eye contact and focus on speakers, creating a more immersive meeting experience. Enjoy your conversation for more productive, engaging meetings. super-wideband audio for a natural experience.
Pexip is the leader on interoperability

                                       Partner

                                                                • 62% of organizations use more than three video
                                                                 communication solutions1
                                                                • Deep technology and GTM partnerships with collaboration
                                                                 giants
                                                                • Allows solutions from Microsoft and Google to immediately
                            Proven interoperability              connect with a range of non-compatible systems
                                 leadership
                                                                • Maintains the video system’s full capabilities
                                                                • Pexip is the only solution in the market that is available both as
            webRTC
                                                                 a cloud service and as a self-hosted software
                                       Partner

                                         Hangouts Meet

1) The State of Group Video Conferencing - Wainhouse Research
                                                                                                                         12
Customers choose Pexip for three main use cases
High-quality video
Vertical market Expanding access to
meetings with focus
applications and Microsoft Teams and
on privacy and
integrations Google Meet
security
13Pexip is for the second time named a
Visionary in the recent Gartner Magic
Quadrant
• Gartner MQ is a key IT buyer awareness
driver and decision support
• Gartner highlights Pexip’s strengths in:
• Expansive APIs
• Interoperability leadership
• Vertical industry expertise
*Source: Gartner Quadrant for Meeting Solutions 2020, by Mike Fasciani, Tom Eagle, Adam PresetPexip continues to win the trust of new large
enterprises and public organizations
Selected by a range of large organizations Large organizations driving growth
Selected new customers in Q3 2020 Share of ARR by account size in ARR, USD
73M YoY growth:
+70%
25% 23%
43M 24% 34%
35%
30% 145%
51%
36%
+ 7 new Fortune 5001 customers Q3 2019 Q3 2020
USD >100,000 USD 30,000-100,000 USDEnabling sustainable development for our
customers and users
Pexip contributes to the green economy
• Pexip is committed to supporting our customers in making
their business processes more sustainable
– Enabling vital healthcare service delivery despite severe
Covid-19 disruption
– Enabling significant reductions in travel and commuting
• Pexip has initiated a project to deliver a separate
sustainability report outlining Pexip’s ESG impact due Q2
2021
16Pexip has started on the next phase of our video
communication adventure
ARR target of
USD 300m
by 2024
Established leadership
position within larger
collaboration market
IPO
2020
Founded
2011
*Equity of USD 25m1 turned into ARR of USD 57m at time of IPO
1) NOK 225m, USDNOK 9.00
17Product update
Solid progress on Pexip Private Cloud pilots
– commercial launch in Q4 2020

                   Rob Arnold, Program Manager,
                   Unified Communications and
                   Collaboration
Continue to make virtual meetings even
better than in-person meetings
Service features released last three months
1080p on GW/VMRs Adaptive Composition Custom Branding
• Higher resolution improving • Bring your meetings to life • Customised, branded background
meeting experience • Initiated Tech preview on Service images and logosAmericas
10 new US Fortune 1000 companies chose Pexip
in Q3 across several industries

                              2 Food Service and Food Products

                   2 Energy                                      2 Technology

     1 Insurance                1 Retail           1 Healthcare            1 Furnishings

                                                                                           22
Recent sales successes demonstrate Pexip’s
appeal to security-conscious organizations
• The National Aeronautics and Space
Administration is an independent agency of the
U.S. Federal Government responsible for the
civilian space program, as well as aeronautics
and space research
• One of the eleven unified combatant commands in the United States
Department of Defense
• USNORTHCOM partners to conduct Homeland Defense and Civil
Support operations within the assigned area of responsibility to
defend, protect, and secure the United States and its interests
23Sales results and financials
Strong development in Annual Recurring Revenue
with 70% growth YoY

Booked Annual Recurring Revenue (ARR) development                                       Q-o-Q growth in ARR
USDm                                                                                    USDm

                                                                                73
                                                                                                                      2.6X
                                                               +70%     66                                                        7.0

                                                                57

                                                      47
                                          43
                                40
                      38
  34        36
                                                                                                     1.9X
                                                                                                              2.7

                                                                                               1.4

Q3 2018   Q4 2018   Q1 2019   Q2 2019   Q3 2019     Q4 2019   Q1 2020 Q2 2020 Q3 2020     Q3 2018           Q3 2019          Q3 2020

                                                                                                                             25
Growth across all main product lines and geographies
ARR per geo ARR per product
USDm USDm
APAC
AMERICAS Cloud Service
EMEA YoY growth: Software YoY growth:
73 73
66 7 37% 66
57 7 57 27 101%
6 25 73% 24
47 47
43 23 43 19
6
5 20 16
13
15
15
46 55%
40 75% 42
36 37
31 30 32
23 26
Q3 2019 Q4 2019 Q1 2020 Q2 2020 Q3 2020 Q3 2019 Q4 2019 Q1 2020 Q2 2020 Q3 2020
26Significant improvement in new sales in Q3 2020
Development in ARR portfolio last twelve months
USDm
+25% -10% +70%
• Year-on-year growth increased to
4.2 72.8
+55% 10.5 70% out of Q3 2020 from 64% out
of Q2 2020
23.5 Net retention of 115% • Majority of growth driven by net
new sales, up from 46% in Q2 2020
42.9
• Net retention at 115%, slightly
down from 118% in Q2 2020
• Slight increase in churn to 10%
from 8% related to an increase in
churn from smaller accounts
Q3 2019 New Sales Net Upsell Churn Q3 2020
27NOK 136 million in Q3 revenue with
68% revenue growth
Quarterly revenue development Q1 2019 – Q3 2020 Comments
NOKm
Operating revenues – Cloud service
• Overall year-on-year growth of 133% to NOK 60 million due to
strong sales across a number of accounts, especially driven by a
+68% large account in Americas. Benefit from higher USD/NOK exchange
163.1
rate last twelve months
150.1
• Cloud service revenues are recognized over the lifetime of the
136.3
subscription contract
116.9
Operating revenues - Software
89.9 • Overall growth of 38% to NOK 76 million. Strong sales in Americas
82.2 81.0 across private and public sector growing 99% y-o-y. APAC sales
impacted by delayed renewal of a single large customer where the
renewal was executed in October 2020 (Difference of NOK -6.1
million in Q3 2020 vs Q3 2019 from this account).
• Software revenue mainly recognized at time of delivery
• Seasonally Q3 has a lower sales volume than Q2, similar to 2019
28
2019 Q1 2019 Q2 2019 Q3 2019 Q4 2020 Q1 2020 Q2 2020 Q3 Gross margin
Gross margin, Percent of revenue • Gross margin somewhat down due to high Cloud Service share in
Q3 2020. Cost of Sales in line with Q2 following the scale-up of our
94% 94% 95% 96% 97% 94% 92% infrastructure in Q1/Q2.Strong progress on acceleration plan
Number of employees
Other
Engineering
• Increased sales capacity key element of
Sales and Marketing
supercharging existing sales model
307
+80% • Continuing to add high-quality software
31
engineers to deliver on roadmap
116 Have also strengthened corporate functions
171 •
14 within HR, Accounting and Operations
70 • Continue to invest in building and strengthening
160 the Pexip Way culture
87
Sep-19 Sep-20
29Increase in operating expenses from
higher headcount
Quarterly OPEX development Q1 2019 – Q3 2020 Comments
NOKm IPO-related costs
Other operating expenses
Salary and personnel expenses
Other Operating expenses
• Have increased investments in marketing in order to capitalize
158.9 on the increased demand for video collaboration technology
149.0
• Overall increased activity level
46.3 31.7
109.4 Salary and personnel expenses
1.5
32.8 • Increase in costs from significantly increased headcount
80.5 35.4 throughout 2019 and in YTD 2020
64.5 66.1 63.7 21.4 • Q-o-Q increase also in part related to periodization of holiday
21.5 23.9 17.9 117.3 pay reducing Q2 Salary and personnel expenses
72.6 79.8
59.2
43.0 42.3 45.8
2019 Q1 2019 Q2 2019 Q3 2019 Q4 2020 Q1 2020 Q2 2020 Q3
30Reduction in EBITDA in line with acceleration plan
Quarterly Adjusted1 EBITDA development Q1 2019 – Q3 2020 Comments
NOKm
37.3 40.4
32.0 • Reduction in EBITDA due to planned acceleration investments
in Sales and R&D capacity increasing Employee Benefit
19.8 Expenses
11.5 13.0 – 45% of employees (which is majority of cost base) are net
new employees with less than 12 months history
– 30% with less than 6 months history
• Full revenue impact of a new role in a recurring revenue
-23.8 business model will accumulate over several years
2019 Q1 2019 Q2 2019 Q3 2019 Q4 2020 Q1 2020 Q2 2020 Q3
• In addition, seasonally lower software sales in Q3 impacts
Adjusted1 EBITDA margin, Percent of revenue EBITDA for the quarter
22% 14% 16% 27% 25% 25% -17%
1 Less of IPO transaction costs in Q1 and Q2 2020
31Cash flow bridge
Cash flow bridge Q3 2020 Comments
NOKm
• Have a solid cash position to fund our
acceleration plan, which is also impacting
1,217 cash flow
24 9 11 1,159
30 3 6
• Increase in net working capital driven by an
increase in trade receivables and contract
cost assets
• CAPEX is 25% higher than in Q3 2019, and
lower than Q2 2020 due to lower IT
infrastructure spend
• Cash position of NOK 1,159 million out of Q3
2020
Cash EBITDA Share- CAPEX NWC Financing Other, incl. Cash
balance based activites exchange balance
EoQ2 payments incl. leases differences EoQ3
2020 2020
32Summary
Strong top line growth
                         • Added a range of new high-profile Fortune 1000
                           companies and large public organizations
                         • Outstanding quarter especially in the Americas
                         • Continued strong ARR growth with USD 7 million
                         • 68% year-on-year growth in revenue
Third quarter in brief   Executing on the acceleration plan
                         • Continue to build sales and R&D capacity
                         • Named a Visionary in the Gartner Magic
                           Quadrant for Meeting Solutions for the second
                           year in a row
                         • Customer base acquisition in Q3 expected to
                           positively impact Q4 ARR
                         • Solid cash position to invest in further growth
Positive medium- and long-term outlook for video
communication
• Majority of enterprises shifting to a hybrid
workforce
• Pexip’s technology is uniquely positioned to meet
these new customer needs
Will continue to execute on growth plan
• Increase investments in future growth by adding
talent in sales and marketing as well as R&D –
targeting 350-400 employees by end of 2020
• Deploy up to 70% of raised capital during the
Outlook next three years
Expect to reach long-term target of USD 300
million in ARR by 2024, from a earlier presented
target of USD 300 million by 2025Upcoming dates
Investor Tech Summit December 9th 2020 at 15-17 CET
Update on Annual Recurring
Revenue January 7th 2021
Q4 2020 quarterly
presentation February 11th 2021
36Q&A
Meet the world
with video communication as it should be

Quarterly Presentation
Q3 2020
10 November 2020
You can also read