Boyd Gaming Acquisition of Pinnacle Entertainment Assets - December 18, 2017 - Boyd Gaming: Investor Relations Home
←
→
Page content transcription
If your browser does not render page correctly, please read the page content below
Boyd Gaming Acquisition of Pinnacle Entertainment Assets
December 18, 2017
Unique Opportunity to Enhance Shareholder Value
Four high quality, well maintained assets in attractive markets
Expands portfolio reach into three of the top 30 MSAs with more than 5 million adults in aggregate
Transaction Overview
Attractive purchase price of $575 million
Implies 6.25x 2017E EBITDA or 5.7x1 2017E EBITDA including synergies
Increases scale and establishes presence in three new markets
Perfect geographic fit within regional portfolio; no overlap with existing operations
Compelling Strategic Creates OpCo platform for future growth
Rationale
Accretive to B Connected Customer Loyalty Program
Directly aligns with the Company’s long term growth strategy of acquiring attractively priced, high-quality
assets in strong and growing markets that generate substantial free cash flow
Strengthens financial profile, limited impact on leverage and enhances capital return program over time
Improves growth profile
Compelling Financial
Highly accretive to earnings and free cash flow
Rationale
High return potential
Revenue and cost synergy potential
Acquisition will Generate Meaningful Value for Boyd Shareholders
1. Assumes $8mm run rate synergies 1
Transaction Overview
Ameristar Casino Resort Spa in St. Charles, Missouri
Ameristar Casino Hotel in Kansas City, Missouri
Four High Quality Assets
Belterra Casino Resort in Florence, Indiana
Belterra Park in Cincinnati, Ohio
Purchase Price Approximately $575 million
Valuation Attractive implied purchase multiple of 6.25x 2017E EBITDA or 5.7x1 including synergies
Gaming & Leisure Properties, Inc. (GLPI) will acquire ownership of Belterra Park’s real estate and retain
Real Estate Ownership ownership of the other properties’ real estate
Boyd to enter into new master lease agreement with GLPI at an estimated ~1.9x rent coverage ratio
Boyd intends to finance the transaction through cash flow from operations and availability under existing credit
Financing facilities
No financing contingency
Expected to close in second half of 2018
Expected Closing
Subject to customary closing conditions and required regulatory approvals
1. Assumes $8mm run rate synergies 2
Pinnacle Assets Overview
Four high-quality, well-maintained assets in attractive markets

                                      Regulatory       Slot                             Casino    F&B / Entertainment
Property                 Market       Jurisdiction   Machines Table Games Hotel Rooms   Sq. Ft.         Venues

Ameristar St. Charles    St. Louis     Missouri       2,410       104         397       130,000         15 / 6

Ameristar Kansas City   Kansas City    Missouri       2,154        71         184       140,000         12 / 2

                        Cincinnati/
Belterra                Louisville/     Indiana       1,165        47         662       47,000           6/2
                        Lexington

Belterra Park           Cincinnati       Ohio         1,376        --          --       51,800           6/2

Total                                                 7,105       222        1,243      368,800         39 / 12

                                                                                                                        3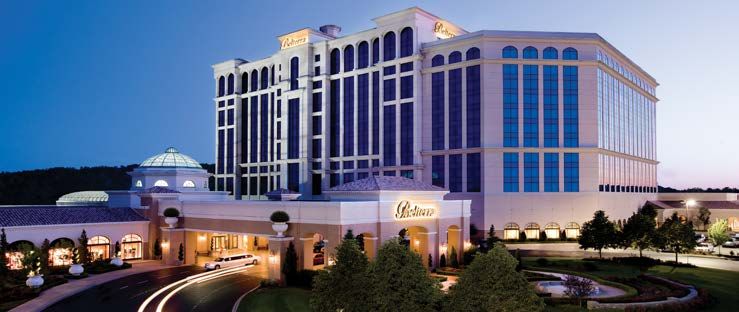
Strategic Rationale
Increases geographic diversity in attractive new jurisdictions across three of the largest metropolitan areas in
Increases Geographic the Midwest – St. Louis, Kansas City and Cincinnati
Diversity & Scale 1.7 million square feet of casino gaming space, ~38,000 slots, 900 table games and 11,000 hotel rooms
increases footprint to 28 properties in 9 states serving 17 separate markets
Complements Existing Ideal geographic fit with no overlap with existing operations
Midwest Portfolio Pro forma, Boyd will be one of the leading gaming companies in the Midwest
Represents Boyd’s first OpCo transaction – creates platform for future growth
Creates OpCo Platform for Partnership with REIT creates another avenue for Boyd to pursue growth opportunities and create
Future Growth shareholder value
Currently estimated ~1.9x rent coverage ratio in new master lease agreement with GLPI
Significantly expands Boyd’s rewards program player database
Accretive to B Connected
Customer Loyalty Program Supporting the Company’s “hub and spoke” strategy whereby Boyd is able to drive regional demand to its
destination resorts
4
Pro Forma National Footprint
Expands geographic diversity and complements existing Midwest portfolio
GEOGRAPHIC PROFILE
Las Vegas Locals Segment
Aliante Casino Hotel and Spa
Cannery Casino Hotel
Eastside Cannery Casino & Hotel
Gold Coast Hotel and Casino
The Orleans Hotel and Casino Diamond Jo Worth Blue Chip Casino
Diamond Jo Dubuque Boyd Gaming Jurisdictions
Sam’s Town Las Vegas Par-A-Dice Hotel Casino Las Vegas Locals Segment
Suncoast Hotel and Casino Ameristar St. Charles Belterra Park
Ameristar Kansas City Downtown Las Vegas Segment
Eldorado Casino Las Vegas
Belterra
Kansas Star Casino Midwest and South Segment
Jokers Wild Casino
Pinnacle Assets
Sam's Town Tunica
Downtown Las Vegas
California Hotel and Casino Sam’s Town Shreveport
Fremont Hotel and Casino Evangeline Downs Casino
IP Casino Resort Spa
Delta Downs Racetrack Casino Treasure Chest Casino
Main Street Station Casino
Amelia Belle Casino
1
ADJ. EBITDA BY REGION ($MM)
BOYD GAMING PRO FORMA COMPANY
$586 Downtown
$678
Downtown
LV LV
8% 7%
LV Locals
LV Locals 31%
36%
Midwest & Midwest &
South South
56% 62%
% Operating Assets 0% 14%
Note: Please refer to Boyd Gaming Corporation’s SEC filings Form 10-K for the year ended December 31, 2016 and Form 10-Q for the nine months ended September 30, 2017 for reconciliations of non-GAAP 5
measures to GAAP.
1. Represents Boyd 9/30/2017 LTM EBITDA and 2017E EBITDA for acquired assets
Enhanced Scale

CASINO FLOOR SPACE
(000’s SQ. FT)                                          SLOT MACHINES                  TABLE GAMES              HOTEL ROOMS

                                                                                                          878
                                  1,683                                      38,111
                                                                                                                              10,756

                                                                                                                    9,513
                                                            31,006
        1,315                                                                               656

                                                                     Boyd Standalone     Boyd Pro Forma

Note:    Standalone Boyd data as of December 31, 2016                                                                                  6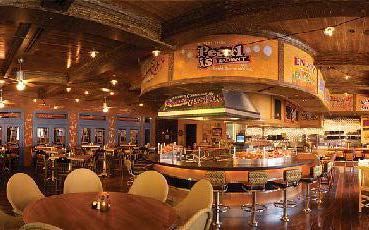
Financial Rationale
Attractive Valuation Implied 2017E EBITDA multiple of 6.25x before synergies and 5.7x1 including synergies
Highly Accretive to Immediately accretive to earnings and free cash flow
Earnings & Free Cash Flow Robust free cash flow from assets supports capital return program and de-leveraging plan
Improves top-line and bottom-line growth rates
Improves
Embedded growth in existing assets
Growth Profile
Additional upside from cross-marketing opportunities
Cost Synergy Potential Expected $8 million in run-rate synergies, achieved in second full year of ownership
New Revenue Access to new customers in large markets where we have limited exposure today
Opportunity Opportunity to drive customers from these markets to destination properties
Debt / EBITDA increases by only ~0.2x given OpCo structure at close
Limited Impact
Post the acquisition, Boyd expects to be leveraged ~5.0x Adj. EBITDA by year-end 2018
on Leverage
Boyd retains financial flexibility to pursue accretive M&A
7
1. Assumes $8mm run rate synergies
Pro Forma Operating Performance
Increases Adj. EBITDA by 16% to $678 million

PRO FORMA ADJ. EBITDA ($MM)

                                                                                                                                                                           $678
                                                        $586                                                                                                                $48
                                                         $48
                                                                                                                                                                           $213
                                                        $213

                                                                                                                                                                           $417
                                                        $325

                        Boyd Consolidated LTM 9/30/2017                                           (1)
                                                                                                                                                                     Pro Forma             (2)

                                                 Midwest and South                                      Las Vegas Locals                             Downtown Las Vegas

Note:   Please refer to Boyd Gaming Corporation’s SEC filings Form 10-K for the year ended December 31, 2016 and Form 10-Q for the nine months ended September 30, 2017 for reconciliations of non-GAAP
        measures to GAAP.
1.      Segment EBITDA includes proportional amount of corporate expenses                                                                                                                                 8
2.      Represents Boyd 9/30/2017 LTM EBITDA and 2017E EBITDA for acquired assets
Improves Free Cash Flow Profile
Transaction supports Boyd’s capital return program
PRO FORMA FREE CASH FLOW GENERATION ($MM)1
Increases free cash flow generation; accelerating future leverage reduction
− Adds $41 million in free cash flow; pro forma LTM free cash flow increased to approximately $302 million
No change to current capital return program, with potential to significantly enhance returns going forward
$302
$261
Boyd Standalone LTM 9/30/2017 Pro Forma LTM(2)
Note: Please refer to Boyd Gaming Corporation’s SEC filings Form 10-K for the year ended December 31, 2016 and Form 10-Q for the nine months ended September 30, 2017 for reconciliations of non-GAAP
measures to GAAP.
Source: SEC filings 9
1. Free cash flow calculated as EBITDA less interest expense, maintenance capital expenditures and taxes
2. Represents Boyd 9/30/2017 LTM free cash flow and 2017E free cash flow for acquired assetsImproves Boyd Gaming’s Scale and Competitive Position
This transaction further separates Boyd from regional competitors
PRO FORMA LTM 9/30/2017 ADJ. EBITDA VERSUS PUBLIC COMPARABLES ($MM)
$800
$700 $678 (1)
$586
$600
$500
$411 $409
$400 $351
$310
$285
$300
$188
$200 $166
$100 $58
$0
Pro Forma Boyd Red Rock Penn Eldorado Churchill Pinnacle(3) Tropicana Golden Monarch
(3)
Boyd Resorts (2) National Resorts, Inc. Downs
Note: Please refer to Boyd Gaming Corporation’s SEC filings Form 10-K for the year ended December 31, 2016 and Form 10-Q for the nine months ended September 30, 2017 for reconciliations of non-GAAP
measures to GAAP.
LTM as of 9/30/2017
1. Represents Boyd 9/30/2017 LTM EBITDA and 2017E EBITDA for acquired assets
2. Includes adjustment for Native American management EBITDA 10
3. Net of rent expenseI. Property-Level Details
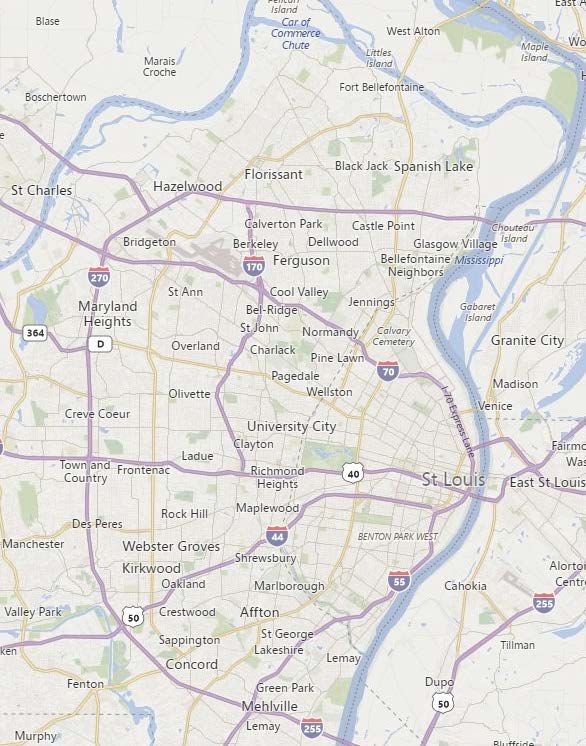
Ameristar Casino Resort Spa in St. Charles, Missouri
PROPERTY OVERVIEW MARKET MAP
Placeholder photo
LOCATION
St. Charles, Missouri
Located just west of the St. Louis Lambert International Airport in historic St.
Charles
PROPERTY DESCRIPTION
Opened in 1994; expanded into an all-suite hotel, spa and indoor-outdoor pool
which opened in 2008
AAA Four Diamond full-service hotel
Offerings include:
− More than 2,400 slot and video poker machines
− 104 table games
− New Baccarat pit
− Star Club, hotel, spa, fitness, conference center and pool facilities
− Diverse dining, entertainment and shopping amenities
12
Source: SEC filings.Ameristar Casino Hotel in Kansas City, Missouri
PROPERTY OVERVIEW MARKET MAP
LOCATION
Kansas City, Missouri
Located on the banks of the Missouri River, just east of downtown Kansas City
PROPERTY DESCRIPTION
140,000 square-foot property features the largest casino and the most games in
the Kansas City area
AAA Three Diamond full-service hotel with 184 rooms and suites
Offerings include:
− More than 2,100 slot and video poker machines
− Exclusive high-limit slot and table games areas
− 71 table games
13
Source: SEC filings.Belterra Casino Resort in Florence, Indiana
PROPERTY OVERVIEW MARKET MAP
LOCATION
Located on the banks of the Ohio River, near the Markland Dam in Switzerland
County, Indiana
Easy driving distance for nearly 5 million people in a 100-mile radius
Less than 45 minutes from Cincinnati, Ohio, and approximately a one-hour drive
from Louisville, Kentucky
PROPERTY DESCRIPTION
47,000 square feet of casino space with 662 newly-renovated guest rooms and
suites
Features approximately 1,200 slot and video poker machines, as well as a series
of live games including Blackjack, Craps and Roulette
Offerings include:
− 1,500-seat entertainment showroom
− 18-hole golf course
− Six food venues, retail stores, full-service spa and salon
14
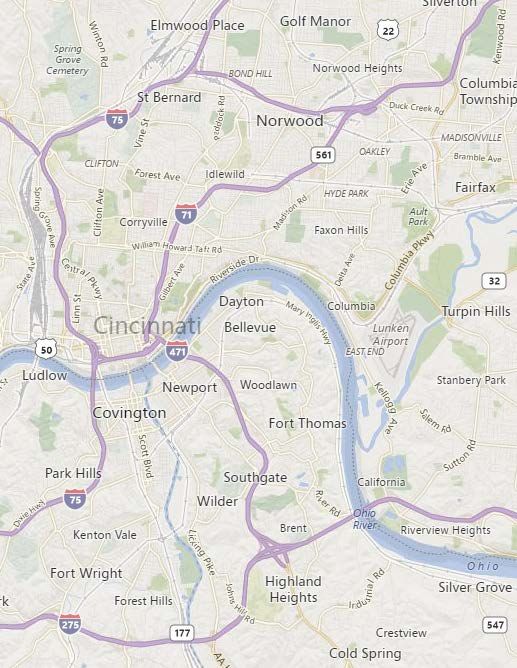
Source: SEC filings.Belterra Park in Cincinnati, Ohio
PROPERTY OVERVIEW MARKET MAP
LOCATION
Located in Anderson Township, Ohio, just outside the southeast limits of
Cincinnati
The race track sits on the banks of the Ohio River
PROPERTY DESCRIPTION
Gaming floor consists of 51,800 square feet of gaming
Features live thoroughbred racing, pari-mutuel wagering and more than 1,300
games (video lottery terminals)
Over $300 million of capital investment since 2014
Offerings include:
− Dirt Track – 1 mile & Ohio’s Only Turf Track – 7/8 mile
− 8,500 square feet race book – River Downs Club
− Six restaurants and concessions
15
Source: SEC filings.II. Market Overviews
Market Overview – St. Louis
The workforce in the St. Louis area is well                        Employment gains during the past five years                     Cost of living factors in the St. Louis area rank
diversified, providing increased stability. The                    totaled 87,700 positions and have been                          below the majority of major metro areas
mix of jobs in the region is wide ranging and                      sourced to nearly every sector of the economy.                  within the Midwest region. The overall score
reflective of the national economy. On a 100-                      Top job growth segments include: professional                   ranks below the majority of its nearest
point scale for diversity, St. Louis has scored in                 and business services; education and health                     metropolitan area counterparts and housing
the 98 to 99 range for more than a decade.                         services; leisure and hospitality; mining, logging              costs are a key component of the equation.
                                                                   and construction; and manufacturing.

                                                                                                                                                                           Overall
               Employment Distribution                                    Employment Growth (Last 5 Years)                             Selected Urban Areas                Cost of       Cost of
                                                                   Professional & Bus Svc's                           26,400           (100=National Average)               Living      Housing
                                                                         Ed. & Health Svc's                          23,400            St. Louis, MO-IL                          90.5         71.2
                           11%         5%
                                                8%                    Leisure & Hospitality                       14,900
                                                                                                                                       Columbus, OH                              89.2         76.1
                   4%                                              Mining, Logging & Cons.                     8,800
                                                      4%
                                                                            Manufacturing                     5,800                    Cincinnati, OH                            92.2         76.7
               11%
                                                         10%                   Retail Trade                   5,400                    Louisville, KY                            92.2         78.6
                                                                            Other Services                   3,800                     Indianapolis, IN                          92.5         79.3
                                                       4%               Financial Activities                 3,300
                                                      2%                                                                               Kansas City, MO-KS                        91.4         81.9
                                                                       Trans, Ware. & Util.                 2,000
                 19%                                 6%                   Wholesale Trade                   1,000                      Cleveland, OH                            100.2         84.9
                                      16%                                      Information (900)                                       Nashville-Murfreesboro, TN                96.3         89.6
                                                                                    Gov't (6,200)
                                                                                                                                       Chicago, IL                              123.5     156.1

The St. Louis job market is operating at
                                                                                                                    Unemployment Rate
                                                                  14%
essentially full employment. Preliminary                          12%
estimates from the Bureau of Labor Statistics                     10%
for the month of October 2017 suggest an                           8%
                                                                   6%
unemployment rate of 2.7 percent, which                            4%
would be the lowest level in decades.                              2%
                                                                   0%
                                                                        '00   '01   '02   '03   '04   '05     '06    '07   '08   '09      '10    '11    '12   '13   '14   '15     '16   '17
                                                                                                                                                                                        17
     Source:    United States Bureau of Labor Statistics; C2ER.
Market Overview – Kansas City
Population within the Kansas City area reached Employment gains during the past five years Expansion of the overall employment base and
an all-time high during the past year. The totaled 93,500 positions, with white-collar relatively tight supply of labor has resulted in
community’s resident base expanded by positions contributing more than any other rising wages. Average wages in 2017 have
approximately one percent, which outpaced the sector. The largest contributors of growth increased by an average of 7.4 percent in the 10
national average. Overall population reached 2.1 include: professional and business services; months of 2017 within the Kansas City metro
million as the rate of growth accelerated. education and health services; leisure and area, which was more than double the rate
hospitality; retail; and manufacturing. reported for the nation as a whole.
Kansas City Population Trend Employment Growth (Last 5 Years) Avg. Annual Weekly Wage Growth
1.2% Professional & Bus Svc's 12.0%
30,500
1.0%
1.0% Ed. & Health Svc's 17,000 10.0%
Leisure & Hospitality 12,800
National Average 8.0% 7.4% Average
0.8% Retail Trade 7,400
Manufacturing 6,800 6.0%
0.6% Mining, Logging & Cons. 6,300
Financial Activities 6,200 4.0%
0.4%
Trans, Ware. & Util. 5,500 2.0%
0.2% Wholesale Trade 5,000
Gov't 2,200 0.0%
0.0% Other Services 600
'11 '12 '13 '14 '15 '16 Information (6,800)
Housing construction has escalated as Housing Units Permitted (Single-Family and Multi-Family)
population and employment growth have 9,751 9,975
8,175 8,800
trended positively. The number of new homes 7,151
entering the construction phase during the past 5,026
12 months reached nearly 10,000, tripling the 3,160
pace of activity just a few years ago. Housing
demand has helped support the construction
sector of the economy. '11 '12 '13 '14 '15 '16 '17 LTM
18
Source: United States Bureau of Labor Statistics; United States Census Bureau.Market Overview – Cincinnati
Employment growth is accelerating in the Employment gains during the past five years The overall cost of living remains relatively
Cincinnati, Ohio area. On a trailing 12-month totaled 86,600 positions and have been well affordable in the Cincinnati area, and the
average basis, establishment-based employment diversified. Top job growth segments include: housing market provides opportunity for future
(those working in Cincinnati businesses) growth leisure and hospitality; education and health growth. The cost of living remains below the
is at the highest level in more than a decade at services; financial activities; manufacturing; and national average and the community ranks in
2.1 percent. professional and business services. the top 15 percent of all major metro areas in
terms of housing affordability.
Cincinnati Employment Growth Employment Growth (Last 5 Years) Housing Opportunity Index
2.5% Leisure & Hospitality 15,100 Rank: 32 out of 233 Metro Areas
2.1%
National Average Ed. & Health Svc's 12,400 100
2.0% Financial Activities 11,800
90
Manufacturing 10,700
1.5% Professional & Bus Svc's 9,600 80
Mining, Logging & Cons. 8,200 70
1.0% Retail Trade 7,000
60
Trans, Ware. & Util. 5,400
0.5% Wholesale Trade 4,600 50
Other Services 1,800 40
0.0% Government 0
30
'11 '12 '13 '14 '15 '16 '17 LTM Information 0
'05 '08 '11 '14 '17
Incremental demand in the housing market
Housing Units Permitted (Single-Family and Multi-Family)
5,965 6,163
confirms that the area continues to be
4,365 4,626 4,787
sought out by residents. The number of
3,291 3,313
new home permits has nearly doubled since
2011. During the past 12 months, the single-
family market reported a 17.2 percent
increase in permitting activity.
'11 '12 '13 '14 '15 '16 '17 LTM
19
Source: United States Bureau of Labor Statistics (establishment-based employment on a trailing 12-month basis in the metropolitan statistical area); Wells Fargo/NAHB; United States Census Bureau.Forward Looking Statements
Important information regarding forward-looking statements
This presentation contains forward-looking statements within the meaning of Section 27A of the Securities Act of 1933, as amended, and Section 21E of the
Securities Exchange Act of 1934, as amended. Such statements may contain words such as “may,” “will,” “might,” “expect,” “believe,” “anticipate,” “could,”
“would,” “estimate,” “continue,” “pursue,” or the negative thereof or comparable terminology, and may include (without limitation) statements regarding
the transaction to acquire the Pinnacle assets, Boyd Gaming’s expectations regarding the amount of the purchase price, timing of closing, the potential
benefits to be achieved from the acquisition, including the potential to gain strong positions in three metropolitan areas, the effects on Boyd Gaming’s size,
scale, customer base, and free cash flow, expectations regarding timing for the transaction to be free cash flow positive and accretive to Boyd Gaming’s
earnings, the expected cost synergies, estimated rent coverage, estimated growth rates, statements regarding the creation of an OpCo platform for future
growth and Boyd Gaming’s loyalty program, and any statements or assumptions underlying any of the foregoing. These forward-looking statements are based
upon the current beliefs and expectations of management and involve certain risks and uncertainties, including (without limitation) the possibility that the
transactions contemplated by the definitive agreement will not close on the expected terms (or at all), or that Boyd Gaming is unable to successfully integrate
the acquired assets or realize the expected synergies or that the properties will be cash flow positive or accretive to Boyd Gaming’s earnings as anticipated;
litigation, antitrust matters or the satisfaction or waiver of any of the closing conditions that could delay or prevent the closing of the transactions
contemplated by the definitive agreement; and changes to the financial conditions of the parties, or the credit markets, or the economic conditions in the
areas in which they operate. Additional factors are discussed in “Risk Factors” in Boyd Gaming’s annual, periodic and current reports filed from time to time
with the Securities and Exchange Commission. All forward-looking statements in this press release are made as of the date hereof, based on information
available to Boyd Gaming as of the date hereof, and Boyd Gaming assumes no obligation to update any forward-looking statement.
Non-GAAP Financial Measures
Regulation G, "Conditions for Use of Non-GAAP Financial Measures," prescribes the conditions for use of non-GAAP financial information in public disclosures.
We do not provide a reconciliation of forward-looking non-GAAP financial measures due to our inability to project special charges and certain expenses.
20Disclosures
Important disclosures regarding information contained within this document
We obtained the industry, market and competitive position data throughout this presentation from (i) our own internal estimates and research of third party
company websites and other sources, (ii) industry and general publications and research or (iii) studies and surveys conducted by third parties. Such sources
generally do not guarantee the accuracy or completeness of included information. While we believe that the information included in this presentation from
such publications, research, studies, surveys and websites is reliable, we have not independently verified data from these third-party sources. While we
believe our internal estimates and research are reliable, neither such estimates and research nor such definitions have been verified by any independent
source.
This presentation also contains trademarks, service marks, trade names and copyrights of other companies, which are the property of their respective
owners. Solely for convenience, trademarks and trade names referred to in this presentation may appear without the ® or TM symbols, but we do not intend
our use or display of other companies’ trade names, trademarks or service marks with or without such symbols to imply relationships with, or endorsement
or sponsorship of us by, these other companies.
21You can also read


