ASCENDAS INDIA TRUST 3Q FY2020 BUSINESS UPDATES 29 OCTOBER 2020 - CAPITALAND
←
→
Page content transcription
If your browser does not render page correctly, please read the page content below
Ascendas India Trust
3Q FY2020 Business Updates
29 October 2020
Disclaimer
This presentation may contain forward-looking statements. Actual future performance, outcomes and results may differ materially from those
expressed in forward-looking statements as a result of a number of risks, uncertainties and assumptions. Representative examples of these
factors include (without limitation) general industry and economic conditions, interest rate trends, cost of capital and capital availability,
availability of real estate properties, competition from other developments or companies, shifts in customer demands, shifts in expected
levels of occupancy rate, property rental income, charge out collections, changes in operating expenses (including employee wages,
benefits and training, property operating expenses), governmental and public policy changes and the continued availability of financing in
the amounts and the terms necessary to support future business.
You are cautioned not to place undue reliance on these forward-looking statements, which are based on the current view of management
regarding future events. No representation or warranty expressed or implied is made as to, and no reliance should be placed on, the
fairness, accuracy, completeness or correctness of the information or opinions contained in this presentation. Neither Ascendas Property
Fund Trustee Pte. Ltd. (“Trustee-Manager”) nor any of its affiliates, advisers or representatives shall have any liability whatsoever (in
negligence or otherwise) for any loss howsoever arising, whether directly or indirectly, from any use, reliance or distribution of this
presentation or its contents or otherwise arising in connection with this presentation.
The past performance of Ascendas India Trust (“a-iTrust”) is not indicative of future performance. The listing of the units in a-iTrust (“Units”) on
the Singapore Exchange Securities Trading Limited (the “SGX-ST”) does not guarantee a liquid market for the Units. The value of the Units and
the income derived from them may fall as well as rise. Units are not obligations of, deposits in, or guaranteed by, the Trustee-Manager. An
investment in the Units is subject to investment risks, including the possible loss of the principal amount invested. Investors have no right to
request that the Trustee-Manager redeem or purchase their Units while the Units are listed on the SGX-ST. It is intended that holders of Units
may only deal in their Units through trading on the SGX-ST.
This presentation for information only and does not constitute an invitation or offer to acquire, purchase or subscribe for the Units.

All measurements of floor area are defined herein as “Super Built-up Area” or “SBA”, which is the sum of the floor area enclosed within the
walls, the area occupied by the walls, and the common areas such as the lobbies, lift shafts, toilets and staircases of that property, and in
respect of which rent is payable.
The Indian Rupee and Singapore Dollar are defined herein as “INR/₹” and “SGD/S$” respectively.
Any discrepancy between individual amounts and total shown in this presentation is due to rounding.                                                    2
3Q FY2020
Business Updates

                   International Tech Park Bangalore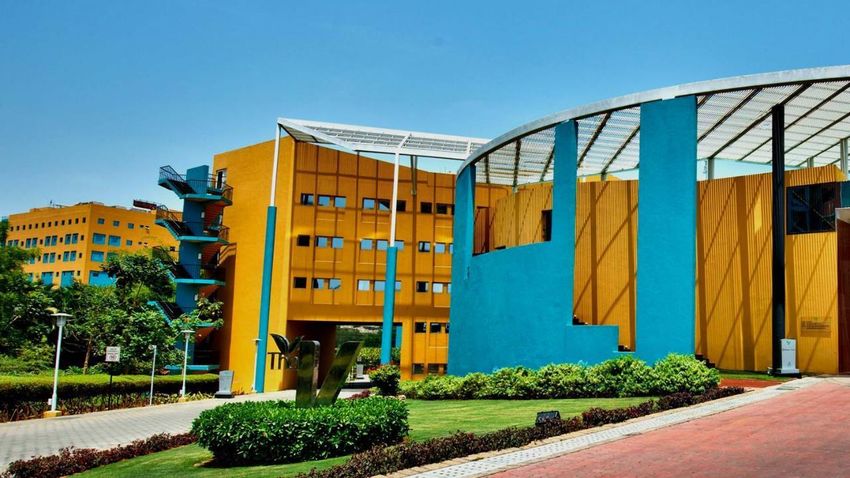
Operational & financial highlights
          REVENUE & NPI^
                                     3Q FY2020      3Q FY2019
                                                                                  Variance
                                   (Jul-Sep 2020) (Jul-Sep 2019)                                                                                              GEARING
                                                                                                                                                          30% as at Sep 20202
SGD/INR FX       rate1                     53.1                   51.4                3.3%
                                                                                                          • Increased slightly due to positive
                                        ₹2,559m                ₹2,552m                 0%                   rental reversions; partially offset by
Total property income
                                        S$47.0m                S$49.6m                (5%)                  lower utilities and car park income
                                                                                                            due to COVID-19 lockdown

                                        ₹2,006m                ₹2,007m                (0%)                • Remained stable
Net property income
                                        S$36.9m                S$39.0m                (5%)
                                                                                                                                                      OFFICE RENT COLLECTION^
                                                                                                                                                       99% of Jul, 98% of Aug and
                                     YTD FY2020     YTD FY2019                                                                                        92% of Sep billings collected3
                                                                                  Variance
                                   (Jan-Sep 2020) (Jan-Sep 2019)
                                                                                                          • Income from Anchor building at ITPB;
SGD/INR FX rate1                           53.1                   51.6                2.9%                • positive rental reversions; and
                                                                                                          • partially offset by lower utilities and
                                        ₹7,758m                ₹7,534m                 3%                   carpark income due to COVID-19
Total property income                                                                                       lockdown.
                                        S146.0m               S$146.1m                (0%)
                                                                                                          • Increase due to higher total property
                                        ₹5,868m                ₹5,782m                 1%                   income; conservative provision for               OCCUPANCY
Net property income                                                                                         doubtful debts though collections                      96%
                                       S$110.4m               S$112.0m                (1%)
                                                                                                            remain high.
^    Information has been provided as reference for this quarterly business update in view of COVID-19.
1.   Average exchange rate for the period.
2.   As at 30 September 2020, a-iTrust Group had cash and cash equivalents of S$90.7million
3.   Collection status as at 30 September 2020.
3Q key updates
                     Declining trend
                     •   Daily COVID-19 recoveries outpacing infections in almost all states. Active cases form 11% of the caseload,
                         recoveries over 87% and fatality rate further declined to 1.5%.

 COVID-19 in India
                     Phase-wise reopening to revive economy
                     •   Further relaxation of restrictions with ‘Unlock 5.0’ guidelines to reopen the economy. Metro services have resumed;
                         no restriction on inter-state and intra-state movement; schools and cinemas have reopened; international air travel
                         and train services remain suspended.

                     Operations
                     •   All parks remain open for essential services to support our tenants’ critical IT & ITES operations. Park Square Mall
                         (PSQ) opened between 8 June to 13 July, and from 22 July onwards.
                     •   Park population remains
Capital
management

             International Tech Park, Chennai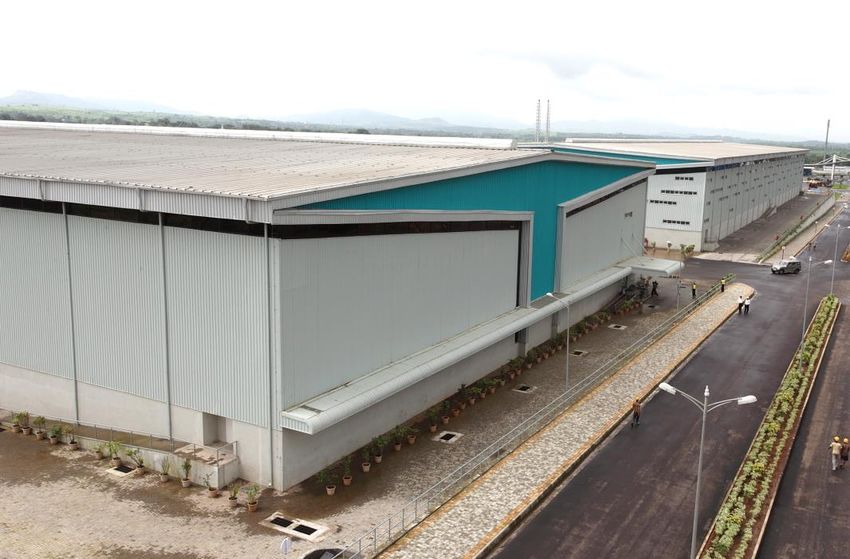
Capital management
Currency hedging strategy                            Funding strategy
    Balance sheet                                    •   The Trustee-Manager’s approach to equity
                                                         raising is predicated on maintaining a strong
•   Trustee-Manager does not hedge equity.
                                                         balance sheet by keeping the Trust’s gearing
•   At least 50% of debt must be denominated in          ratio at an appropriate level.
    INR.                                             •   Trustee-Manager does not borrow INR loans
                                                         onshore in India as it costs less to hedge SGD
                                                         borrowings to INR-denominated borrowings
    Income                                               using cross-currency swaps and derivatives.

•   Income is repatriated semi-annually from India
    to Singapore.                                    Income distribution policy
•   Trustee-Manager locks in the income to be        •   To distribute at least 90% of its income available
    repatriated by buying forward contracts on a         for distribution.
    monthly basis.
                                                     •   a-iTrust retains 10% of its income available for
                                                         distribution to provide greater flexibility in
                                                         growing the Trust.

                                                                                                              7
Debt maturity profile
                                                            Hedging ratio
  Effective borrowings: S$773 million                       INR: 65% SGD: 35%

S$ Million
                                                          237.6
                                                                                   213.8

                                                          190.6
                                                                                   169.2
                                                                                                           100.5                   100.2
                    1
             74.6
                                                                                                           50.5                     38.2
                                   46.3
             74.6                                                                                                                   62.0
                                   46.3                    47.0                    44.5                     50.0

         FY2020                  FY2021                  FY2022                   FY2023                  FY2024                  FY2025

        SGD Denominated debt                  INR Denominated debt

Information as at 30 September 2020.
1. S$30 million of remaining loans/bonds maturing in FY2020 have been refinanced with a committed 4-year term loan facility in October 2020. As at 29
   October 2020, a-iTrust has undrawn committed Term Loan facility totaling S$35 million and undrawn uncommitted credit facilities totaling S$217 million   8
   available to refinance remaining loans.
Capital structure
 Indicator                                                           As at 30 September 2020

 Interest service coverage                                                     4.0 times
 (EBITDA/Interest expenses)                                                  (YTD FY2020)

 Percentage of fixed rate debt                                                      89%

 Percentage of unsecured borrowings                                                100%
                                                                                                                                       Gearing: 30%2
 Effective weighted average cost of debt1                                          5.5%

 Gearing limit                                                                      50%

 Available debt headroom                                                    S$1,017 million

1. Based on borrowing ratio of 65% in INR and 35% in SGD as at 30 September 2020.
                                                                                                                                                                              9
2. As at 30 September 2020, the effective borrowings to net asset ratio and total borrowings less cash and cash equivalent to net asset ratio is 60.3% and 54.7% respectively.
Operational review

                     International Tech Park Hyderabad
Office markets update
Bangalore (Whitefield) Hyderabad (IT Corridor I1)
5.0 15.0% 4.0
12.0%
4.0
9.7% 3.0
3.0 8.9%
7.2% 2.0 5.3%
2.0 6.2% 5.7%
1.0 3.0% 2.6%
1.0
0.0 0.0
CY 2016 CY 2017 CY 2018 CY 2019 YTD CY 2020 CY 2016 CY 2017 CY 2018 CY 2019 YTD CY 2020
Chennai (OMR) Pune (Hinjawadi)
3.0 10.5% 2.0
9.0%
2.0 14.7%
5.8%
1.0 9.9% 8.6%
3.3% 3.3% 6.0% 6.3%
1.0
0.0 0.0
CY 2016 CY 2017 CY 2018 CY 2019 YTD CY 2020 CY 2016 CY 2017 CY 2018 CY 2019 YTD CY 2020
Supply (in million sq ft) Gross Absorption (in million sq ft) Vacancy (%)
Source: CBRE Research
1. Includes HITEC City and Madhapur. 11Diversified portfolio
Portfolio breakdown by area
Mumbai
6%
303 tenants
Pune
12%
Bangalore 40,937 sq ft average space per tenant
34%
129,700 park employees
Chennai
22%
Largest tenant accounts for
9% of portfolio base rent
Hyderabad
26% Top 10 tenants accounts for
Floor area 13.1 million sq ft 39% of portfolio base rent
All information as at 30 September 2020.
12Healthy portfolio occupancy
Committed portfolio occupancy1: 96%
100% 100% 100% 100%
98% 98%
95% 95% 95% 95%
92%
90%
85% 85% 85%
2
ITPB ITPC CyberVale aVance CyberPearl ITPH aVance Arshiya
Hyderabad Pune Panvel
a-iTrust occupancy Market occupancy of peripheral area3
All information as at 30 September 2020.
1. Portfolio occupancy includes only office space and excludes retail space as well as Mariner building in ITPH which is being vacated for redevelopment.
2. There are no comparable warehouses in the micro-market that the Arshiya Panvel warehouses are located in.
3. CBRE market report as at 30 September 2020. 13Transacted vs effective rents1
Bangalore Chennai Hyderabad
16%
14%
14%
14%
13%
12%
10% 9%
8% 8%
6%
6%
4%
2%
0%
ITPB ITPC CyberVale aVance CyberPearl ITPH
Hyderabad
All information as at 30 September 2020.
1. (Weighted average transacted rent over the last 12 months)/(Weighted average effective rent in the last month of reporting period)-1 14Spread-out lease expiry profile
Weighted average lease term: Weighted average lease expiry:
6.8 years 3.6 years
Sq ft expiring
48%
5,500,000
5,000,000
4,500,000
4,000,000
3,500,000
3,000,000 22%
2,500,000 17%
2,000,000
1,500,000 9%
1,000,000
500,000 3%
-
FY2020 FY2021 FY2022 FY2023 FY2024 & beyond
All information as at 30 September 2020.
Note: Retention rate for the period 1 October 2019 to 30 September 2020 was 49%. 15Diversified tenant base
Tenant core business & activity by base rental
Oil & Gas Retail 1 Others
Telco F&B1 Retail & F&B R&D
2% 1% 1%
Others 2% 1% 1 3% 1%
3% ITES
Healthcare & IT, Software & Application
4%
Pharmaceutical Development and Service Support
3% 52%
Automobile
Logistics & warehousing
5%
7%
Logistics
7%
1
IT
Tenant core Tenant core
48%
Electronics,
Semiconductor business activity
& Engineering
7%
Design, Gaming and
Media
7% IT/ITES 1
36%
Banking & Financial Services
10%
All information as at 30 September 2020.
1. IT - Information Technology; ITES - Information Technology Enabled Services; R&D - Research & Development; F&B - Food & Beverage. 16Diversified tenant base
Tenant country of origin & company structure by base rental
Others
Japan UK
4%
2% 2%
Switzerland India Co 2
2% 14%
France
9%
Country of USA
52% Company MNC
3
86%
origin structure
1
India
29%
All information as at 30 September 2020.
1. Comprises Indian companies with local and overseas operations.
2. Comprises Indian companies with local operations only. 17
3. Multinational corporations, including Indian companies with local and overseas operations.Growth strategy
International Tech Park ChennaiGood growth track record
Total developments: Total acquisitions:
5.0 million sq ft 4.8 million sq ft
11%
Floor area CAGR
(million square feet)
12.6
1 13.1 13.1
11.9 0.5
0.8
1.9
9.7
0.4
8.8 0.3
0.6
7.5 1.3
6.9 6.9
6.5 0.6
6.0 0.4 13.1
0.5 11.9 12.6
4.7 4.8 4.8 1.2
0.1 9.7
3.6 1.1 8.8
6.9 6.9 7.5
6.0 6.5
4.7 4.8 4.8
3.6 3.6
IPO Dec-07 Dec-08 Dec-09 Dec-10 Dec-11 Dec-12 Dec-13 Dec-14 Dec-15 Dec-16 Dec-17 Dec-18 Dec-19 Sep-20
Portfolio Development Acquisition
1. Includes reduction in floor area due to the demolition of Auriga building (0.2m sq ft) in ITPH as part of the redevelopment. 19Clear growth strategy
• 3.8m sq ft1 in Bangalore
Development
pipeline • 3.5m sq ft in Hyderabad
• 0.4m sq ft in Chennai
• 2.3m sq ft from CapitaLand
Sponsor
• Ascendas India Growth Programme
assets
Growth
strategy
• 1.8m sq ft aVance Hyderabad
3rd party • 2.1m sq ft aVance Business Hub 2
acquisitions
• 1.4m sq ft AURUM IT SEZ
• 1.8m sq ft BlueRidge 3
• 2.8m sq ft2 Arshiya Panvel warehouses
Logistics • 3.9m sq ft3 Arshiya Khurja warehouses
• Ascendas-Firstspace platform
1. Includes buildings under construction and additional development potential of 1.0m sq ft due to the widening of the road in front of International Tech Park
Bangalore and 1.1m sq ft due to revised government regulation.
2. Includes a 7th warehouse under construction (0.3m sq ft). 20
3. Share Purchase Agreement for acquisition of 1 warehouse (0.2m sq ft) executed. Completion of Conditions Precedent delayed due to COVID-19.Outlook
International Tech Park BangaloreGrowth based on committed pipeline
Floor area
(million square feet)
22.8
0.2
74% 0.3
1.8
2.1
1.8
1.4
13.1 1.4
0.7
13.1
Sep-20 Growth pipeline
Portfolio MTB 5 ITPH redevelopment - Phase I
AURUM IT SEZ aVance 5 & 6 aVance A1 & A2
22
BlueRidge 3 - Phase 1 & 2 Arshiya Panvel Arshiya KhurjaGrowth Pipeline
aVance Hyderabad aVance Business Hub 2 AURUM IT SEZ BlueRidge 3 Arshiya Panvel Arshiya Khurja
TOTAL
aVance 5 aVance 6 aVance A1 aVance A2 Building 1 Building 2 Phase 1 Phase 2 7th warehouse 1 warehouse
Floor area 1.16 0.64 1.05 1.05 0.60 0.80 1.41 0.43 0.33 0.19 7.66
(mil sq ft)
Time of 1H Dec 2H 2H OC5 1H 2H 2H 1H Upon N.A.
Completion1 2021 20173 2023 2023 received 2021 2021 2023 2021 completion of
CP5
Expected total ₹13.5b ₹14.0b ₹9.3b ₹9.8b ₹2.1b6 ₹1.0b6 ₹49.7b
consideration2 (S$270m) (S$278m) (S$186m) (S$194m) (S$42m) (S$19m) (S$987m)
Amount disbursed2 ₹8.4b ₹0.5b4 ₹4.1b ₹2.3b ₹0.4b - ₹15.8b
(S$168m) (S$10m) (S$82m) (S$46m) (S$9m) (S$315m)
Remaining ₹5.1b ₹13.5b ₹5.2b ₹7.5b ₹1.7b ₹1.0b ₹33.9b
commitment2 (S$102m) (S$268m) (S$103m) (S$148m) (S$33m) (S$19m) (S$672m)
1. Refers to building completion. For Arshiya Khurja, completion refers to the acquisition of 1 Grade-A warehouse.
2. Based on exchange rate at the time of investment/announcement.
3. Based on existing investment structure, aVance 6 will be acquired together with aVance 5.
4. Excludes disbursement of ₹2.0 billion (S$39 million2) towards refinancing of loan taken by PVPL towards acquisition of additional land in aVance Business Hub 2.
5. OC refers to occupancy certificate; CP refers to Conditions Precedent. 23
6. Net consideration after deduction of security deposit.Appendix
Glossary
Trust properties : Total assets.
Derivative financial : Includes cross currency swaps (entered to hedge SGD borrowings into INR), interest rate swaps, options and
instruments forward foreign exchange contracts.
DPU : Distribution per unit.
EBITDA : Earnings before interest expense, tax, depreciation & amortisation (excluding gains/losses from foreign
exchange translation and mark-to-market revaluation from settlement of loans).
Effective borrowings : Calculated by adding/(deducting) derivative financial instruments liabilities/(assets) to/from gross borrowings,
including deferred consideration.
Gearing : Ratio of effective borrowings to the value of Trust properties.
ITES : Information Technology Enabled Services.
INR or ₹ : Indian rupees.
SEZ : Special Economic Zone.
SGD or S$ : Singapore dollars.
Super Built-up Area or SBA : Sum of the floor area enclosed within the walls, the area occupied by the walls, and the common areas such
as the lobbies, lift shafts, toilets and staircases of that property, and in respect of which rent is payable.
24Half-yearly DPU since listing
INR/SGD exchange rate2
INR/SGD
DPU1 (S¢) (Indexed)
Change since listing exchange rate (indexed)
10.00 INR depreciation against SGD: -51% 130
SGD DPU3: +65%
9.00 120
8.00 110
7.00
100
6.00
90
5.00
80
4.00
70
3.00
60
2.00
1.00 50
0.00 40
CY2007 CY2008 CY2009 CY2010 CY2011 CY2012 CY2013 CY2014 CY2015 CY2016 CY2017 CY2018 CY2019 CY2020
1H 2H INR/SGD exchange rate
1. DPU (income available for distribution) refers to 100% of distributable income. 10% of distributable income was retained starting from 2Q CY2012.
2. Average daily spot INR/SGD exchange rate for the period, pegged to 1 August 2007 using data sourced from Bloomberg. 25
3. Last 12 months DPU compared against first 12 months DPU.Growth strategy
Development: ITPB pipeline
Future development potential International Tech Park Bangalore
• Increase in development potential from 2.7
million sq ft to 3.8 million sq ft1.
• Construction of MTB 5 (0.7 million sq ft) is in
progress.
Anchor
Park Square (Multi-tenanted
(Mall) building)
Taj Vivanta
(Hotel)
Victor
(Multi-tenanted
Special Economic Zone2 building)
Aviator
(Multi-tenanted building)
MTB 5
Voyager
(Multi-tenanted building) (Under construction)
1. Includes buildings under construction and additional development potential due to the widening of the road in front of International Tech Park Bangalore
and revised government regulation. 26
2. Red line marks border of SEZ area.Growth strategy
Development: MTB 5, Bangalore
Artist’s impression
Property International Tech Park Bangalore
Floor area 0.68m sq ft
• Construction of structure has been completed and façade work in progress
Construction status
• Construction completion and tenant handover expected by 2H 2020
Leasing status 100% pre-leased to a leading IT Services company 27Growth strategy
Development: ITPH redevelopment
Existing Master Plan (1.5m sq ft1) Proposed Master Plan (5.0m sq ft)
MLCP
BLOCK E
Capella
Vega BLOCK D
Atria Atria
Phase I Phase I
BLOCK C
BLOCK B
Orion BLOCK A
Auditorium Auriga Mariner
Key Highlights
Redevelopment to increase the development potential, rejuvenate the existing park, and leverage strong demand
in Hyderabad:
• Net increase of 3.5m sq ft of leasable area
• Development planned in multiple phases over the next 7 to 10 years
• Construction for Phase I has commenced and excavation is in progress
1. Excludes the leasable area of Auriga building (0.2m sq ft) which has been demolished.
28Growth strategy
Development: ITPH redevelopment – Phase I
Artist’s impression
Name International Tech Park Hyderabad (ITPH) redevelopment – Phase I
Floor area 1.36m sq ft
• Excavation is in progress and foundation work has commenced
Development status • Mariner building is being vacated for redevelopment
• Completion expected by 2H 2022
29Growth strategy
Sponsor: Assets in India
Sponsor presence1 International Tech Park, Pune
• Three phases comprising 1.9 million sq ft
completed
• Construction of final phase of 0.4 million sq
ft is completed. Active discussions with
Gurgaon prospective tenants are ongoing.
Pune
Chennai
Private funds managed by sponsor
• Ascendas India Growth Programme
• Ascendas India Logistics Programme
1. Excludes a-iTrust properties.
30Growth strategy
3rd party: Acquisition criteria for commercial space
• Target cities:
• Bangalore
• Chennai
• Hyderabad
• Pune
• Mumbai
• Delhi
• Gurgaon
• Investment criteria:
• Location
• Tenancy profile
• Design
• Clean land title and land tenure
• Rental and capital growth prospects
• Opportunity to add value
31Growth strategy
3rd party: aVance Hyderabad
(5)
(3)
(6)
(8) (4) (7)
(2)
(5) (1)
(9)
Artist’s impression
(10)
(6)
Park Statistics
Site area: 25.7 acres / 10.4 ha (1), (2), (3) & (4) owned by a-iTrust: 1.50m sq ft
Vendor assets: marked in black Proposed acquisitions of (5) & (6)1: 1.80m sq ft
Land owner assets: marked in white ROFR to (7), (8), (9) & (10): 1.16m sq ft
1. Share Purchase Agreement executed for proposed acquisition of aVance 5 & 6. 32Growth strategy
3rd party: aVance Business Hub 2, Hyderabad
aVance
(6)
Hyderabad (7) (A1)
Artist’s impression
(A2) (A3) (A4) (A5)
Indicative plan Artist’s impression
Park Statistics
Proposed acquisition of
Site area: 14.4 acres / 5.8 ha
(A1) to (A5)1: 4.53m sq ft
Construction status: Excavation work commenced
Vendor assets: marked in black
for the project
Land owner assets: marked in white
1. Master Agreement executed for proposed acquisition of Vendor assets. The total leasable area has been reduced from 5.20m sq ft to 4.53m sq ft due to changes in 33
the Master Plan.Growth strategy
3rd party: AURUM IT SEZ, Navi Mumbai
(3) (2)
(1)
Artist’s impression
Location Ghansoli, Navi Mumbai
• Building 1: 0.6m sq ft; Building 2: 0.8m sq ft
Floor area
• Right of First Refusal on Building 3: up to 1.1m sq ft
Expected completion • Building 1 - Occupancy Certificate received; Building 2 - 1H 2021
Leasing status • Building 1: 46% pre-committed
Acquisition of
Upon completion of each building, and within a period of up to 2 years post completion
Building 1 & 2
34Growth strategy
3rd party: BlueRidge 3, Pune
Location Hinjawadi Phase 1, Pune
Floor area Phase 1: 1.4m sq ft; Phase 2: 0.4m sq ft
Expected completion Phase 1: 2H 2021; Phase 2: 2H 2023
Leasing Status Phase 1: 11% pre-committed for long-term space
Construction of IT Building 1 is in progress. Ground floor and Podium levels
Construction status
are completed. Construction of office floors are in progress.
35Growth strategy
Logistics: Arshiya Panvel warehouses, Mumbai
Location Panvel, near Mumbai
Site area 24.5 acres / 9.9 ha
Floor area 0.8m sq ft
Forward purchase At least 2.8m sq ft (includes 0.3m sq ft warehouse under construction)
36Growth strategy
Logistics: Arshiya Khurja warehouse, NCR
Location Khurja, NCR
Site area 4.5 acres / 1.8 ha
Floor area 0.19m sq ft1
Proposed acquisition 3.85m sq ft
1. Acquisition of the warehouse subject to completion of certain Conditions Precedent as specified in the Share Purchase Agreement. 37World-class IT and logistics parks
City Bangalore Chennai Hyderabad Pune Mumbai
• Intl Tech Park • Intl Tech Park • Intl Tech Park • aVance Pune • Arshiya Panvel
Property Bangalore Chennai Hyderabad warehouses
• CyberVale • CyberPearl
• aVance Hyderabad
Type IT Park IT Park IT Park IT Park Warehouse
68.3 acres 33.2 acres 51.2 acres1 5.4 acres 24.5 acres
Site area
27.6 ha 13.5 ha 20.5 ha1 2.2 ha 9.9 ha
Completed floor
4.5m sq ft2 2.8m sq ft 3.4m sq ft2 1.5m sq ft 0.8m sq ft
area
Number of
11 6 11 3 6
buildings
Park population 48,900 35,400 31,600 13,800 -
Land bank
(development 3.8m sq ft3 0.4m sq ft 3.5m sq ft4 - -
potential)
1. Includes land not held by a-iTrust.
2. Only includes floor area owned by a-iTrust.
3. Includes buildings under construction and additional development potential due to the widening of the road in front of International Tech Park Bangalore and revised government
regulation. 38
4. Includes buildings under construction.Quality tenants
Top 10 tenants (in alphabetical order) Top 5 sub-tenants of Arshiya Panvel
(in alphabetical order)
1 Applied Materials 1 Borochemie (India) Pvt Ltd
2 Arshiya Panvel
2 DHL Logistics
3 Bank of America
3 Huawei Telecommunications
4 Cognizant
4 Rolex Logistics (CISCO)
5 Mu Sigma
5 Shashwat Group
6 Renault Nissan
7 Societe Generale
8 Tata Consultancy Services
9 Technicolor
10 United Health Group
All information as at 30 September 2020.
39Lease expiry profile
FY2024
City FY2020 FY2021 FY2022 FY2023 Total
& beyond
Bangalore 58,000 1,280,000 654,000 141,000 2,241,000 4,374,000
Hyderabad 186,000 869,000 678,000 347,000 444,000 2,524,000
Chennai 92,000 604,000 759,000 580,000 1,174,000 3,209,000
Pune 68,000 - 64,000 58,000 1,313,000 1,503,000
Mumbai - - - - 832,000 832,000
Total 404,000 2,753,000 2,155,000 1,126,000 6,004,000 12,442,000
40Revenue growth trends
Total Property Income (INR) Total Property Income (SGD)
10% 5%
INR million
CAGR S$ million CAGR
10,188
9,336 197.6
184.0
183.0
8,626
7,220 148.4
141.1
6,579 129.9
6,124 124.4 127.3
120.8 121.3 119.8
5,550 5,584
4,658
4,005 4,078
41Income growth trends
Net Property Income (INR) Net Property Income (SGD)
12% 7%
INR million
CAGR S$ million CAGR
148.6
7,668
133.8
6,791
123.6
5,827
98.4
4,790
91.1
4,249
74.3 74.9 75.9
3,654 71.1 70.1 69.8
3,197 3,260
2,628
2,460 2,391
42a-iTrust unit price versus major indices
(Indexed) Indicator
175 Trading yield
a-iTrust 6.8%1
(as at 30 September 2020)
FTSE STI Index
150 Average daily trading
FTSE ST REIT Index
2,251,500 units
volume (YTD FY2020)
Bombay SE Realty Index
125
INR/SGD FX rate a-iTrust
100
FTSE ST REIT Index
75
FTSE STI Index
50 INRSGD FX Rate
Bombay
25
SE Realty
Index
0
IPO
Sep 20
Jun 08
Jun 09
Jun 10
Jun 11
Jun 12
Jun 13
Jun 14
Jun 15
Jun 16
Jun 17
Jun 18
Jun 19
Jun 20
Dec 07
Dec 08
Dec 09
Dec 10
Dec 11
Dec 12
Dec 13
Dec 14
Dec 15
Dec 16
Dec 17
Dec 18
Dec 19
Source: Bloomberg
1. Trading yield based on annualised 1H FY2020 DPU of 9.28 cents at closing price of S$1.37 per unit as at 30 September 2020. 43Structure of Ascendas India Trust
Unitholders
Holding of units Distributions
Trustee’s fee & management fees
Ascendas Property Fund Trustee Pte. Ltd.
a-iTrust (the Trustee-Manager), a wholly owned subsidiary of
Acts on behalf of unitholders/ CapitaLand
Dividends, principal management services
100% ownership &
shareholder’s loan repayment
of shareholder’s loan
Singapore SPVs
1. Ascendas Property Fund (India) Pte. Ltd.
2. Ascendas Property Fund (FDI) Pte. Ltd.
Ownership of ordinary shares; Subscription to Fully &
Compulsory Convertible Debentures (“FCCD”) and Dividends on ordinary shares, proceeds from share buyback
Non-Convertible Debentures (“NCD”) & interest on FCCD and NCD Singapore
The VCUs India
• Ascendas Panvel FTWZ • Information Technology Park Limited (92.8% ownership)2
Limited1
(100.0% ownership) • Ascendas Information Technology Park Chennai Ltd. (89.0% ownership)2
• Cyber Pearl Information Technology Park Private Limited (100.0% ownership)
• VITP Private Limited (100.0% ownership)
• Hyderabad Infratech Private Limited (100.0% ownership)
• Avance-Atlas Infratech Private Limited (100.0% ownership)
• Deccan Real Ventures Private Limited (100.0% ownership)
Ownership Master rental income Ownership Net property income
The Properties Provides property
• Arshiya Panvel warehouses • ITPB • ITPH management services Ascendas Services
• ITPC • aVance Hyderabad (India) Private Limited
• CV • aVance Pune (the property manager)
• CP Property management fees
1. Entered into a master lease agreement with Arshiya Limited (“AL”) to lease back the warehouses to AL for a period of six years. AL will operate and manage the warehouses and pay pre-
agreed rentals.
2. Karnataka State Government owns 7.2% of ITPB & Tamil Nadu State Government owns 11.0% of ITPC. 44Investor contact Tan Choon Siang Chief Financial Officer Ascendas Property Fund Trustee Pte Ltd (Trustee-Manager of a-iTrust) Office: +65 6774 1033 Email: choonsiang.tan@a-iTrust.com Website: www.a-iTrust.com
You can also read