Spatial Patterns of Precipitation, Altitude and Monsoon Directions in Hulu Kelang Area, Malaysia
←
→
Page content transcription
If your browser does not render page correctly, please read the page content below
Spatial Patterns of Precipitation, Altitude
                        and Monsoon Directions in Hulu Kelang
                                     Area, Malaysia

                                                      Nader Saadatkhah
                          Department of Geotechnics and Transportation, Faculty of Civil Engineering,
                               Universiti Teknologi Malaysia, Skudai, Malaysia 81300. E-mail:
                                                    snader4@live.utm.my

                                                        Azman Kassim
                          Department of Geotechnics and Transportation, Faculty of Civil Engineering,
                                   Universiti Teknologi Malaysia, Skudai, Malaysia 81300.

                                                          Lee Min Lee
                          Faculty of Engineering and Science, Universiti Tunku Abdul Rahman, Kuala
                                                  Lumpur, Malaysia 53300.

                                            ABSTRACT
       Malaysia is characterized by a humid tropical climate with heavy rainfall. The annual temperature
       varies from 26 to 28◦C while Malaysia is being one of the wet climate countries with as annual
       rainfall is approximately 2250 mm/year. Malaysia monsoon is arranged into two rainfall terms: the
       primary one coincident with the northeast monthly precipitation (December- March) and the other
       one with the southwest monthly rainfall in conjunction with inter-monsoon periods (April-
       November). The rainfall events are gauged at points of precipitation measurement networks in
       Malaysia. But, there is not full mapping of precipitation in relation with elevation all locations
       especially in mountains. This paper provides the relationship between monthly precipitation and
       elevation in the Hulu Kelang area based on Geographically Weighted Regression (GWR) method.
       Three periods of precipitation” the average monthly rainfall and two monsoons” has been studied
       in this area. The results of regression analyses performed between three conditions of monthly
       precipitation in the year and altitude. The mean absolute error (MAE) and the root-mean-square
       error (RMSE) verification results indicated that the whole year rainfall regression model works
       quite better than other results for interpreting the spatial variability of precipitation. The relation
       between original normal precipitation (1990-2010) and topography variables showed that study
       area precipitation is strongly controlled by elevation in the west region. The final map was
       represented that precipitation in the west region is generally higher than in east region of Hulu
       Kelang all around the year.
       KEYWORDS: Monsoon periods, Geographically Weighted Regression (GWR), mean
       absolute error (MAE), root-mean-square error (RMSE)

                                       INTRODUCTION
   Malaysia is characterised by a humid tropical climate with heavy rainfall (2540 mm p.a. and
above), average daily temperatures of 21-32oC and humidity averaging about 85%. Heavy rains

                                                   - 521 -
Vol. 19 [2014], Bund. C                                                                     522

during the monsoon are usually caused by strong convection of air mass in Malaysia. There are two
Malaysian monsoon seasons: the primary one is coincident with the northeast monsoon with higher
monthly precipitation in (December-March) and the other with the southwest monsoon where
monthly rainfall is in conjunction with inter-monsoon periods (April- November). The two monsoon
structure angles vary by about 23°. Rainfall is affected by the North-East and South-West monsoons
which bring heavy rainfall. It is important that the spatial properties of precipitation in relation with
elevation be investigated. The rainfall events are gauged at networked precipitation measurement
points in Malaysia. However, full mapping of precipitation in relation to elevation all locations is
incomplete, especially in the mountains. The first step to begin any geotechnical project is data
collection. The lack of data is problematic in the beginning and interferes with ongoing work.
Therefore, it is necessary to use interpolation techniques to extract these records as a continuous
surface. In this study, there is no full rainfall event data covering the whole area. And lack of rainfall
measurement stations is a reason to use interpolation technique. There are many evaluations such as;
precipitation, groundwater pressure, air quality, soil physical properties (Heuvelink, 2006). Such
estimates are dependent on related factors such as geology properties, geomorphology map, terrain
characterization, and historical data which are used in geographical information system (GIS) in
geotechnical projects. The local regression technique is a statistical method that creates relationship
between rainfall events and secondary data, such as station elevation and altitude (Salter, 1918; Barry,
1992). Geographically Weighted Regression (GWR) method as the local regression technique was
used in this study. GWR overcomes non-stationary regression problems and computes the correlation
between spatial variables separately for every point of area. GWR method is part of the statistical
model to assess the relationship between precipitation events and variables derived from altitude.
However, rain density gauges represent an important pattern in determining an accurate map of the
monsoon structures (Berndtsson, 1988; Uvo & Berndtsson, 1995).
    GWR method as the relation coefficients between the altitude and the average monthly
precipitation were found to be quite significant for rate of rainfall events. The aim of relationship
between rainfall and altitude in Hulu Kelang area was to derive a gridded dataset of monthly
precipitation from 1990 to 2010. The rainfall mapping index is calculated based on the weight values
obtained from the regression method as Weighted Linear Combination (WLC). The relation between
monthly average rainfall (1990-2010) and effective variables showed that study area precipitation is
strongly controlled by elevation in the west region and by monsoon direction.

                     GENERAL SITUATION OF THE REGION
     Hulu Kelang region in Malaysia is very susceptible to landslides (Mukhlisin et al., 2010). This
area is located in Kuala Lumpur, the capital city of Malaysia between 3º 09′ 25" and 3º 13′ 45" East
latitude and 101º 44′ 13" and 101º 47′ 51" North longitudes (Fig. 1). Urban development has brought
many problems to this region including numerous landslide and mudflow events. The Hulu Kelang
area has suffered several fatal landslides caused by rainfall events. There were 28 major landslide
events identified as rainfall-induced landslides since 1984. The Highland Towers slide stands as one
of the most significant tragedies involving 48 deaths due to tower collapse after several days’ rainfall
in 1993.
    Based on Malaysian Meteorological Department (MMD), the temperature of the Hulu Kelang
area is usually between 29 and 32º C with a mean relative humidity of 65–70%. The average annual
temperature is about 25°C. April and June are the highest temperature months, while the relative
humidity is lowest in June, July and September.

                                                - 522 -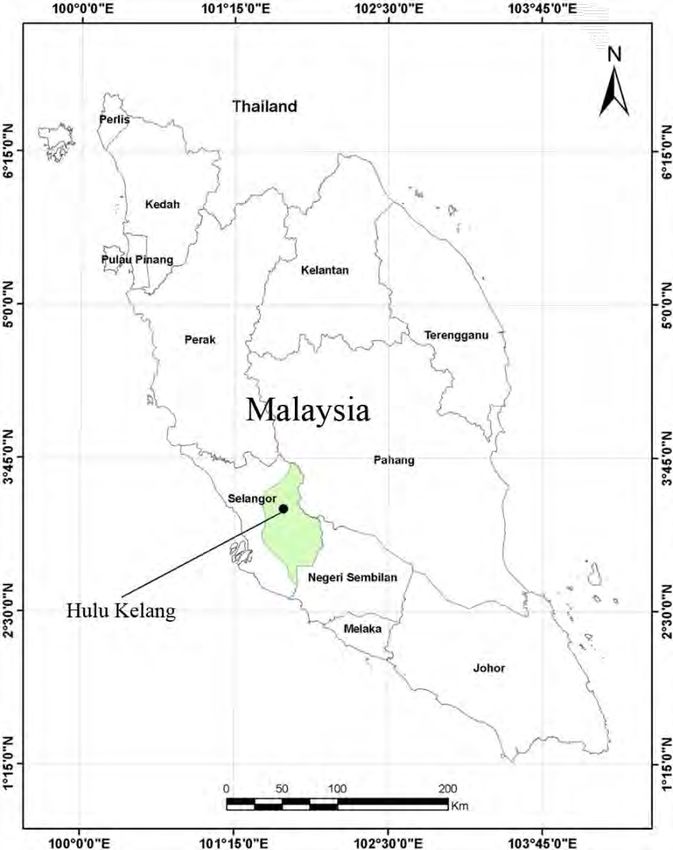
Vol. 19 [2014], Bund. C                                                                  523

                  Figure 1: Location of Hulu Kelang area, Serdong, Malaysia

                           LAYERS OF THEMATIC DATA
    Rainfall-induced landslide is a common geohazard in tropical regions like Malaysia. An
understanding of the rate of rainfall in relation with altitude mechanics is thus essential in the
investigation of the mechanism of rainfall-induced landslides in the tropical regions. Therefore, this
study tried to consider the relationship between rainfall data, digital elevation map (DEM), and slope
aspect using geographically weighted regression (GWR) method.

                                          Precipitation
    Hulu Kelang climate is generally hot and humid as it is situated in the tropical monsoon region.
Precipitation varies between 58 and 420 mm per month in the study area (MMD). There are two

                                              - 523 -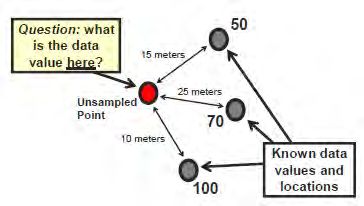
Vol. 19 [2014], Bund. C 524
pronounced wet seasons from February to May and from September to December each year. The
peak of precipitation is between March and May and also from November to December in the study
area. The single-day precipitation high that had been recorded ranged from 87 to 100 mm.
Hulu Kelang normally has more than 200 rainy days per year. Generally, there are 10 to 20 rainy
days per month in the wet season, and 10 to 15 days per month in the dry season. The data used in
this area is based on daily station data for the period 1990 to 2010 provided by MMD (Malaysian
Meteorological department). Monthly precipitation was derived from the daily gauge.
Digital Elevation Map (DEM)
Digital terrain maps are defined as orderly-spaced grids of height amounts that are essential and
major for zonal landslide hazard analysis. A DEM is a vector-based triangular irregular network
(TIN) structure that represents topography, and has been represented as a raster (a grid of squares,
also known as an elevation map when representing height) structure.
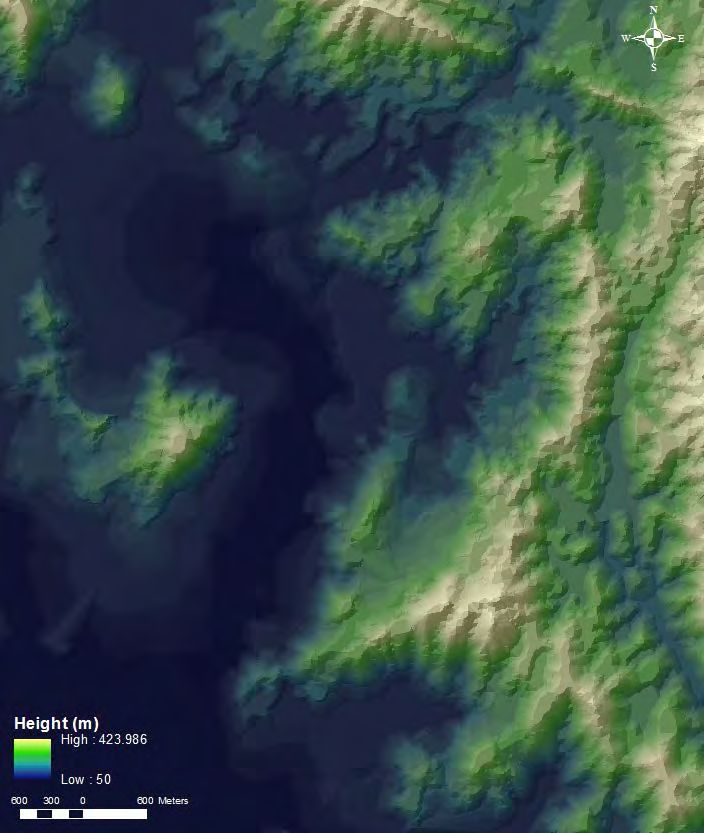
Figure 2: Digital elevation map (DEM) of Hulu Kelang area
Digital elevation maps are produced from different original topographic data sources including
ground-based surveys, photogram metrically generated contour maps, and remotely-sensed data. In
this study, the digital elevation map was obtained using photogrammetric analysis. A series of aerial
- 524 -Vol. 19 [2014], Bund. C 525
photographs from 1966 to 2003 were provided by the Department of Surveying and Mapping
Malaysia (JUPEM). In particular, the aerial photographs from the 2003 flight were sufficient to cover
the study areas. The cloud of photographic points extracted from aerial photographs data was
therefore considered by GIS tools. In addition to the points identified using the photogrammetric
technique, the contour lines of the aerial topographical map at a 1: 10000 scale is extracted in
standard topographic Ampang and Kampung Kelang Gates Baharu maps published by the director of
national mapping, Malaysia 2005. Figure 3.5 represents the range of surface elevation between 50 to
450 m as DEM. The highest elevation is 450 m located on the east side, while the lowest elevation is
found on the west side with 50 m.
Slope Aspect
Aspect affects hydrologic processes of slopes via evapotranspiration. The hydrologic process, in
turn, governs the weathering process, vegetation and root development in soil slopes, particularly in
dry environments (Sidle and Ochiai, 2006). The related parameters of aspect include exposure to
sunlight, wind direction, precipitation etc. (Cevik and Topal, 2003; Lee, 2005; Galli et al., 2008).
Numerous researchers have considered the aspect parameter in landslide susceptibility assessments
(Dai et al., 2001; Cevik and Topal, 2003; Suzen and Doyuran, 2004; Komac, 2006, Mohammadi,
2008). Nine different regions were investigated in the present study: flat area (−1°), north (337.5°–
22.5°), northeast (22.5°–67.5°), east (67.5°–112.5°), southeast (112.5°–157.5°), south (157.5°–
202.5°), southwest (202.5°–247.5°), west (247.5°–292.5°), and northwest (292.5°–337.5°) (Fig. 3).
- 525 -Vol. 19 [2014], Bund. C 526
Figure 3: Slope aspect
METHODOLOGY
Rainfall usually increases with altitude. This phenomenon is generally called orographic effect.
This effect has been studied in many different studies in many parts of the world (e.g. Alison et al,
2006; Sasi Kumar et al, 2007; Craig, 2009; Haiden and Pistotnik, 2009; Jessica et al, 2010). Increase
of precipitation with altitude arises from a number of mechanisms which serve to enhance both the
chance of precipitation over hills and the rate of rainfall when it is occurring (Sawyer, 1956; Pedgley,
1970; Barbro and Deliang, 2003). These approaches are well-known, and it is not the purpose of this
study to elaborate on them. The rate of rainfall is measured at the points of precipitation measurement
networks in Malaysia. However, measurement gauges are not found in all locations especially in the
mountains. Therefore need to use a reliable method is required. The relationship between
precipitation and altitude as dependent variable can be modelled using conventional ordinary least
squares (OLS) and geographically weighted regression (GWR). OLS analysis has been well
documented in a number of textbooks for statistics (Propastin and Kappas, 2008). In statistics, the
ordinary least squares (OLS) method is used for estimating the unknown parameters in a linear
- 526 -Vol. 19 [2014], Bund. C 527
regression model. This method minimizes the sum of squared vertical distances between the
observation data and the prediction results by linear approximation. GWR method as the local
regression model dominates in non-stationary regression problems and computes the relevance
between spatial variables separately for every point of area. Local parameter estimates can be mapped
to view possible lack of a station located at the regression points (Fig. 4).
Figure 4: Inverse Squared Interpolation
These results are the most appropriate and accurate in model prediction. While here there is only
a simple description of GWR, a more detailed description can be found by Fotheringham et al.
(2002). In low-elevations, most studies have found that a simple linear model seems to fit the
observed data well, at least for extended time periods and over relatively small regions. GWR focused
on deriving local parameters to be estimated. The model can be written as Eq. (1):
PMon = C0 + C1 (H) +C2 (A) + ɛ (mm) (1)
where P is the rate of monthly precipitation (mm), Co is the precipitation at sea level (mm) or flat
area, C1 is the dimensionless rate of increase in rainfall with altitude, or height coefficient (mm/m), H
is the station altitude (m), C2 is the change of rainfall with aspect, A is aspect of that station, and ɛ is
error term.
In geographically weighted regression (GWR, Brunsdon et al., 1996) “the relationship between
rate of rainfall and altitude” is the constant of the coefficients C0, C1, and C2 over space. If we use (x,
y) as a coordinate pair, the simple linear model of Eq. (1) can be expanded to Eq. (2).
P= Co(x, y) + C1 (x, y) (H) + C2 (x, y) (A) +e (2)
RESULTS AND DISCUSION
The aim of relationship between rainfall and altitude in Hulu Kelang area was to derive a gridded
dataset of the average monthly precipitation from 1990 to 2010. To perform this task, two objectives
have been dealt with in detail. One considers the influence of topography on the spatial distribution of
normal monthly precipitation and the other is concerned with finding the most suitable interpolation
method to interpolate monthly precipitation.
To consider the first objective it should be mentioned that the relation between original normal
precipitation (1990-2010) and topography variables showed that Malaysian precipitation is strongly
controlled by elevation in the Hulu Kelang region, which means that the relation between
- 527 -Vol. 19 [2014], Bund. C 528
precipitation and elevation is quite stable for all months. Both elevation and precipitation increase
with altitude.
Second objective is about selective model in this study. From the trend models for the normal
precipitation (1990-2010) Geographically Weighted Regression (GWR) method as the local
regression technique was employed in Hulu Kelang area. Surveys were conducted in the region, and
this model has shown the highest compatibility with this region. A linear precipitation-elevation
relationship is calculated based on data over a twenty year period from January-1990 through
December-2010 in the study area.
Spatial pattern of precipitation
There are two monsoon periods with two different rainfall intensities and duration in the study
area. The direction of rainfall events with the NE monsoon decreased in intensity from the land area,
while rainfall coming with the SW monsoon increased in intensity on entering higher regions on the
land (Desa and Niemczynowicz, 1996). As a result, three periods of precipitation consisting of
average monthly rainfall and two monsoons have been considered valid areas of study in this paper.
First, the results of Geographically Weighted Regression (GWR) method performed between total
average of monthly rainfall in the year and altitude was calculated in Eq. (3). The average monthly
rainfall equals 164.52 mm (Fig. 5).
PMon = 65.536+ 0.4757 H + … (mm) (3)
Gradient of Total Rainfall-Altitude
500
400
Height (m)
300
200
100
0
0 100 200 300 400 500
Monthly Rainfall (mm)
Figure 5: Gradient of rainfall-altitude during 20 years (1990-2010)
The equation is completely related to regression of rainfall data of the nearest station to Hulu
Kelang area at the same elevation (50- 420m). Figure 5 showed the gradient of rainfall- elevation in
the twenty years between 1990 and 2010.
After analysis of the first step, rainfall data are entered into Excel software to analyse two
monsoon periods in the study area. Thus, the spatial relation structures of monthly precipitation are
- 528 -Vol. 19 [2014], Bund. C 529
studied in two monsoon periods. The first one coincident with the NE monsoon (December-March) is
shown in Figure 6. Regression coefficients during the NE monsoon were calculated based on Eq. (1)
with r2 in Northeast monsoon rainfall-altitude about 0.0834 (December to March). The average
precipitation during this period equals 122.06 mm.
PMon = 93.234 + 0.3276 H + … (mm) (4)
Gradient of NE Monsoon Rainfall-Altitude
400
Height (m)
300
200
100
0
0 100 200 300 400 500 600
Monthly Rainfall (mm)
Figure 6. Gradient of northeast monsoon rainfall-altitude
In Figure 7 is shown the regression analysis of second period of monthly rainfall in the study area
with the southwest direction in relationship with elevation (April- November). Calculated regression
coefficients during the SW monsoon based on Eq. (1) is computed with r2 in Southwest monsoon
rainfall-altitude about 0.4866 (April to November). The average rainfall during this period equals
166.60 mm.
PMon = 16.238 + 0.7462 H + … (mm) (5)
Gradient of Southwest Monsoon Rainfall-Altitude
500
400
Height (m)
300
200
100
0
0 100 200 300 400 500 600
Monthly Rainfall (mm)
Figure 7: Gradient of southwest monsoon rainfall-altitude
- 529 -Vol. 19 [2014], Bund. C 530
From Figure 5 to Figure 7, one result that can be found is that the trend charts show the increased
rate of precipitation in relation to elevation very well, and predicts an increase in the rate of rainfall at
other heights. The precipitation in the southwest monsoon is generally higher than in northeast
monsoon of Hulu Kelang all year round. The southwestern region of Hulu Kelang receives higher
amounts of precipitation than other aspects. The minimum amount of precipitation occurs in June and
July, while the maximum occurs in November and April.
The output maps of the linear regression method based on DEM model
The main result of this study is that an overlay layer map entitled “Rainfall data, aspect, and
DEM” was obtained using ARCGIS tools. Weight assign method is used in this study with correlation
between the rate of rainfall events and height of rainfall gauge station. The rainfall mapping index is
calculated based on the weight values obtained from the regression method (Eq. (2)).
P = 65.536(x, y) + 0.4757(x, y) Elevation + 0.01(x, y) Aspect (6)
The final overlay of effective layers is defined in figure 8. To fulfil this task, the complete
correlation between rainfall data, DEM, and southwest and northeast rainfall directions is performed
using ARCGIS 10. The relation between monthly average rainfall (1990-2010) and effective variables
showed that study area precipitation is strongly controlled by elevation in the west region and
monsoon directions. Using different spatial resolutions of the DEM did not result in considerable
differences in the correlation, which means that the relation between precipitation and elevation is
quite stable from large to small scale. With the increasing of elevation, precipitation also increases.
Validation of the Geographically Weighted Regression (GWR) method
The root-mean-square error (RMSE) and the mean absolute error (MAE) are used for validation
of modeled precipitation by the nine test stations (See Table 1). RMSE for whole year, NE monsoon,
and SW monsoon yielded precipitation values of 7.92 mm, 8.62 mm, and 10.71 mm, respectively,
accounting for 15.42%, 7%, and 11.29% of measured precipitation. Upon considering the ordinary
least squares (OLS), predicted precipitation values increased only slightly, i.e. by less than 2.9 mm,
adjusting for MAE and RMSE. This demonstrates that the residuals are random errors, and that our
regression model works quite well for interpreting the spatial variability of precipitation.
- 530 -Vol. 19 [2014], Bund. C 531
Figure 8: Final overlay of the average monthly precipitation in based on Eq. (8)
This demonstrates that RMSE for the whole year is less than two monsoons, and that a whole
year regression model works much better than other results for interpreting the spatial variability of
precipitation.
Table 1: Validation of the Geographically Weighted Regression (GWR) method
After ordinary least squares
After regression only
(OLS)
Measured
MAE MAE RSME RMSE MAE MAE RSME RMSE
Period precipitation
(mm) (%) (mm) (%) (mm) (%) (mm) (%)
(mm)
Whole year 10.15 22.50 7.92 15.42 9.04 22.18 5.94 14.85 189.60
NE
23.75 25.86 8.62 7.00 23.37 25.74 7.63 6.68 151.70
monsoon
SW
21.11 26.29 10.71 11.29 18.78 20.12 9.60 10.18 215.60
monsoon
- 531 -Vol. 19 [2014], Bund. C 532
CONCLUSIONS
This paper provides the relationship between the average monthly precipitation and elevation in
the Hulu Kelang area based on Geographically Weighted Regression (GWR) method. The following
conclusions can be drawn from three periods of precipitation which are the average monthly rainfall
and two monsoon periods in the study area.
1. The GWR represents the relationship between the average monthly precipitation distribution,
elevation and two monsoon directions. The final rainfall mapping index calculated is based on the
weight values obtained from the regression method which could be written:
P = 65.536(x, y) + 0.4757(x, y) Elevation + 0.01(x, y) Aspect.
2. The root-mean-square error (RMSE) and the mean absolute error (MAE) verification results
indicated that the whole year regression model works better than other results for interpreting the
spatial variability of precipitation.
3. The relation between original normal precipitation (1990-2010) and topography variables showed
that study area precipitation is strongly controlled by elevation in the west region. The final map
indicated that precipitation in the west region is generally higher than in east region of Hulu
Kelang all year round.
ACKNOWLEDGEMENTS
The authors acknowledge and appreciate the provision of rainfall data by the Ampang Jaya
Municipal Council (MPAJ), the Slope Engineering Branch of Public Works Department Malaysia
(PWD), and the Department of Irrigation and Drainage Malaysia (DID), without which this study
would not have been possible.
REFERENCES
1. Heuvelink, G.B.M. (2006). Incorporating process knowledge in spatial interpolation of
environmental variables. 7th International Symposium on Spatial Accuracy Assessment in
Natural Resources and Environmental Sciences.
2. Salter, M. de. C.S. (1918). The relation of rainfall to configuration. British Rainfall 58:40–56.
3. Barry, R.G. (1992). Mountain Weather and Climate, second edition. London and New York.
Routledge Publishing Company.
4. Berndtsson, R. (1988). Spatial hydrological processes in a water resources planning
perspective- An investigation of rainfall and infiltration in Tunisia. Report No. 1009, Dept. of
Water Resour. Eng., Inst. of Technology, University of Lund, Sweden. 315.
5. Uvo, B.C. and Berndtsson, R. (1996). Regionalization and spatial properties of Ceará State
rainfall in Northeast Brazil. Geophys Res 101:4221-4234.
6. Mukhlisin, M., Idris, I., Salazar, A.S., Nizam, K., Taha, M.R. (2010). GIS based landslide
hazard mapping prediction in Ulu Klang, Malaysia. ITB Scientific Journal 42A(2):163-178.
7. Sidle, R. C. and Ochiai, H. (2006). Landslides: Processes, Prediction, and Land Use, Water
Resources Monograph. 18:312.
- 532 -Vol. 19 [2014], Bund. C 533
8. Cevik, E. and Topal, T. (2003). GIS-based landslide susceptibility mapping for a problematic
segment of the natural gas pipeline, Hendek (Turkey). Environmental Geology 44:949–962.
9. Lee, S. (2005). Application of logistic regression model and its validation for landslide
susceptibility mapping using GIS and remote sensing data. International Journal of Remote
Sensing 26:1477–1491.
10. Galli, A., Wurz, P., Bochsler, P., Barabash, S., Grigoriev, A., Futaana, Y. and Holmström, M.
(2008). First observation of energetic neutral atoms in the Venus environment. Planetary and
Space Science 56(6):807–811.
11. Dai, F.C., Lee, C.F., Li, J. and Xu, Z.W. (2001). Assessment of landslide susceptibility on the
natural terrain of Lantau Island, Hong Kong. Environmental Geology 43(3):381–391.
12. Suzen, M.L. and Doyuran, V. (2004). Data driven bivariate landslide susceptibility
assessment using geographical information systems: a method and application to Asarsuyu
catchment, Turkey. Engineering Geology 71:303–321.
13. Komac, M., (2006). A landslide susceptibility model using the analytical hierarchy process
method and multivariate statistics in perialpine Slovenia. Geomorphology 74(1–4):17–28.
14. Mohammadi, M. (2008). Mass movement hazard analysis and presentation of suitable
regional model using GIS (Case Study: A part of Haraz Watershed). M Sc Thesis Tarbiat
Modares University International Campus Iran.
15. Alison, M.A., Gerard, H.R., Bernard, H., David, R.M., Noah, J.F. and Jaakko, P. (2006).
Spatial patterns of precipitation and topography in the Himalaya. Geological Society of
America 398.
16. Sasi, K.V., Sampath, S., Vinayak, P.K. and Harikumar, R. (2007). Rainfall intensity
characteristics at coastal and high altitude stations in Kerala. Earth System Science
116(5):451–463.
17. Craig, D.S. (2009). The relationship between monthly precipitation and elevation and
elevation in the Canadian rocky mountain foothills. Western Snow Conference.
18. Haiden, T. and Pistotnik, G. (2009). Intensity-dependent parameterization of elevation effects
in precipitation analysis. Advanced Geosciences 20:33–38.
19. Jessica, D.L., Justin, R.M., Paul, J.N. and Ellen, S. (2010). Relationships between Barrier Jet
Heights, Orographic Precipitation Gradients, and Streamflow in the Northern Sierra Nevada.
Journal of Hydrometeorology 11(5):1141-1156.
20. Sawyer JS (1956). The physical and dynamical problems of orographic rain. Weather
11:375–381.
21. Pedgley DE (1970). Heavy rainfalls over Snowdonia. Weather 25:340–350.
22. Barbro, J. and Deliang, C.H. (2003). The influence of wind and topography on precipitation
distribution in Sweden: statistical analysis and modeling. International Journal of
Climatology 23:1523–1535.
23. Propastin, P. and Kappas, M., (2008). Reducing uncertainty in modelling NDVI precipitation
relationship: a comparative study using global and local regression techniques. GIScience and
Remote Sensing 45:1-25.
- 533 -Vol. 19 [2014], Bund. C 534
24. Fotheringham, A.S., Brunsdon, C. and Charlton, M.E. (2002). Geographically weighted
regression: The analysis of spatially varying relationships. Chichester: Willey
25. Brunsdon, C., Fotheringham, A.S. and Charlton, M.E. (1996). Geographically weighted
regression: a method for exploring spatial non-stationarity. Geographical Analysis 28: 281-
298.
26. Desa, M.N. and Niemczynowicz, J. (1996). Temporal and spatial characteristics of rainfall in
Kuala Lumpur, Malaysia. Atmospheric Research 42(1-4):263-277.
© 2014, EJGE
- 534 -You can also read