Interim Results 2018 - ITV plc
←
→
Page content transcription
If your browser does not render page correctly, please read the page content below

Interim Results 2018
       25 July         1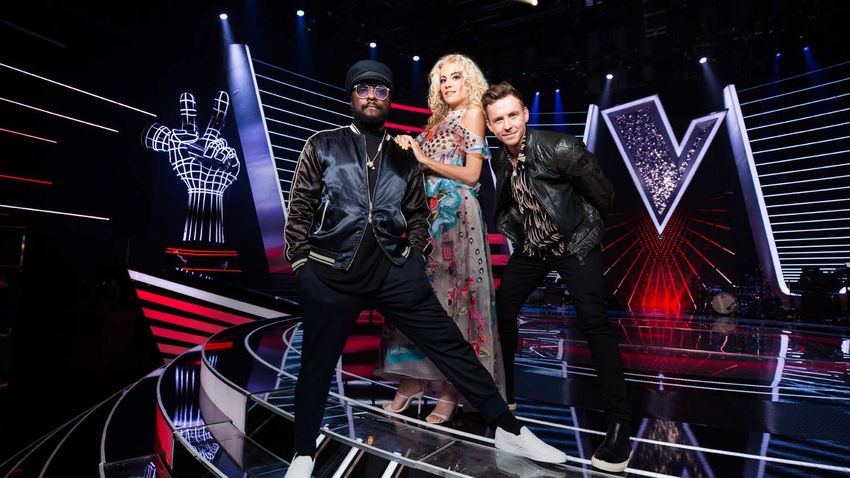
Agenda

Key Messages and Highlights                Carolyn McCall

Half Year Financial and Operating Review   Ian Griffiths

Strategic Update                           Carolyn McCall

Q&A

                                                            2
Key Messages: Half Year
       Carolyn McCall

                          3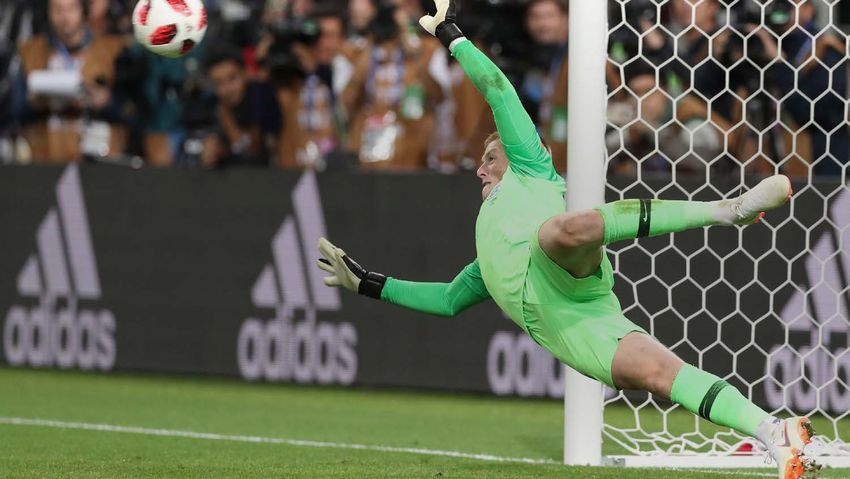
Key Messages: Half Year
•   Key focus of today is to set out ITV’s strategy to deliver growth and to ensure that
    the business is well positioned for the future
•   Solid foundations on which to execute the strategy
       —    ITV Broadcast is uniquely positioned to connect the nation and build brands
            for our advertisers across multiple platforms
       —    ITV Studios is a strong and scaled international content business
•   Clear vision and initiatives to respond to the rapidly changing competitive landscape
•   Strong balance sheet and healthy liquidity
       —    flexibility and capacity to invest to grow the business, and
       —    deliver returns to shareholders
•   Continued strong operating performance in the first half of 2018

                                                                                            4
2018 H1 Financial and Operating Highlights

  External Revenue    Adjusted EBITA   Adjusted EPS
   £1,593m              £375m             7.1p
     (+8% YOY)          (-7% YOY)        (-8% YOY)

                                        ITV Studios
  Total advertising   Online Revenue
                                       Total Revenue
       +2%               +48%            +16%

                                                       5
Half Year Financial &
 Operating Review
       Ian Griffiths

                        6
Broadcast & Online - Revenue
3% revenue growth in an uncertain market

                                         2018     2017*    Change   • Revised reporting aligned with
                                           (£m)     (£m)              strategic refresh
Total Advertising revenue                  890     871        2%
                                                                    • Total advertising revenue up 2%
Direct to Consumer                          41      29       41%      as expected
SDN                                         36      35        3%
                                                                    • 48% growth in high margin Online
Other revenue                               78      81       (4)%     revenue
Non-Advertising revenue                    155     145        7%
                                                                    • Beginning to deliver growth
Total revenue                            1,045    1,016       3%      potential from Direct to
Network Schedule costs                   (567)    (532)      (7)%     Consumer
Variable Costs                             (57)    (43)     (33)%   • Other revenue includes revenue
Broadcast infrastructure and overheads   (164)    (148)     (11)%     from platforms and third party
                                                                      services
Broadcast & Online EBITA                   257     293      (12)%
EBITA margin                               25%     29%

                                                                                          *Restated for IFRS15   7
Broadcast & Online - Costs
Profit impacted by the phasing of schedule costs
2018 2017* Change • Schedule costs reflect the phasing of
(£m) (£m) World Cup fixtures
Total Advertising revenue 890 871 2%
• No change in the full year NPB guidance
Direct to Consumer 41 29 41%
• Variable costs reflect bandwidth
SDN 36 35 3% increases from Hub viewing and Direct
Other revenue 78 81 (4)% to Consumer pay per view trial
investments
Non-Advertising revenue 155 145 7%
Total revenue 1,045 1,016 3% • Overheads include higher property
costs from new London buildings and
Network Schedule costs (567) (532) (7)% currency on transmission contracts
Variable Costs (57) (43) (33)%
• Full year overheads, after phasing
Broadcast infrastructure and overheads (164) (148) (11)% unwinds, more inline with prior year
Broadcast & Online EBITA 257 293 (12)%
• Margin impact mainly from
EBITA margin 25% 29% cost phasing
*Restated for IFRS15 8On-screen & Online Viewing
Delivering mass and targeted viewing on all platforms
Growing both volume and share of viewing ITV delivered Total viewing hours
23.5
up 5%
3,0 00 25
99% of all
21.1 21.7 21.7
commercial
2,5 00
20
15.7 17.0
15.5 audiences over 5m on ITV Family
2,0 00
14.7 15
1,5 00
1.8 1.9 1.7 1.8
1.3
10
1,0 00
1.3 1.4 1.2
25m Online viewing
5
500
+33%
0 0
2015 2016 2017 2018 ITV Hub
registered users
ITV Main Channel ms ITV Family ms ITV Main Channel Share ITV Family Share
Long-form
ITV Channels’ share pointdemographics
changes Simulcast requests
Delivering SOV growth in target video requests
16-34s
+23% +40%
Individuals
19% ABC1 Ads Love Island: England vs Croatia:
Men
11%
0.0
6% 5%
Averaged 0.3m
simulcast audience 0.9m
ITV ITV2 ITV3 ITV4 per episode simulcast audience
Viewing millions – average viewing per hour across the day
Viewing figures – YTD 30 June
9Total Advertising Revenue
Total Advertising up 2% as expected, with advertising by online brands up 15%
HY
2018 Monthly Total Advertising
Category 2018 HY YOY %
30% (VOD and spot combined) (£m) change
25% Retail 137.3 -7.4%
20%
Entertainment and Leisure 100.5 26.3%
15%
10%
Finance 87.5 -4.4%
5% Cars and Car Dealers 60.4 -3.6%
0%
Food 53.5 -3.1%
-5%
Cosmetics and Toiletries 53.2 4.0%
-10%
-15% Telecommunications 50.3 12.5%
-20%
Airlines, Travel and Holidays 47.2 -14.7%
Jan Feb Mar Apr May Jun
Publishing and Broadcasting 38.7 -7.3%
Monthly YOY Moving Annual Total
Interior Furnishing 24.4 -3.8%
10ITV Studios
Strong performance with growth from all production territories
• Total revenue up 16%
2018 2017* Change
(£m) (£m)
• Organic revenue up 11%
Studios UK 328 306 7%
ITV America 141 138 2% • 57% of revenues from outside UK
Studios RoW 247 159 55% • Studios UK up £22m with good
Global Entertainment 87 89 (2)% performance both on and off ITV
Total Studios revenue 803 692 16%
• ITV America up 11% at constant currency,
Total Studios costs (685) (582) (18)% with growth driven by entertainment
ITV Studios EBITA 118 110 7%
• Studios RoW delivered strong growth
EBITA margin 15% 16% from international versions of The Voice
and Love Island
Internal – ITVS to ITV Network 254 239 6%
• Margin impacted by genre mix
External revenue 549 453 21%
Total revenue 803 692 16% • £12m revenue and £1m negative
EBITA impact from currency
EBITA includes the benefit of production tax credits 11
*Restated for IFRS15ITV Studios
On track to delivering good organic revenue growth over the full year
YoY Studios Revenue Tracker • Organic revenue growth in all
12 803 production territories
50
• Driven by both new and
45 recommissioned shows
15 • On track to deliver good organic
692 13
growth over the full year
H1 2017 UK Studios America RoW Acquisitions FX H1 2018
• 88% of our full year revenues already
YoY Studios Revenue Tracker secured, £96m more than this time
2 803 last year
50
692 98 • Strong slate of deliveries in H2,
especially scripted, including Vanity
138
103 Fair, War of the Worlds, Suburra, ABC
Murders, and Good Witch
H1 2017 Not Returning New Returning Acquisitions Other/FX H1 2018
12ITV Studios
Scaled in unscripted, growing in scripted
2018 2017 Change Scripted
(£m) (£m)
Scripted 142 114 25%
Unscripted 511 448 14%
Heartland ITV and Other 150 130 15%
Total Revenue 803 692 16%
Unscripted Heartland ITV
13Adjusted & Statutory Results
• Dividend commitment for 2018 and 2019 of at least 8p for the full year
• Adjusted earnings and EPS impacted by phasing of costs, especially NPB
• Partly offset by profitable growth in Online and ITV Studios
• Statutory profit up year on year as a result of lower exceptionals and amortisation
Adjusted Exceptional
Adjusted EPS Dividend Statutory EPS
Earnings Items
£285m 7.1p 2.6p 5.3p £40m
(2017: £307m (2017: 7.7p (2017: 2.52p (2017: 5.1p
(2017: £53m)
-7% YOY) -8% YOY) 3% YOY) 4% YOY)
14Robust Balance Sheet Underpinned by Strong Cashflows
Profit to cash* Leverage Facilities Net pension surplus
1.2x
94% 1.2x in 2017 £930m £86m
91% in 2017 (net debt/ adjusted £770m undrawn £83m deficit at FY 2017
EBITDA)
* On a rolling 12 month basis 15Outlook
• Planning assumptions remain unchanged
• Getting on with the execution of the new strategy
• Expect to deliver double digit growth in online revenues over the full year
• Expect to deliver good organic total revenue growth in ITV Studios
• Total advertising is expected to be up 1% in the 9 months to 30 September
• Healthy balance sheet and strong cashflows
• Sustainable returns to shareholders – committed to a dividend of at least 8p for
the full year 2018 and 2019
16Strategic Update
Carolyn McCall
17Strategic Update
1. Resilience of TV and ITV
2. ITV’s Vision – ‘More than TV’
3. ITV’s Strategy
4. Investments and KPIs
5. Capital Allocation
6. Summary
18Section 1 Resilience of TV and ITV
ITV isn’t Going Anywhere, it’s Going Everywhere
203 minutes Over 70%
of TV viewing per person per day of all TV set viewing is watched live
TV is the single biggest 92 of top 100
video platform for 16-34’s programme titles viewed were UK originated
Television has 25.5% share 5% growth in global content market
of the total advertising market expected over the medium term
19Section 2 ITV’s Vision
ITV’s Vision is to be…More than TV
• The pre-eminent integrated Producer Broadcaster for viewers and brands in the UK
• A leading direct to consumer business in the UK with strong consumer relationships
• A world class creative force in global content production
• A lean and agile organisation with leading capabilities in data analytics and technology
• A future facing, modern and digital brand that is relevant to all viewers and brands
• A sustainable, cash generative and growing business delivering for our shareholders
20Section 3 ITV Strategy
Embed data
Reposition ITV as
analytics and
a future facing,
technology to
modern and digital
understand and
1 brand, relevant to
serve viewers and
STRENGTHEN all viewers and
advertisers better
brands
2 3
GROW CREATE
Be a lean and
agile organisation
capable of
perpetual change
21Section 3 Integrated Producer Broadcaster – Structurally Sound
1
STRENGTHEN
Integrated
Producer Broadcaster
22Section 3 Integrated Producer Broadcaster – Structurally Sound
Strengthen the Integrated Producer Broadcaster
• Make ITV Hub a destination for ITV viewers
• Invest in the ITV brand to win ‘light viewers’ and broaden the brand’s appeal
• Invest in data, analytics, insight and technology to understand and serve
viewers and advertisers better
• Strengthen our relationships with ambitious brands making ITV the brand
marketing partner of choice
• Maximise the value of our investment in content through 360 commissioning
and even closer linkage with Studios
23Section 3 Integrated Producer Broadcaster – Structurally Sound
ITV Hub
• ITV Hub will be a core part of Broadcast, integrated into programming
and marketing decisions
• Improved user experience – increased personalisation, enhanced product
and expanded content offering
• Over 3 years, we will increase registered users from 25m to 30m
• Deliver double digit online revenue growth per annum over the next 3 years
• Building on fantastic success of Love Island and World Cup
24Section 3 Integrated Producer Broadcaster – Structurally Sound
Re-position the ITV Brand to Drive Deeper Engagement with Light Viewers
• We have identified a segment of 15 million light viewers who we can win back to
ITV more often.
• Viewer research shows that the primary barrier to ITV for this segment is limited
awareness of our offering, and lack of brand visibility (share of voice) off our network.
• Through increased marketing investment we can target them consistently, drive brand
reappraisal, increase viewing of our content and build deeper relationships
• This will help maintain our monthly reach, a key competitive commercial advantage for ITV.
25Section 3 Integrated Producer Broadcaster – Structurally Sound
Integrated Producer Broadcaster: Commercial Ambition
• Leading platform for brand building in UK where brands create their
greatest business impact
— Superior mass simultaneous reach
Data — VOD advertising
driven
— Addressable advertising, initially on VOD
Returns
focused — Expand TV propositions portfolio, to solve our
Client clients’ business problems
orientated
— Leverage the full creative power and analytic capabilities
from across ITV
• Evolve relationship with agencies
• Strengthen direct advertiser relationships
26Section 3 Integrated Producer Broadcaster – Structurally Sound
360 Monetisation: Love Island
Studios
Create & Produce Format Sales
Direct to Consumer
Merchandise
Created by ITV in the UK and Love Island format Personalised water bottles,
produced in all countries sold to 7 countries phone cases, and wash bags
Love Island: The Game
Broadcast & Online
Viewing ITV Total Advertisings Revenue Free to play with
• >3m live viewers NAR, Sponsorship and VOD in-app purchases
• Increasing to 2m
16-34s viewing live Commercial Partnerships Love Island App
(Licensing & Product Placement) • Voting • Shopping
• 2nd biggest audience
on a digital channel • Preview • Links
since records go back
Podcast
• Averaged 0.3m simulcast Daily podcast
audience per episode boosting engagement
27Section 3 Integrated Producer Broadcaster – Structurally Sound
Data Analytics
Data Analytics ‘Centre of Excellence’
Data Scientists + Advanced Tools + Deep & Growing Data Sets (profiles, viewing, purchases etc.)
Promoting broader,
Driving increased Delivering an enhanced Supporting advertising
deeper and more
overall audience reach experience and longer with advanced and
valuable consumer
and engagement viewing sessions more creative solutions
relationships
Data analytics will drive a step-change in user/viewer experience and our relationships with consumers
This will deliver value for ITV through expanding our advertiser propositions
and enabling proper monetisation of our consumer relationships
28Section 3 Integrated Producer Broadcaster – Structurally Sound
Investment and KPIs
Investment – around £40m over 3 years in KPIs for measuring performance
• Enhanced development and Advertising • Total advertising
distribution of the Hub revenue
• Marketing ITV brand and content Marketing • ITV Family SOV %
• Data capabilities and • ITV Family SOCI %
1
• Technology to support data and Viewing • Total ITV viewing
STRENGTHEN
ad proposition Integrated • Monthly total reach
• Addressable advertising capabilities Producer Broadcaster • % of Commercial
audiences over 5m
Targets – 3 years to the end 2021 Hub • Registered users
• Grow ITV Hub registered users to 30 million • Online consumption
• Double digit online revenue growth per annum • Long form video requests
• Increase brand consideration to 60% • % increase in monthly
active users
29Section 3 ITV Strategy
1
STRENGTHEN
Integrated
Producer Broadcaster
2
GROW
UK and Global
Production
30Section 3 UK and Global Production – Profitable Growth
2
GROW
UK and Global
Production
31Section 3 UK and Global Production – Profitable Growth
ITV Studios is a Scaled International Content Business
Produce in 11
9,000+ hours and sell to 196 50+ labels
produced a year countries
Historic acquisitions
50+ formats 40,000 hours delivering
library double digit return
32Section 3 UK and Global Production – Profitable Growth
Grow UK and Global Production
• Competitive advantage of being an Integrated Producer Broadcaster
— 360 commissioning
— Drama investment fund
— Entertainment pilot fund
• Continue to generate new hits
— Attract and retain great talent
— Consider value creating M&A and talent deals in both scripted drama and unscripted entertainment
— Target FAANG originals and premium international co-productions
• Boost our monetisation capability
• Restructuring to deliver efficiencies
33Section 3 UK and Global Production – Profitable Growth
Grow UK and Global Production
34Section 3 UK and Global Production – Profitable Growth
Investment and KPIs
Investment - £10m over 3 years in KPIs for measuring performance
• Joint development funds for drama Scripted • Drama hours
and entertainment • Returning drama hours
• Strengthening creative talent • Total scripted revenue
• Monetisation capabilities 2
Unscripted • Number of unscripted hours
GROW
UK and Global • Total number of formats
Production • Number of formats sold in
Targets – 3 years to the end 2021 3 or more countries
• Grow total production hours to 10,000 • Total unscripted revenue
• Total Studios revenue to grow at least 5%
average CAGR
• EBITA margin of 14% to 16%
35Section 3 ITV Strategy
1
STRENGTHEN
Integrated
Producer Broadcaster
2 3
GROW CREATE
UK and Global Direct to
Production Consumer
36Section 3 Direct to Consumer – Accelerate Revenues
3
CREATE
Direct to
Consumer
37Section 3 Direct to Consumer – Accelerate Revenues
Direct to Consumer Today
>1 million 30,000 1.5m
visitors to Coronation Street
attended This Morning Live The Chase app downloads
and Emmerdale
>350k >130 95m
Love Island votes cast in the
competitions
water bottles sold last 12 months
38Section 3 Direct to Consumer – Accelerate Revenues
Create Direct to Consumer Business Opportunities
• SVOD opportunity
• Grow revenue to £100m over 3 years via
profitable engagement with viewers
• Strong IP and brands
— Acceleration of established areas:
— Interactive • Mass & passionate fan base
— Hub+ • Promotion from FTA
— Events
— Development of nascent areas: • Strong and growing online platform
— Pay per view • Investment in data and technology
— Gaming
— Merchandise • Direct targeted marketing
• Further revenue potential from • ITV creative capabilities
new innovative products
39Section 3 Direct to Consumer – Accelerate Revenues
Investment and KPIs
Investment – up to £10m over 3 years KPIs to measure performance
• Leverages the benefits from • Total Direct to Consumer
investment made in the IPB around relationships
data, marketing and the Hub • % increase in monthly active users
• Investment in competition portal 3 • % conversion rate to paying
• Investment in new Direct to CREATE relationships
Consumer opportunities Direct to • Net promoter score
Consumer
• Excludes SVOD investment
KPIs to measure performance as
Targets – 3 years to the end 2021 data systems allow
• Grow Direct to Consumer revenue • Unique customer relationships
to at least £100m
• ARPU
• 10m paying product relationships
40Section 3 ITV Strategy
Embed data
Reposition ITV as
analytics and
a future facing,
technology to
modern and digital
understand and
1 brand, relevant to
serve viewers and
STRENGTHEN all viewers and
advertisers better
brands
2 3
GROW CREATE
Be a lean and
agile organisation
capable of
perpetual change
41Section 4 Investments and KPIs
Total Investments will be Significantly Offset by Cost Savings
2019 2020 2021 Total
Investment – (40) (10) (10) (60)
in year
Cost savings – 15 10 10-15 35-40
in year
Net impact – before (25) - - (20-25)
revenue benefits
Only 2019 will be impacted by the investment –
cost savings in future years will offset further incremental investment
42Section 4 Financial Targets
1. Targets – 3 years to the end 2021
• Grow ITV Hub registered users to 30 million 3. Targets – 3 years to the end 2021
• Double digit online revenue growth 1 • Grow D to C revenue to at
per annum STRENGTHEN least £100m
Integrated • 10m paying product relationships
• Increase brand consideration to 60% Producer Broadcaster
ITV Targets – 3 years
2. Targets – 3 years to the end 2021 2 3 to the end 2021
• Grow total production hours GROW CREATE • Grow total non
to 10,000 UK and Global Direct to advertising revenues
Production Consumer by at least 5% CAGR
• Total Studios revenue to grow
at least 5% average CAGR • Deliver £35 to £40m of
cost savings over 3 years
• EBITA margin of 14% to 16%
• Maintain profit to
cash conversion at
around 85%
43Section 5
Capital Allocation Framework
Investing to drive organic growth
Value creating M&A in line with strategic priorities
Dividend policy
• For 2018 and 2019 the Board intends to pay a full year dividend of at least 8p
• Over the medium term the dividend will grow broadly in line with earnings
Our objective is to maintain investment grade credit
44Section 6
Summary
• We start with great foundations
• We have a clear vision for how we can compete and win in a rapidly changing environment
• We are clear what we need to do to achieve this
• ITV Vision is to be… ‘More than TV’
– An integrated producer broadcaster where our ambition is to maintain total viewing
and increase total advertising revenue
– A growing and profitable content business, which drives returns
– A Direct to Consumer business delivering value by developing strong direct consumer relationships
– Delivering attractive returns to shareholders
• Capital Markets Day on 19th September
45Q&A
46Appendix
472018 FY Planning Assumptions
P&L Cash
Schedule Costs Around £1,055-60m – as previously announced Capex Around £100m with £60m of regular capex and £40m
relating to the London property move in 2018
Investments Total of around £15-20m – as previously guided but Profit to cash Around 85% – continued strong cash flow generation
including initial investments in line with the new strategy
Adjusted Around £35m – broadly unchanged from 2017 Pension Deficit funding contributions are expected to to be in line
Interest with prior year
Tax Adjusted effective tax rate around 19%, unchanged and Exceptional Cash cost of exceptionals will be around £85m
expected to be sustainable over the medium term Items
Foreign Translation impact of FX, assuming rates remain at
Exchange current levels, will negatively impact revenue by £20m and
profit by £nil
Exceptional Around £85m, mainly due to acquisition accounting and
Items London office and Studios moves
482019 FY Planning Assumptions
P&L Cash
Schedule Costs Around £1.1bn – as previously announced Capex Deficit funding contribution expected to reduce to around
£75m
Investments £40m across the business Exceptional £15-20m cost of change to deliver cost savings in 2019
items – up to £30m in total over the 3 years
Cost Savings Around £15m across the business
49Reconciliation Between 2018
Statutory and Adjusted Earnings
Statutory Adjustments Adjusted
Six months to 30 June (£m) (£m) (£m)
EBITA* 367 8 375
Total exceptional items (40) 40 -
Amortisation and impairment (41) 38 (3)
Financing costs (18) 3 (15)
JV’s & Associates (3) - (3)
Profit before tax 265 89 354
Tax (52) (16) (68)
Profit after tax 213 73 286
Non-controlling interests (1) - (1)
Earnings 212 73 285
Number of shares (weighted average) 3,998 3,998
Earnings per share 5.3p 7.1p
*Adjusted EBITA includes the benefit of production tax credits 50New Broadcast & Online P&L – Historic Results
FY 2017 FY 2016 FY 2015
(£m) (£m) (£m)
Total ITV Advertising revenue 1,781 1,833 1,853
Direct to Consumer 65 58 58
SDN (external) 70 67 64
Other revenue 160 167 163
Non-Advertising revenue 295 292 285
Total revenue* 2,076 2,125 2,138
Network Schedule costs (1,025) (1,049) (1,045)
Variable Cost of Sales (106) (90) (76)
Broadcast infrastructure and overheads (346) (344) (358)
Broadcast & Online EBITA 599 642 659
EBITA margin 29% 30% 31%
51
*Restated for IFRS15Broadcast Schedule Costs
Six months to 30 June 2018 2017 Change
(£m)
(£m)
Commissions 302 300 (1)%
Sport 77 50 (54)%
Acquired 18 16 (13)%
ITN News and Weather 25 25 -
Total ITV main channel 422 391 (8)%
Regional news and non-news 35 35 -
ITV Breakfast 24 21 (14)%
Total ITV inc regional & Breakfast 481 447 (8)%
ITV2, ITV3, ITV4, ITV Encore, ITVBe, CITV 86 85 (1)%
Total schedule costs 567 532 (7)%
52ITV Studios Revenue
2018 2017** Organic
Six months to 30 June (£m) (£m) Change change*
Studios UK 328 306 7% 4%
ITV America 141 138 2% 11%
Studios RoW 247 159 55% 29%
Global Entertainment 87 89 (2)% -
Total revenue 803 692 16% 11%
* At constant currencies and excluding revenue from 2018 acquisitions 53
**Restated for IFRS15Acquisitions – 2012 to 2018
Expected
Initial Additional future Total expected Expected Total maximum
Company consideration payment
consideration payments* consideration** consideration**
(£m) paid (£m) (£m) (£m) dates (£m)
Total for 2012-2017 941 116 269 1,326 2018-2024 2,346
Total 941 116 269 1,326 2,346
* Undiscounted and adjusted for foreign exchange. All future payments are performance related. Of £269m expected future payments, £169m recorded on the balance sheet to date.
** Undiscounted and adjusted for foreign exchange, including initial consideration and excluding working capital adjustments.
54Financing Costs
2018 2017
Six months to 30 June (£m) (£m)
€600m Eurobond at 2.125% coupon Sept 22 (6) (6)
€500m Eurobond at 2% coupon Dec 23* (7) (7)
£630m Revolving Credit Facility (1) (2)
Financing costs directly attributable to bonds and loans (14) (15)
Cash-related net financing costs (1) (2)
Adjusted financing costs (15) (17)
Mark-to-market swaps and foreign exchange - -
Imputed pension interest (1) (4)
Unrealised foreign exchange and other net financial losses (2) (2)
Net financing costs (18) (23)
* effective coupon of 3.5% 55P&L Tax Charge and Cash Tax
2018 2017
Six months to 30 June (£m) (£m)
Profit before tax 265 259
Production tax credits 8 8
Total Exceptional items 40 53
Amortisation of intangible assets* 38 55
Adjustments to net financing costs 3 6
Adjusted profit before tax 354 381
Tax charge (52) (53)
Production tax credits (8) (8)
Charge for exceptional items (3) (3)
Charge in respect of amortisation of intangible assets* (4) (7)
Charge in respect of adjustments to net financing costs (1) (1)
Other tax adjustments - 1
Adjusted tax charge (68) (71)
Effective tax rate on adjusted profits 19% 19%
Total adjusted cash tax paid (excluding receipt of production tax credits) (51) (74)
* In respect of intangible assets arising from business combinations. Also reflects the cash tax benefit of US goodwill 56Analysis of Net Debt
30 June 2018 2017
(£m) (£m)
£630m Revolving Credit Facility (160) (240)
€600m Eurobond* (528) (523)
€500m Eurobond** (424) (425)
Finance Leases - (6)
Other debt (17) (3)
Cash and cash equivalents 95 123
Net debt (1,034) (1,074)
30 June 2018 2017
(£m) (£m)
Cash and cash equivalents 95 123
Debt (1,129) (1,197)
Net debt (1,034) (1,074)
* Net investment hedge against Talpa investment; ** Net of £18m cross currency swap 57Borrowing Facilities
Type of Facility Facility Amount Amount drawn at Maturity
£m 30/06/2018
Revolving Credit Facility (RCF) 630 160 Various
Bilateral financing facility 300 - Jun 2021
Total 930 160
58Foreign Exchange
2017 2016
Revenue by currency – 12 months to 31 December (£m) (£m)
GBP 2,313 2,357
US dollar 435 397
Euro 274 224
Other currencies 110 86
External revenue 3,132 3,064
Foreign Exchange Sensitivity – impact of a 10% appreciation/depreciation in Sterling on a full year basis*
Currency Revenue (£m) Adjusted EBITA (£m)
USD ($) ±40-50 ±5-7
EUR (€) ±40-50 ±4-5
*An appreciation in Sterling has a negative effect on revenue and adjusted EBITA, a depreciation has a positive effect 59Profit to Cash Conversion
2018 2017
(£m) (£m)
Adjusted EBITA 375 403
Working capital movement (86) (115)
High end production tax credits 10 1
Share-based compensation and pension service cost 4 9
Acquisition of property, plant and equipment, and intangible assets (45) (26)
Capex relating to redevelopment of London HQ 24 3
Depreciation 13 17
Adjusted cash flow 295 292
Profit to cash ratio (6 months to 30 June) 79% 72%
Profit to cash ratio (12 months rolling) 94% 91%
60Adjusted Results
Six months to 30 June 2018 2017 Change
(£m) (£m)
Adjusted EBITA 375 403 (7)%
Internally generated amortisation (3) (3) 0%
Financing costs (15) (17) 12%
Share of losses on JVs and associates (3) (2) (50)%
Profit before tax 354 381 (7)%
Tax (68) (71) 4%
Profit after tax 286 310 (8)%
Non-controlling interests (1) (3) 67%
Earnings 285 307 (7)%
EPS (p) 7.1p 7.7p (8)%
Diluted EPS (p) 7.1p 7.6p (7)%
61Statutory Numbers
2018 2017
Six months to 30 June (£m) (£m) Change
Revenue* 1,593 1,469 8%
EBITA 367 395 (7)%
Amortisation and impairment (41) (58) 29%
Exceptional items (41) (53) 23%
Profit before interest and tax 285 284 0%
Net financing costs (18) (23) 22%
JV’s & Associates (3) (2) (50)%
Gain on sale of non-current asset 1 - -
Profit before tax 265 259 2%
Tax (52) (53) 2%
Profit after tax 213 206 3%
Non-controlling interests (1) (3) 67%
Earnings 212 203 4%
Basic earnings per share 5.3p 5.1p 4%
*Restated for IFRS15 6263
You can also read