2019 CAPITAL PROGRAM & 2018 RESULTS - February 13, 2019 - Zone Bourse

Page created by Kimberly Goodwin
 
CONTINUE READING
2019 CAPITAL PROGRAM & 2018 RESULTS - February 13, 2019 - Zone Bourse
2019 CAPITAL PROGRAM
           & 2018 RESULTS

February 13, 2019
2019 CAPITAL PROGRAM & 2018 RESULTS - February 13, 2019 - Zone Bourse
Forward-Looking Statements and Other Matters

This presentation (and oral statements made regarding the subjects of this presentation) contains forward-looking statements within
the meaning of Section 27A of the Securities Act of 1933 and Section 21E of the Securities Exchange Act of 1934. These are
statements, other than statements of historical fact, that give current expectations or forecasts of future events, including, without
limitation: the Company's 2019 capital budget and allocations (including development capital budget and resource play leasing and
exploration spend), future performance, organic free cash flow, corporate-level cash returns on invested capital, business strategy,
asset quality, drilling plans, production, cash margins, oil growth, cost and expense estimates, cash flows, uses of excess cash, return
of cash to shareholders, returns, including CROIC and CFPDAS, and EG EBITDAX, asset sales and acquisitions, leasing and
exploration activities, future financial position, tax rates and other plans and objectives for future operations. Words such as
“anticipate,” “believe,” “could,” “estimate,” “expect,” “forecast,” “future”, “guidance,” “intend,” “may,” “outlook”, “plan,” “project,” “seek,”
“should,” “target,” “will,” “would,” or similar words may be used to identify forward-looking statements; however, the absence of these
words does not mean that the statements are not forward-looking.

While the Company believes its assumptions concerning future events are reasonable, a number of factors could cause actual results
to differ materially from those projected, including, without limitation: conditions in the oil and gas industry, including supply/demand
levels and the resulting impact on price; changes in expected reserve or production levels; changes in political or economic conditions
in the jurisdictions in which the Company operates, including changes in foreign currency exchange rates, interest rates, inflation
rates, and global and domestic market conditions; capital available for exploration and development; risks related to our hedging
activities; well production timing; drilling and operating risks; availability of drilling rigs, materials and labor, including the costs
associated therewith; difficulty in obtaining necessary approvals and permits; non-performance by third parties of contractual
obligations; unforeseen hazards such as weather conditions; acts of war or terrorism, and the governmental or military response
thereto; cyber-attacks; changes in safety, health, environmental, tax and other regulations; other geological, operating and economic
considerations; and the risk factors, forward-looking statements and challenges and uncertainties described in the Company’s 2017
Annual Report on Form 10-K, Quarterly Reports on Form 10-Q and other public filings and press releases, available at
www.Marathonoil.com. Except as required by law, the Company undertakes no obligation to revise or update any forward-looking
statements as a result of new information, future events or otherwise.

This presentation includes non-GAAP financial measures, including organic free cash flow and E.G. EBITDAX. Reconciliations of the
differences between non-GAAP financial measures used in this presentation and their most directly comparable GAAP financial
measures are available at www.Marathonoil.com in the 4Q18 Investor Packet.

2
2019 CAPITAL PROGRAM & 2018 RESULTS - February 13, 2019 - Zone Bourse
Framework for Success
Our working definition of capital discipline

    Committed to our Framework
                                 • Portfolio transformation and focused capital allocation drive multi-year
        Corporate Returns          corporate returns improvement through capital efficient oil growth

          Free Cash Flow         • Sustainable free cash flow at conservative pricing

                                 • Return incremental capital to shareholders in addition to peer
         Return of Capital         competitive dividend; funded through free cash flow, not dispositions

                                 • Continuous improvement in capital efficiency and operating costs
      Differentiated Execution     while enhancing our resource base; delivering on our commitments

    Powered by our Foundation
                                 • Capital allocation flexibility, broad market access, supplier diversification,
       Multi-Basin Portfolio       rapid sharing of best practices, platform for talent development

                                 • Financial flexibility to execute business plan across broad range of
      Balance Sheet Strength       pricing; current net debt/EBITDAX among lowest in peer group

3
2019 CAPITAL PROGRAM & 2018 RESULTS - February 13, 2019 - Zone Bourse
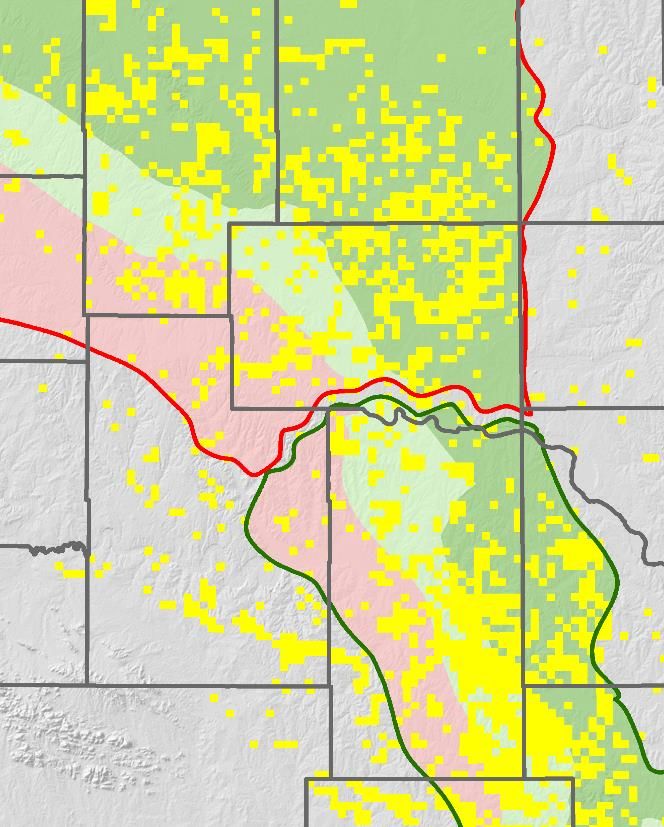
Forward Outlook Prioritizes Returns, FCF, Return of Capital
                        1

Organic FCF positive in both 2019 and 2020 above $45/bbl WTI, post-dividend

                                                                            • Continues multi-year rate of change improvement in key enterprise
                                                                              performance metrics
                Corporate Returns                                                    − 20% CROIC and 18% CFPDAS CAGRs (2017-2020) at $50/bbl
                                                                                       WTI flat
                                                                                     − 30% CROIC and CFPDAS CAGR (2017-2020) at $60/bbl WTI flat

                                                                            • Organic FCF positive above $45/bbl WTI in both 2019 and 2020
                                                                            • Portfolio delivers strong two-year (2019-2020) organic FCF
                   Free Cash Flow
                                                                                     − >$750MM at $50/bbl WTI flat
                                                                                     − >$2.2B at $60/bbl WTI flat

                                                                            • Continue to prioritize return of capital
                                                                                     − Returned over 25% of operating cash flow to shareholders in
                 Return of Capital                                                     2018
                                                                                     − Return of capital metric incorporated into executive
                                                                                       compensation scorecard, complementing CROIC and CFPDAS

                                                                            • High value oil growth exceeds BOE growth, an outcome of returns-
                                                                              first capital allocation
         Differentiated Execution                                                    − 2019 U.S. oil growth of 12% and total oil growth of 10%
                                                                            • Maintaining focus on organic resource base enhancement

     1Organic  FCF = Operating Cash Flow before working capital (excl. exploration costs other than well costs), less Development Capex, less Dividends, plus EG return of
     capital & other 2CROIC = Cash return on invested capital; calculated by taking cash flow (Operating Cash Flow before working capital + net interest after tax) divided by
     (average Stockholder’s Equity + average Net Debt); 3CFPDAS = Cash flow per debt adjusted share; calculated by taking cash flow (Operating Cash Flow before working
4    capital + net interest after tax) divided by total shares including debt shares. Debt shares is the average net debt during a calendar year divided by the average
     annual stock price;         See the 4Q 2018 Investor Packet at www.Marathonoil.com for non-GAAP reconciliations
2019 CAPITAL PROGRAM & 2018 RESULTS - February 13, 2019 - Zone Bourse
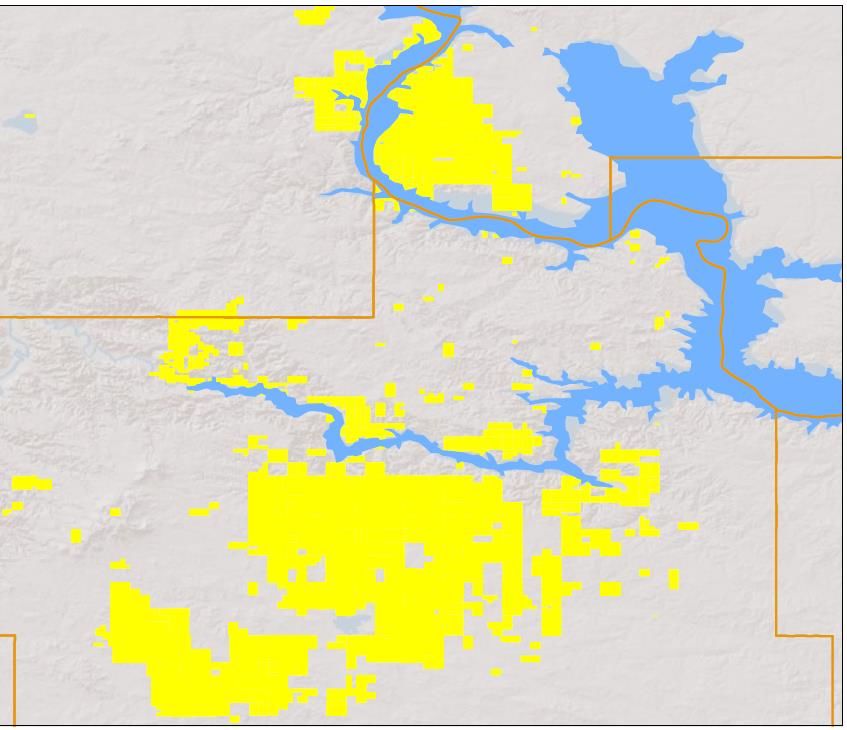
Sustainable FCF in 2019 & 2020 at Conservative Pricing
Differentiated annual FCF yield vs. E&P peers
                                                                                                                    $2.2B+
                                                                                                                  Cumulative
                                                     2,500                                                        Organic FCF     10%

                                                                                                                                        Organic FCF Yield (Annual Avg.)
                      Cumulative Organic FCF ($MM)

                                                     2,000

                                                                                         $750MM+
                                                     1,500                              Cumulative
                                                                                        Organic FCF
                                                                                                                                  5%
                                                     1,000
                                                             Organic FCF+
                                                             Above $45/bbl
                                                      500    in Both Years

                                                        0                                                                         0%
                                                                2019–- 2020
                                                              2019     2020                 2019–- 2020
                                                                                          2019     2020             2019–
                                                                                                                  2019  - 2020
                                                                                                                           2020
                                                               ($45 WTI)                   ($50 WTI)               ($60 WTI)

                                                               Organic FCF                          Organic FCF Yield (Annual Avg.)
    *Organic FCF yield represents average annualized yield for 2019 and 2020 using MRO stock price as of 2/8/19

5
2019 CAPITAL PROGRAM & 2018 RESULTS - February 13, 2019 - Zone Bourse
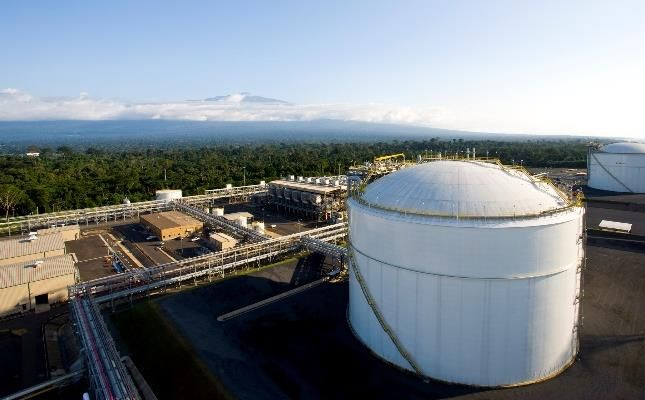
Differentiated Execution Led the Way in 2018
Underpins confidence in 2019 delivery

                                     Initial Guidance                Actual Delivery
            2018 Objectives
                                          @$50/bbl WTI                    @$65/bbl WTI

           Capital Discipline     $2.3B development capital        $2.3B development capital

                                   30% CROIC improvement           78% CROIC improvement
          Corporate Returns
                                  10% CFPDAS improvement           65% CFPDAS improvement

                                  Organic FCF positive, post-      $865MM of post-dividend,
            Free Cash Flow        dividend, above $50/bbl WTI           organic FCF

                                  Prioritize incremental return,
                                                                   $700MM of share buybacks
           Return of Capital        above dividend, through
                                                                     and $170MM dividend
                                    sustainable organic FCF

                                     18% total oil growth at
                                                                      24% total oil growth,
                                      midpoint, divestiture
          Capital Efficient Oil            adjusted
                                                                      divestiture adjusted
                Growth              22.5% resource play oil          32% resource play oil
                                      growth at midpoint                   growth

6
2019 CAPITAL PROGRAM & 2018 RESULTS - February 13, 2019 - Zone Bourse
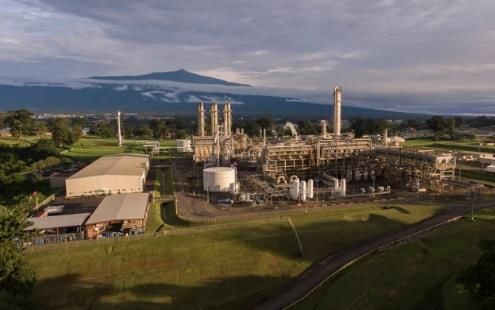
2019 Capital Program Overview
Focused program balances corporate returns with strategic objectives
    • Total capital program of $2.6B, down from 2018                 Focused Investment
      – Comprised of $2.4B development capital and $200MM
        of resource play leasing and exploration (REx) capital
                                                                             Resource Play
      – Planning basis of $50/bbl WTI; organic free cash flow                Development
        positive above $45/bbl WTI, post-dividend                    Other
                                                                     REx
    • Over 95% of development capital allocated to U.S.
      resource plays
      – ~60% of resource play capital allocated to Eagle Ford
        and Bakken with ~40% to Oklahoma and Northern
        Delaware, similar to 2018                                      Resource Play
      – Capital efficient oil growth on flat wells to sales drives    Capital Allocation
        corporate returns improvement
      – Development capital continues to fund organic                   Northern
        resource base enhancement initiatives                                         Eagle Ford
                                                                        Delaware

    • Year-over-year reduction in REx capital reflects more
      ratable forward spending profile                                 Oklahoma
      – Continues progression of LA Austin Chalk and other                            Bakken
        emerging opportunities with focus on full cycle returns

7
2019 CAPITAL PROGRAM & 2018 RESULTS - February 13, 2019 - Zone Bourse
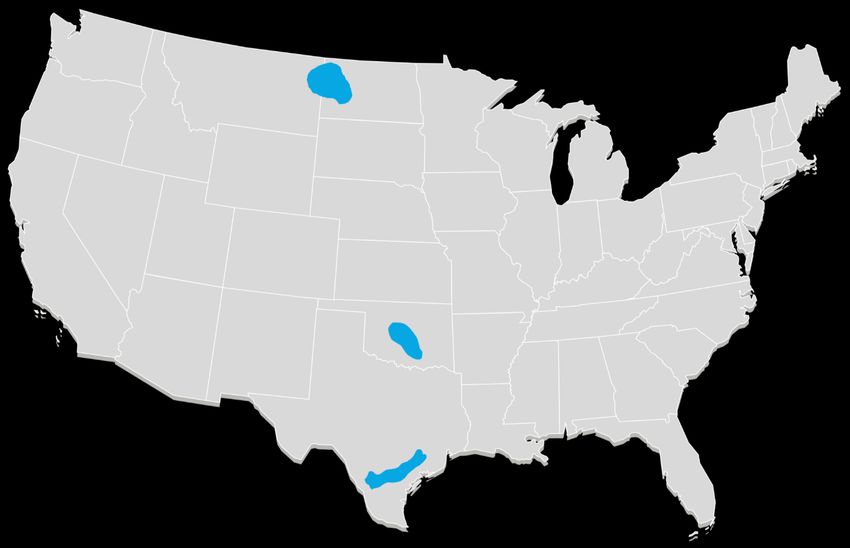
2019 Basin Level Highlights and Objectives
    Competitively advantaged multi-basin model

                      Appraise / Delineate     Early Development               Full Field Development

                  Bakken
                                                                               Oklahoma
•   85 - 95 gross operated wells to sales
•   90% Myrmidon and Core Hector                               • 55 - 60 gross operated wells to sales
•   Continue organic enhancement initiatives                   • Development focus on overpressured
                                                                 STACK and SCOOP; 95% pad drilling
•   Returns, free cash flow, oil growth
                                                               • Secondary target delineation
                                                               • Predictability and competitive returns

           Northern Delaware                                                   Eagle Ford
• 55 - 60 gross operated wells to sales
                                                               • 125 - 135 gross operated wells to sales
• Focus on Malaga Upper Wolfcamp and
  Red Hills delineation                                        • 90% Karnes and Core Atascosa
• Transition to multi-well pads                                • Continue organic enhancement initiatives
• Returns, oil growth, and margin                              • Progress multi-well Phase 2 enhanced oil
  enhancement                                                    recovery (EOR) pilot
                                                               • Returns and free cash flow

    8
2019 CAPITAL PROGRAM & 2018 RESULTS - February 13, 2019 - Zone Bourse
2018 Highlights

    Full-year 2018 Highlights
    •   Delivered capital discipline, corporate returns improvement, free cash flow generation, and
        enhanced return of capital to shareholders
    •   Drove capital efficiency improvement leading to high margin oil growth outperformance
    •   Enhanced resource base through core extension tests in Eagle Ford and Bakken; progressed
        REx program with focus on full-cycle returns
    •   125% reserve replacement at 60% above type curve at 45 days; positive Springer
             delineation well
        −    Northern Delaware: 4 Upper Wolfcamp wells avg. IP 30 of 340 BOED/1,000 ft. lateral
             (74% oil)

9
2019 CAPITAL PROGRAM & 2018 RESULTS - February 13, 2019 - Zone Bourse
Total Company Cash Flow for 2018
Generated ~$865MM of organic free cash flow at avg. WTI of $65/bbl
• $2.3B annual development capital budget unchanged throughout year
• $700MM of stock buy-backs and ~$170MM of annual dividend; over 25% of operating cash flow
  returned to shareholders in 2018
• $369MM REx Capex more than fully funded by disposition proceeds
      4,000

      3,500

      3,000

                                                    2,286
      2,500
$MM

                                  3,245
      2,000

      1,500                                                                               78
                                                                                                                            369                                                51
                                                                        169
      1,000                                                                                                                                                   1,151
                                                                                                         1,431                                700                                        1,462
       500
                   563
         0
              1/1/18 Cash       Operating Development Dividends                       EG LNG             Cash           REx Capex        Share Buy- Acquisitions              Total      12/31/18
                Balance         Cash Flow   Capital                                   Return of         Balance                            Back          &                   Working      Cash
                                 b/f WC 1 Expenditures                                 Capital          b/f A&D,                                    Disposal of              Capital 3   Balance
                                                                                                                                                                2
                                                                                       & Other           REx &                                      Assets (Net)
                                                                                                       Financing

          1 Excludes $34MM of exploration costs other than well costs
          2 Acquisitionand Disposal of Assets includes $105MM BLM lease costs, Libya disposition & OSM final payment
          3Total working capital includes $17MM and $(68)MM of working capital changes associated with operating activities and investing activities, respectively & other
10
          See the 4Q 2018 Investor Packet at www.Marathonoil.com for non-GAAP reconciliations
Standout Year for Eagle Ford on All Fronts
Year-over-year growth on fewer wells to sales
 Production Volumes and Wells to Sales                                                                                         Full-year 2018 Highlights
                                   120                                                        60
                                                                                                                               • 2018 oil production growth of 7% on 5% fewer

                                                                                                     Operated Wells to Sales
                                                                                                                                 gross operated wells to sales (WTS)
                                    80                                                        40
                                                                                                                               • 40 Atascosa wells achieved avg. IP 30 of 1,510
      MBOED

                                    40                                                        20
                                                                                                                                 BOED (72% oil), demonstrating strength of
                                                                                                                                 extended core
                                     0                                                        0                                • Compelling returns, significant free cash flow
                                             1Q18         2Q18          3Q18         4Q18
                                                                                                                                 generation, improved well productivity
                                             Production          Gross Wells          Net WI Wells
                                                                                                                                 – 180-day cumulative production up 10% vs. 2017 and
 Well Performance History                                                                                                          up 45% vs. 2016
     Avg. Cum. Production (MBOE)

                                                                                              2018                             4Q 2018 Highlights
                                   150                                                        2017
                                                                                                                               • Production averaged 107 net MBOED, up 2%
                                                                                              2016
                                   100                                                        2015                               from year-ago quarter
                                                                                                                               • 38 WTS with avg. IP 30 of 1,810 BOED (72% oil)
                                    50
                                                                                                                               • Completion stages per day up over 10% and
                                     0
                                                                                                                                 avg. CWC per lateral foot down over 15% vs.
                                         0          45           90            135          180                                  year-ago quarter
                                                                 Days

            Well performance history composed of MRO operated wells across all formations

11
Strong Well Productivity from the Eagle Ford Core
4Q 2018 wells driving robust corporate returns

                                          Jordan / Fransen / GM                    Challenger B / Medina H.      CRH / Fire Opal
                                                  5 well pad                               3 well pad                3 well pad
                                            1,550 BOED (69% oil)                     1,470 BOED (79% oil)      1,800 BOED (73% oil)
                                                 ~3,270’ LL                               ~5,230’ LL                ~5,500’ LL

                                                                                            Wilson                                       Medina-Jonas
                                                                                                                                            6 well pad
                                                                                                                                      1,940 BOED (83% oil)
                                                                                                                                           ~6,750’ LL

                                                                                                                                      Brown D. / Holland B.
                                                                             Atascosa                         Karnes                        6 well pad
     San Christoval Ranch                                                                                                             2,070 BOED (74% oil)
           3 well pad
                                                                                                                                           ~6,010’ LL
     1,640 BOED (48% oil)
          ~3,310’ LL
                                                                                                                                           Luna / May
                                                                                                                                            4 well pad
         Guajillo East                                                                                                                1,480 BOED (56% oil)
           5 well pad                                                                                                                      ~5,750’ LL
     1,480 BOED (82% oil)
          ~5,960’ LL                                                                                                                        Kowalik
                                                                                                                                            3 well pad
                                                                                                                     Bee              2,940 BOED (68% oil)
                                           4Q18 Pads                                                                                       ~8,950’ LL
                                           to Sales                                  Live Oak

      IPs shown are 30-day (includes oil, NGL and gas) and represent pad average

12
Bakken Performance Consistently Enhancing Value
Successful core extension tests in Ajax, Southern Hector, and Elk Creek
 Production Volumes and Wells to Sales                                                                         Full-year 2018 Highlights
              100                                                            30
                                                                                                               • Capital efficient oil production growth of 53%

                                                                                     Operated Wells to Sales
               80
                                                                             20                                • 20 Northern Hector wells achieved avg. IP 30 of
               60
     MBOED

                                                                                                                 2,390 BOED (78% oil), demonstrating strength of
               40
                                                                             10                                  extended core
               20
                                                                                                               4Q 2018 Highlights
                0                                                            0
                        1Q18             2Q18         3Q18        4Q18                                         • Production averaged 94 net MBOED, up 37%
                        Production              Gross Wells      Net WI Wells                                    from year-ago quarter
 ~50% Y/Y Capital Efficiency Improvement                                                                       • 27 WTS avg. IP 30 of 3,335 BOED (76% oil)
             3,000                                                           $8                                • Ajax four-well pad extension test achieved avg. IP
                           +15%                                                                                  30 of 2,370 BOED (81% oil) at ~$5MM CWC
             2,500                                                           $7
                                                                                  CWC ($MM)

                                                                                                               • Avg. IP 30 up 15% with CWC down 24% vs. year-
     BOED

             2,000                                                           $6
                                                               -24%                                              ago quarter
             1,500                                                           $5                                  – 8 wells achieved sub $5MM CWC with avg. IP 30 of
                                                                                                                   2,850 BOED (76% oil)
             1,000                                                           $4
                       4Q17          4Q18               4Q17          4Q18                                       – Completion stages per day up over 65% from year-
                                                                                                                   ago quarter
                         IP 30 BOED*                         CWC ($MM)

         * IP 30 rates normalized to 9500’.

13
Leading Williston Basin Well Productivity
Delivered 45 of the top 50 all-time Middle Bakken & Three Forks oil wells
                                                                                                                                                                                 Irish Pad
 Historic Middle Bakken Well Performance
                                                                                                                            Julia Jones Pad                                        3 wells
                          4,000                                                                                                    5 wells                                      3,140 BOED
                                                                                                                                4,250 BOED                                        (74% oil)
                          3,500                                                                                                   (75% oil)
 30-day IP (BOPD)

                          3,000
                                                                                                                                                                         Axell, Nugget & Ness Pads
                          2,500                                                                                                                               Myrmidon
                                                                                                                                 Clara Pad                                         9 wells
                          2,000                                                                                                                                                 3,450 BOED
                                                                                                                                   4 wells
                          1,500                                                                                                 3,510 BOED                                        (74% oil)
                          1,000                                                                                                   (73% oil)

                            500
                                                                                                                                                McKenzie
                               0
                                        MRO 2018                MRO 2017               Peers
                                                                                                                                              Elk Creek

 Historic Three Forks Well Performance

                          5,000
                          4,500                                                                                                                                                 Ringer Pad
                                                                                                                                                     Hector                        2 wells
     30-day IP (BOPD)

                          4,000                                                                                                       Dunn
                          3,500                                                                                                                                                 2,385 BOED
                                                                                                                                                                                  (84% oil)
                          3,000
                          2,500
                          2,000
                                                                                                                                                                                Gloria Pad
                          1,500
                                                                                                                                                                                   4 wells
                          1,000
                                                                                                                                                                                2,370 BOED
                            500                                                                                                                                                   (81% oil)
                                                                                                                               Q4 2018        Ajax
                              0
                                                                                                                               to Sales
                                       MRO 2018                  Peers

                        IPs shown in map are 30-day (includes oil, NGL and gas) and represent pad average
                        Source: Drilling info, competitor presentations and internal data. External data available through 4Q 2018.
14
Enhanced Returns & Predictability Continue in Oklahoma
SCOOP infills outperforming type curve
 Production Volumes and Wells to Sales                                                                         Full-year 2018 Highlights
             100                                                                20
                                                                                                               • Successful transition to infill development in

                                                                                     Operated Wells to Sales
              80                                                                16                               overpressured STACK and SCOOP
              60                                                                12                                – Competitive returns and predictable results at
     MBOED

                                                                                                                    various spacing designs
              40                                                                8
                                                                                                               • Completion cost per lateral ft. down >30%
              20                                                                4                                from prior year
               0                                                                0
                       1Q18               2Q18          3Q18        4Q18                                       4Q 2018 Highlights
                        Production               Gross Wells         Net WI Wells                              • 67 net MBOED production, up 4% from
                                                                                                                 year-ago quarter
 3R SCOOP Infill >60% Above Type Curve at 45 Days                                                              • 8 well per section 3R SCOOP Woodford
                              Type Curve
                                                                                                                 infill delivered avg. IP 30 of 2,600 BOED
             160              Lightner Wells - 4 wells on 8 wps                                                  (69% liquids)
                              3R Wells - 8 wps
                                                                                                                  – CWC/lateral ft. ~35% below most recent
             120                                                                                                    SCOOP Woodford infill (Lightner)
     MBOED

              80                                                                                                  – Springer delineation well on same pad delivers
                                                                                                                    IP 30 of 1,825 BOED (81% oil)
              40
                                                                                                               • Completion stages per day up 55% from
              0
                                                                                                                 year-ago quarter
                   0         15            30           45     60          75
                                                 Days
        wps – wells per section spacing

15
Focused on Overpressured STACK and SCOOP
Multi-well development continues

                          Olive June                                       Blaine                      Kingfisher

                             Lloyd

                            Ruthie                                                         Canadian

                                                                                                                                                     Ellis
                             Calvin

                                                                               Caddo                                                                Burton

                                                                                                             Grady                                    3R
                                                                                                                                         7 Woodford infill wells (8 wps)
                                                                                                                                           2,600 BOED (69% liquids)
                                                                                                                                                  ~10,000’ LL

                                                                                                                                                 Papa Pump
                                                                                                                                          1 Springer delineation well
                                                                                                                                            1,825 BOED (81% oil)
                                                               Wet Gas           4Q18 Wells to Sales                                              ~8,480’ LL
                                                                Condensate       Upcoming Infills
                                                                Oil                                                           Stephens
     IPs shown are 30-day (includes oil, NGL and gas) and represent pad average on the 3R, and single well on the Papa Pump

16
Strategically Pacing Northern Delaware
Focus on multi-well pads while progressing delineation
 Production Volumes and Wells to Sales                                                                           Full-year 2018 Highlights
                           30                                                    25
                                                                                                                 • Risked gross company operated locations up

                                                                                       Operated Wells to Sales
                           25                                                    20                                ~20% since play entry
                           20
                                                                                                                 • Drilling ft. per day up >20% and completion
     MBOED

                                                                                 15
                           15
                                                                                 10                                stages per day up >30% vs. 2017
                           10
                                                                                 5                               • Improved midstream access for all products
                                5

                                0                                                0                               4Q 2018 Highlights
                                    1Q18         2Q18          3Q18    4Q18
                                                                                                                 • 26 net MBOED production, up 138% from
                                    Production          Gross Wells     Net WI Wells
                                                                                                                   year-ago quarter
 Capturing Significant Efficiency Gains                                                                          • 12 WTS avg. IP 30 of 1,935 BOED (49% oil),
                                                                                                                   or 360 BOED per 1,000 ft. lateral
        Completion stages/day

                                                                                                                   – 4Q activity featured successful Lower Wolfcamp
                                                                                                                     (WC) spacing test
                                                         +40%
                                                                                                                   – 4 Upper WC wells avg. IP 30 of 340 BOED per
                                                                                                                     1,000 ft lateral (74% oil)
                                                                                                                 • Executed comprehensive water handling
                                                                                                                   agreement covering Red Hills area
                                      4Q17                            4Q18                                       • Completion stages per day up 40% from year-
                                                        Stages/day                                                 ago quarter

17
International Highlights

     World Class Gas Infrastructure             Full-year 2018 Highlights
       EGLNG
     EGLNG   Plant
           Plant                                • Production of 113 net MBOED
                                                • E.G. EBITDAX of over $650MM
                                                • Reduced estimated U.K. asset retirement
                                                  obligation by $143MM

                                         Alba
                                                • Continued rigorous portfolio management
                                      Alba
                                      GasGas
                                        Plant
                                      Plant       – Closed $450MM Libya sale; received final Oil
                                                    Sands Mining payment of $750MM
                                                  – Progressing full Kurdistan exit, which will mark 9th
                                                    country exit in last 5 years

                                                4Q 2018 Highlights
      AMPCO
     AMPCO  Methanol
           Methanol   Plant
                    Plant
                                                • Production of 105 net MBOED
                                                  – 1Q19 volume guidance includes impact of E.G.
                                                    triennial turnaround
                                                • E.G. EBITDAX of $153MM

18
Framework for Success
Prioritizing Corporate Returns, FCF, Return of Capital to Shareholders
     “While many in our industry talked about capital discipline, we delivered… Through improving capital efficiency and
     unwavering discipline, we drove significant improvement to our corporate returns, delivered more oil growth, generated $865
     million of organic free cash flow post-dividend, and returned most of that cash back to our shareholders via share
     repurchases. As we turn to 2019 and beyond, we remain committed to this same framework for success.”
                                                                     - Lee Tillman, Chairman, President and CEO

         Our Framework                                    Our Delivery - 2018                     Our Plan - 2019
                                                     •    78% realized CROIC                • Multi-year CROIC
                                                          improvement                         improvement
     •   Corporate Returns
                                                     •    $865MM of organic FCF             • Organic FCF above $45/bbl
     •   FCF Generation
                                                     •    $700MM of share buybacks          • Prioritizing return of cash
     •   Return of Capital to
                                                     •    Unchanged $2.3B                   • $2.4B development capital
         Shareholders                                     development capital budget          budget

     •   Differentiated                              •    24% total company oil growth      • 10% total company oil growth
         Execution                                        vs. 18% initial guidance            & 12% U.S. oil growth

                                                     •    $369MM REx spend                  • $200MM REx budget

                                                         Our Foundation
                          •   Multi-Basin Portfolio                            • Balance Sheet Strength

19
Appendix

20
2019 Production Guidance

     FY19 Net Production                                     Oil Production (MBOPD)                    Equivalent Production (MBOED)

                                                            2019                        2018*              2019                 2018*
     United States                                       185 - 195                       169             320 - 330               295
     International                                         20 - 30                       27               90 - 100               110
     Total Net Production                                205 - 225                       196             410 - 430               405

     1Q19 Net Production                                     Oil Production (MBOPD)                    Equivalent Production (MBOED)

                                                   Q1 2019                   Q4 2018*    Q1 2018*    Q1 2019         Q4 2018*    Q1 2018*
     United States                                  175 - 185                     180          160   295 - 305         306             278
     International                                    20 - 30                      23           30    85 - 95          102             110
     Total Net Production                           195 - 215                     203          190   380 - 400         408             388

     * Divestiture-adjusted, and also excludes Atrush volumes which are held for sale

21
2019 Cost and Tax Rate Guidance

                                            Full-Year Estimate

     United States Cost Data

     Production Operating                           $4.50 – 5.50

     DD&A                                         $19.25 – 21.75

     S&H and Other*                                 $4.00 – 4.50

     International Cost Data

     Production Operating                           $4.75 – 5.75

     DD&A                                           $3.75 – 5.25

     S&H and Other*                                 $1.00 – 1.50

     Expected Tax Rates by Jurisdiction:

     United States and Corporate Tax Rate                   0%

     Equatorial Guinea Tax Rate                            25%

     United Kingdom Tax Rate                               40%

     * Excludes G&A expense

22
United States Crude Oil Derivatives
As of February 12, 2019
                                                                  Crude Oil (Benchmark to NYMEX WTI)
                                                                                            1Q 2019               2Q 2019              3Q 2019               4Q 2019               FY 2020
     Three-Way Collars
              Volume (BBLs/day)                                                              70,000                70,000                50,000               50,000                      -
     Weighted Avg Price per BBL:
              Ceiling                                                                        $71.21                $71.21                $75.88               $75.88                      -

              Floor                                                                          $55.86                $55.86                $57.80               $57.80                      -
              Sold put                                                                       $48.71                $48.71                $50.80               $50.80                      -

     Basis Swaps (a)/(b)
              Volume (BBLs/day)                                                              10,000                11,000                16,000               16,000                   15,000
              Weighted Avg Price per BBL                                                     $(0.82)               $(1.06)              $(1.53)               $(1.53)                  $(0.94)
     NYMEX Roll Basis Swaps
              Volume (BBLs/day)                                                              60,000                60,000                60,000               60,000                      -
              Weighted Avg Price per BBL                                                      $0.38                 $0.38                 $0.38                $0.38                      -

     (a) The basis differential price is between WTI Midland and WTI Cushing
     (b) Between January 1, 2019 and February 12, 2019, the Company entered into 5,000 Bbls/day of Midland basis swaps for July - December 2019 with an average price of $(2.55) and
     1,000 Bbls/day of Clearbrook basis swaps for March - December 2019 with an average price of $(3.50)
23
United States Natural Gas Derivatives
As of February 12, 2019
                                     Natural Gas (Benchmark to NYMEX HH)

                                                                            1Q19
     Three-Way Collars

         Volume (MMBtu/day)                                                200,000

     Weighted Avg Price per MMBtu:

         Ceiling                                                            $5.25

         Floor                                                              $3.43

         Sold put                                                           $2.88

24
2018 Volumes, Exploration Expense & Effective Tax Rate
Excluding Libya
                                                                1Q       2Q       3Q       4Q    Full-Year
     United States Net Sales Volumes:

     - Crude Oil and Condensate (MBD)                          164      168      173      180         171

     - Natural Gas Liquids (MBD)                                50       57       58       55          55

     - Natural Gas (MMCFD)                                     420      435      433      422         429

     - United States Total (MBOED)                             284      298      303      305         298

     International Net Sales Volumes:

     - Crude Oil and Condensate (MBD)                           35       32       27       29          32

     - Natural Gas Liquids (MBD)                                11       12       11       10          11
     - Natural Gas (MMCFD)                                     415      461      441      411         430

     - International Total (MBOED)                             115      121      112      108         114

     Total Sales Volumes (MBOED)                               399      419      415      413         412

     Total Available for Sale (MBOED)                          398      419      419      411         412

     Equity Method Investment Net Sales Volumes:

     - LNG (metric tonnes/day)                                5,541    6,141    6,152    5,384       5,805

     - Methanol (metric tonnes/day)                           1,195    1,316    1,334    1,119       1,241

     - Condensate and LPG (BOED)                             12,416   12,689   11,942   15,071      13,034

     Exploration Expenses (Pre-tax):

     - United States ($ millions)                               51       64       55       76         246

     - International ($ millions)                                1        1        1        0           3

     Consolidated Effective Tax Rate (ex. Libya) Provision      2%      31%      29%       4%         14%

25
4Q 2018 Net Sales Volumes and Realizations

     U.S. Divestiture-Adj. Sales Volumes*                                                         International Divestiture-Adj. Volumes**
                                                                                                           125
              300

                                                                                                           100

              200                                                                                          75

                                                                                                   MBOED
      MBOED

                                                   301                   305                                         117 117           112 108
                             257                                                                           50                                               102 106
              100

                                                                                                           25

                0                                                                                           0
                            4Q17                  3Q18                  4Q18                                           4Q1717
                                                                                                                      4Q                3Q3Q18
                                                                                                                                             18               4Q1818
                                                                                                                                                             4Q
                                                                                                                 Available for Sale    Sales

                          Excluding Derivatives                                                   Avg C&C
                                                                                                  Realizations         $54.03             $64.08              $58.25
     Avg C&C              $55.46                  $68.51                $56.01                    ($/BBL)***
     Realizations
     ($/BBL)              Including Derivatives

                           $54.70                 $62.81                $54.51

          *U.S. adjusted for divestitures of 5 MBOED in 4Q17 and 2 MBOED in 3Q18                     *** Adjusted the average C&C by $7.29 to exclude Libya in 4Q17
          **International available for sale volumes adjusted for divestitures/held for sale of      Cumulative underlift of (138) MBOE in E.G., and cumulative
26        37 MBOED in 4Q17, 3 MBOED in 3Q18, and 3 MBOED in 4Q18. Sales volumes                      overlift of 6 MBOE in Kurdistan and 68 MBOE in U.K.
          adjusted for divestitures/held for sale of 36 MBOED in 4Q17, 4 MBOED in 3Q18,
          and 3 MBOED in 4Q18
4Q 2018 Production Mix

      Eagle Ford       Oklahoma

      20%                    24%           Total U.S.
                                         Resource Plays
                     48%
     22%      58%
                              28%
                                         23%
                                                          Crude Oil/Condensate

                                                          NGLs
                                        18%         59%
       Bakken       Northern Delaware
                                                          Natural Gas

      6%6%
                     27%
                              54%

            88%       19%

27
2018 Capital, Investment & Exploration
Budget reconciliation $MM
                                                          2018     2018
                                                         Budget   Actual

     Cash additions to Property, Plant and Equipment              2,753

     Working Capital associated with PPE                           (68)

     Property, Plant and Equipment additions                      2,685

     M&S Inventory                                                 (6)

     REx expenditures included in capital expenditures            (388)

     Exploration costs other than well costs                       (5)

     Development Capital                                 2,300    2,286

28
You can also read