Solidification of the Blends of Fully Hydrogenated Coconut Oil and Non-hydrogenated Coconut Oil
←
→
Page content transcription
If your browser does not render page correctly, please read the page content below
PP Periodica Polytechnica                               Solidification of the Blends of Fully
          Chemical Engineering
                                                        Hydrogenated Coconut Oil and
                                                        Non-hydrogenated Coconut Oil
               62(1), pp. 123-127, 2018
     https://doi.org/10.3311/PPch.9638
      Creative Commons Attribution b                    Vinod Dhaygude1*, Anita Soós1, László Somogyi1

                      research article                  Received 21 June 2016; accepted after revision 24 January 2017

Abstract                                                                  1 Introduction
Coconut oil is one of the generally used edible fats in food                  Coconut oil is commonly used for food and industrial pur-
industries. To modify its texture, coconut oil is frequently              poses. The oil is rich in medium chain fatty acids (MCFA) and
treated by full-hydrogenation. Since full-hydrogenation results           exhibits good digestibility [11]. Coconut oil is frequently mod-
in extremely hard fat; therefore, blending with more soft mate-           ified to produce products with high economic value [14].
rial is a good option to reach the required texture. The aim of               Most natural oils and fats offer limited application in their
the present study was to establish the solidification characters          unaltered state, due to their particular fatty acid and triacyl-
of the blends containing both fully hydrogenated and non-hy-              glycerol composition [6]. According to Jang et al., oils and
drogenated coconut oils. Investigations were carried out by               fats are modified chemically by hydrogenation to improve
means of pulsed nuclear magnetic resonance spectroscopy                   their plasticity and oxidation stability properties [8]. Partially
(pNMR) and differential scanning calorimetry (DSC). Solid-                hydrogenated edible fats may contain trans fatty acid isomers
ification phenomenon was interpreted by the Avrami model.                 that are found to be nutritionally solicitous [1]. To avoid the
Based on the results, parameters of the Avrami model were cal-            presence of trans isomers, one of the possible solutions is to
culated. The results proved that these two fats are completely            use fully hydrogenated oils because they are trans-free com-
miscible and the equilibrium SFC value of their blends modi-              pounds [15]. Since full hydrogenation result in extremely hard
fied in accordance to the blending ratios and temperature gra-            texture, blending with more soft material is needed. Coconut
dient. DSC measurements did not show any significant differ-              oil, because of its long shelf life and melting point of 24.4 °C,
ence in crystallization curves of the samples. Our results may            is frequently used in the baking industry in western countries,
be utilized in food technology, especially when production of             being commonly treated by full-hydrogenation.
fat containing foods needs cooling, for example in the man-                   Melting and solidification of edible oils and fats are two of
ufacturing of margarine, shortenings, and confectionary fats.             the most important properties for functionality in many pre-
                                                                          pared food products. In general, oils and fats exhibit complex
Keywords                                                                  thermal behaviour. Many of studies have investigated proper-
Coconut Oil, pulsed Nuclear Magnetic Resonance, Differential              ties of oils and fats, the results being highly dependent on the
Scanning Calorimeter, and Avrami Model                                    detailed chemical composition and protocol in the experiments.
                                                                          The present research work was done to study the solidification
                                                                          of blends of fully hydrogenated coconut oil and non - hydroge-
                                                                          nated coconut oil. This study involves the solidification curves,
                                                                          fitted Avrami lines, Avrami parameters and thermal behaviour.

                                                                          2 Materials and methods
                                                                          2.1 Materials
                                                                             Fully hydrogenated coconut oil (FHCO) and non - hydro-
                                                                          genated coconut oil (NHCO) were provided by local industry
                                                                          from Budapest.
1
 Department of Grain and Industrial Plant Technology,
Faculty of Food Science, Szent István University,                         2.2 Blends preparation
H-1118 Budapest, Villányi út 29-43, Hungary                                  The blends were prepared in the proportions of 25:75,
*
    Corresponding author, e-mail: vinod.dhaygude05@gmail.com              50:50, 75:25 (w/w%) non-hydrogenated coconut oil: fully

Solidification Study of the Coconut Blends                                            2018 62 1                                        123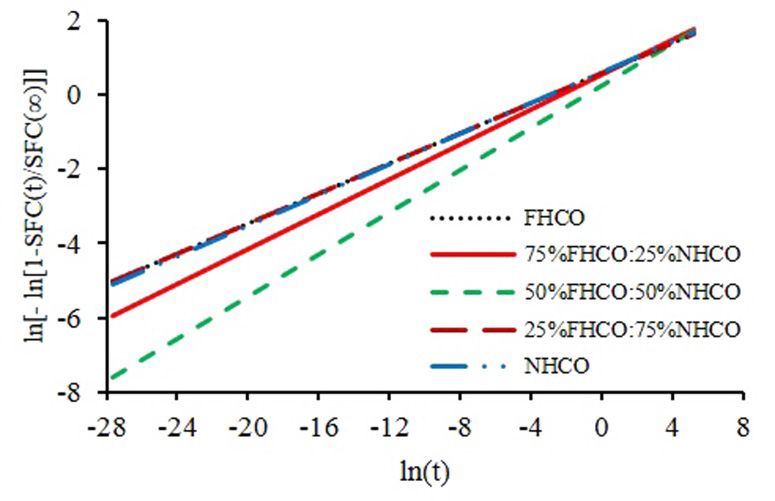
hydrogenated coconut oil. Materials were melted at 100 °C and                          The equipment used was a Perkin Elmer DSC 7 thermal analyser
homogenized for 10 min in order to destroy the crystal struc-                          coupled to a TAC 7/ DX Thermal Analysis Controller Cooler.
ture completely. All blends and pure fat samples were stored in                        The data processing software used was Pyris Series Thermal
a refrigerator at 10 °C until use.                                                     Analysis System. Samples of nearly 20 mg were loaded to the
                                                                                       middle of the aluminium pans using small spatula and hermet-
2.3 Fatty acid content                                                                 ically sealed with an empty pan serving as a reference. The
   Fatty acid methyl esters (FAMEs) were prepared by the                               analysis of blends and pure oil samples was performed between
method described in the French standard (NF T 60-233, 1977)                            the 0 to 80 °C temperature interval by 1 °C/min cooling speed.
and analysed by capillary gas chromatography (Shimadzu GC                              The following parameters were used in evaluating the results:
–2010, Barcelona, Spain) using a fused-silica capillary column                         crystallization onset temperatures (Toc), crystallization peak
(SP-2380, 30m × 0.25mm × 0.2 µm film thickness; Supelco                                temperatures (Tpc), crystallization enthalpies (ΔHc) and crys-
Inc., USA). Injector and detector temperatures were kept at                            tallization temperatures (Tfinal cryst) [4]. The thermal analysis
220 °C and 250 °C, respectively. The initial temperature of the                        was carried out in duplicate.
column was 180 °C and was programmed to increase to 250 °C
at a rate of 5 °C ̸ min. The fatty acid content of the pure fats was                   3 Results and discussion
given in relative percentage. Based on these results, the fatty                        3.1 Fatty acid composition
acid content of the blends was calculated.                                                The fatty acid composition of non-hydrogenated coconut oil
                                                                                       (NHCO), fully hydrogenated coconut oil (FHCO) and blends
2.4 Solidification curves                                                              used for the experimental study are shown in Table 1. Dayrit
   Samples were melted (100 °C ̸ 15 min) and kept in high                              reviewed that the primary fatty acid of coconut is lauric acid,
precision dry bath at 80 °C for complete destruction of their                          which is present in the range of 45-53% [7]. For the NHCO
crystal history [5]. The solid fat content increased in keeping                        the predominant fatty acids were lauric acid (45.8%), myris-
with crystallization time, which was monitored by the Nuclear                          tic acid (18.8%), palmitic acid (10.1%) and oleic acid (7.1%).
Magnetic Resonance spectrometer (NMR) Brucker pc 120                                   The FHCO was high in lauric acid (53.3%), followed by myris-
Minispec. Solid fat content (SFC) was measured as a func-                              tic acid (21.3%). The percentage of unsaturated fatty acid in
tion of time applying 70, 65 and 62 °C temperature gradients.                          NHCO was around 9% but in FHCO it was smaller. A Previous
Each sample tube was placed in the sample holder in the NMR                            research study found that coconut oil is rich in MCFA (59.7%)
equipment, with the reading compartment stabilized at 10, 15                           while deficient in PUFA (1.2%) and MUFA (6.1%) [3]. As
or 18 °C. The analyses of samples were performed in triplicate                         expected, hydrogenation had reduced the level of unsaturation
for each temperature. The data acquisition was automatic, with                         of the oils compared to the natural oils reported in literature.
measurements taken every 3 min for 180 minutes. The quanti-
fication of the crystallization kinetics was performed according                          Table 1 Fatty acid composition of non-hydrogenated coconut fat, fully
to the Avrami model. The equation (1) in this model is widely                                            hydrogenated coconut fat and its blends

used for the description of isothermal phase transformation                              Fatty acid                        FHCO: NHCO (w/w)
                                                                                                       FHCO                                          NHCO
kinetics [13, 17].                                                                       (%)                        75:25      50:50      25:75
                                                                                         C6:0          0.1          0.225      0.35       0.475      0.6
                        SFC ( t )
                                    = 1 − e − kt
                                                   n

                                                                             (1)         C8:0          1.9          3.175      4.45       5.725      7
                       SFC ( ∞ )
                                                                                         C10.0         2.7          3.4        4.1        4.8        5.5
                                                                                         C12.0         53.3         51.425     49.55      47.675     45.8
   In Eq. (1) SFC (t) denotes solid fat content (%) as time
                                                                                         C12.1         0.1          0.075      0.05       0.025      -
function, SFC (∞) is the solid fat content limit as time tends
to infinity, k is the Avrami constant (min-1), which considers                           C14.0         21.3         20.675     20.05      19.425     18.8

both nucleation and growth rate and n is the Avrami exponent,                            C16.0         10           10.025     10.05      10.075     10.1
which indicates the crystal growth mechanism [11]. The equa-                             C18.0         10           8.25       6.5        4.75       3
tion was linearized and after substituting the results of the mea-                       C18:1 trans   0.03         0.0575     0.085      0.1125     0.14
surements, linear regression analysis was performed in order to                          C18:1 cis     0.3          2          3.7        5.4        7.1
calculate the values of k and n.
                                                                                         C18:2 trans   -            0.02       0.05       0.08       0.11
                                                                                         C18:2 cis     0.1          0.5        0.9        1.3        1.7
                                                                                         C 20          0.1          0.1        0.1        0.1        0.1
2.5 Thermal analysis
   Thermal analysis of the samples was performed by differen-                            Other         0.02         0.03       0.05       0.065      0.08

tial scanning calorimetry according to AOCS method Cj 1–94.

124                                                    Period. Polytech. Chem. Eng.                                             V. Dhaygude, A. Soós, L. Somogyi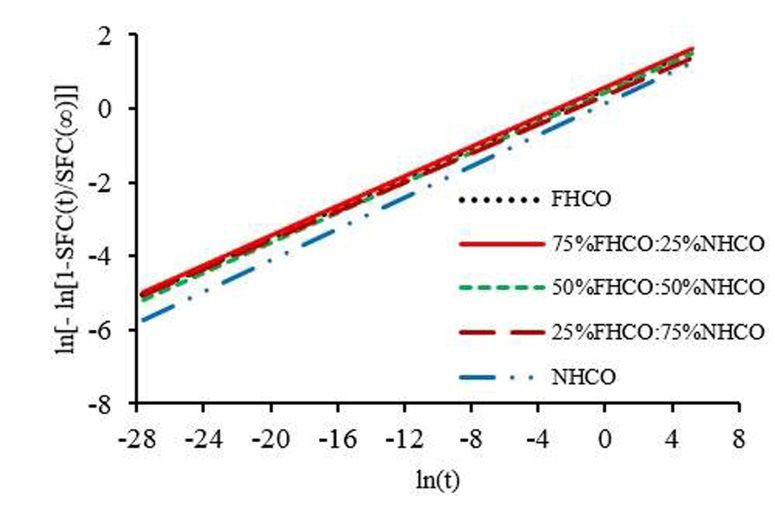
3.2 Solidification study Typical sigmoidal shaped curves were obtained, but as the
Solidification study of fats is highly important in order to concentration of fully hydrogenated fat increased the solidifi-
obtain knowledge on the kinetics of phase transformation. This cation process quickened and raised SFCmax. Ribeiro et al., also
information helps in the optimization of their usage in indus- observed a similar effect on isotherms in the blending of fully
trial processing, especially when the technology requires cool- hydrogenated soybean oil and soybean oil [14].
ing steps [18]. Crystallization kinetics deeply influences the The analysis of the curves showed that the induction time
final structure of fats and is intrinsically related to their rheo- of the crystallization decreased in parallel to increases in tem-
logical and plasticity properties. perature gradients from 62 °C to 70 °C. The equilibrium SFCmax
Fig. 1, Fig. 2 and Fig. 3 show the solidification curves at 10, values modified in accordance to the blending ratio and tem-
15 and 18 °C respectively for non-hydrogenated coconut oil, perature gradients. It seems that nucleation and crystal growth
fully hydrogenated coconut oil and for the three blends. in the non-hydrogenated coconut oil are more retarded relative
to the blended fats and FHCO. This could be a result of the
increased complexity of the mix of triglycerides in the blends.
Additionally, the examination of Fig. 1, Fig. 2 and Fig. 3 makes
it apparent that at 18 °C all evaluated samples displayed lon-
ger times to attain complete crystallization equilibrium when
compared to samples crystallized at 10 °C. The SFC curves
displayed moderate elevation of SFC values during the crys-
tallization time.
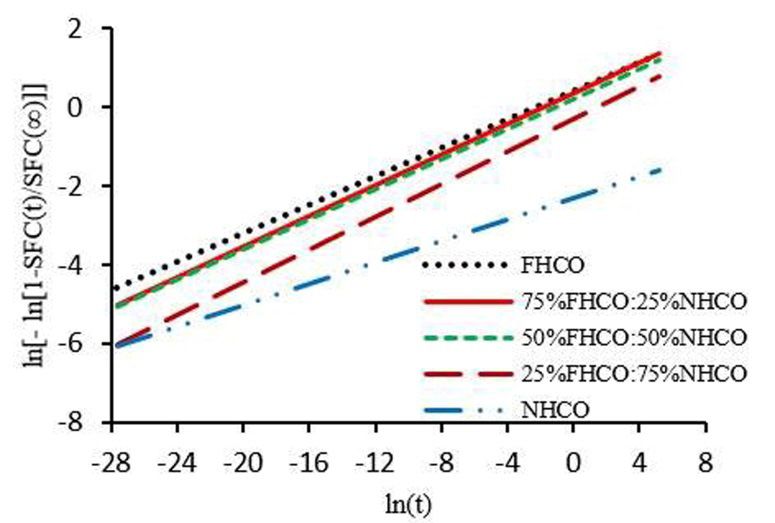
The differences in the crystallization behaviour of fat sam-
ples at different temperatures are demonstrated by the linear-
ized Avrami lines (Fig. 4, Fig. 5, Fig. 6). These straight lines
were fitted to the values of ln[- ln [1-SFC(t)/SFC(∞)]] against
Fig. 1 Solidification curve at temperature 10 °C ln(t). The parameters of the Avrami equations are summarized
in Table 2. The Avrami exponent (n), Avrami rate constant (k),
as well as the coefficient of determination (R2) are shown in
Table 2. These parameters are to be considered when outlining
the applications of fats.
The addition of FHCO to non-hydrogenated coconut oil
promoted proportional increases in the SFCmax value. Similar
results were obtained additionally in the blending of fully
hydrogenated cottonseed oil and canola oil [15].
In case of the high oleic sunflower oil study, fully hydro-
genated soybean oil (FHSBO) induced the high SFC [10].
According to Rousseau et al, the increase of crystallization
temperature promotes an effect related to formation of weaker
fat crystal networks, which are reflected directly in the solid fat
Fig. 2 Solidification curve at temperature 15 °C content [15].
Fig. 3 Solidification curve at temperature 18 °C Fig. 4 Plots of ln[-ln[1-SFC(t)/SFC(∞)]] vs ln(t) at 10 °C
Solidification Study of the Coconut Blends 2018 62 1 1253.3 Thermal study
Differential scanning calorimetry (DSC) is a thermoanalyt-
ical technique for the study of oils and fats. Fat melting is an
endothermic process in which the energy is absorbed, whereas
crystallization is an exothermic process in which the energy
is released [15]. In general, thermal behaviour of oils and fats
depends on the chemical composition and on the protocol for
the DSC experiment [20].
The crystallization curves of non-hydrogenated coconut oil
and fully hydrogenated coconut oil as well as their blends were
similar, showing only one exothermic peak between 11.11 °C
and 16.67 °C.
Fig. 5 Plots of ln[-ln[1-SFC(t)/SFC(∞)]] vs ln(t) at 15 °C
Table 3 Thermal properties of non-hydrogenated coconut fat, fully
hydrogenated coconut fat and its blends.
Max. peak
Enthalpy
Samples Temperature
(J/g)
(°C)
FHCO –82.94 16.67
75% FHCO 25% NHCO –76.28 14.32
50% NHCO 50% FHCO –67.94 11.97
25% FHCO 75% NHCO –66.82 11.55
NHCO –62.10 11.11
Table 3 shows the parameters of the crystallization curves
for the non-hydrogenated coconut oil, fully hydrogenated
Fig. 6 Plots of ln[-ln[1-SFC(t)/SFC(∞)]] vs ln(t) at 18 °C coconut oil and blends. As expected, this data showed that
peak crystallization temperature increased with the increase
in the proportion of fully hydrogenated coconut fat in non-hy-
Table 2 Avrami constant (k), Avrami exponent (n), and R2 for fat samples at drogenated coconut fat. Same results were examined in the
different temperature case of canola oil and fully hydrogenated canola oil [9]. The
Avrami Avrami crystallization enthalpy values of non-hydrogenated coconut
T
Samples constant, exponent, R2 oil and hydrogenated coconut oil were between –82.94 and
(°C)
k (min-1) n
–62.10 J/g. All parameters evaluated in relation to the crystal-
10 1.7751 0.20 0.8846 lization curves showed positive relation to full hydrogenation.
NHCO 15 1.1467 0.21 0.8570 From the results of the chemical composition of our samples
18 0.0989 0.13 0.7080 it was obvious that FHCO contained mostly saturated fatty
10 1.7391 0.23 0.9693 acids that resulted in a somewhat uniform triglyceride (TAG)
25% NHCO structure. Less TAG can form more stable crystals because the
15 1.8002 0.20 0.9034
75% FHCO
18 1.4211 0.19 0.7766
uniform TAG’s form compact crystals. This may be the reason
why equilibrium SFC is higher and crystallization is faster per
10 1.2969 0.28 0.9718
50% NHCO the amount of the FHCO in the fat mixtures. On the other hand,
15 1.5345 0.20 0.8738
50% FHCO NHCO has more unsaturated fatty acids, consequently the TAG
18 1.2079 0.19 0.8592
structure must be more complex. This complexity results in a
10 1.7906 0.20 0.9441 less-packed crystal structure and smaller equilibrium SFC, as
75% NHCO
25% FHCO
15 1.4172 0.19 0.7453 well as less slow crystallization.
18 0.7322 0.20 0.7592
10 1,8255 0.20 0.9433 4 Conclusions
FHCO 15 1.7069 0.20 0.9070 This study demonstrated the softening effect of the non - hydro-
18 1.4743 0.18 0.7703
genated coconut oil. The equilibrium SFC values were modified
in accordance to the blending ratio. It was also clear from this
126 Period. Polytech. Chem. Eng. V. Dhaygude, A. Soós, L. Somogyistudy, that the effect of temperature gradient is greater than the [10] Li, D., Adhikari, P., Shin, J. A., Lee, J. H., Kim, Y. J., Zhu, X. M., Hu, J.
effect of the mixing ratio. The DSC data showed that solidifica- N., Jin, J., Akoh, C. C., Lee, K. T. "Lipase - catalyzed interesterification
of high oleic sunflower oil and fully hydrogenated soybean oil compari-
tion of both fully-hydrogenated and non-hydrogenated coconut
son of batch and continuous reactor for production of zero trans shorten-
oil shows only one exothermic peak. This phenomenon indicates ing fats." LWT - Food Science and Technology. 43, pp. 458–464. 2010.
that the crystallization mechanism may be similar in each case. https://doi.org/10.1016/j.lwt.2009.09.013
This statement is supported by the Avrami parameters too. [11] Marina, A. M., Che Man, Y. B., Amin, I. "Virgin coconut oil: emerging
As a summary, we concluded that the presence of non-hydro- functional food oil." Trends in Food Science &Technology. 20, pp. 481-
genated coconut oil does not modify the character of the solid- 487. 2009.
https://doi.org/10.1016/j.tifs.2009.06.003.
ification process and the type of the crystals remains the same
[12] McGauley, S. E., Marangoni, A. G. "Static crystallization behavior of
regardless of the mixing ratio. As a conclusion, it can be stated cocoa butter and its relationship to network microstructure." In: Physical
that our results may help the optimization of unit operations in Properties of Lipids. Marangoni, A. G., Narine, S. S. (eds.), Chapter 4,
food technology. CRC Press, 2002.
https://doi.org/10.1201/9780203909171.ch4
References [13] Narine, S. S., Humphrey, K. L., Bouzidi, L. "Modification of the Avrami
[1] Abdullina, R. M., Voropaev, I. N., Romanenko, A. V., Chumachenko, V. model for application to the kinetics of the melt crystallization of lipids."
A., Noskov, A. S., Mashnin, A. S. "Partial Hydrogenation of Sunflower Journal of American Oil Chemists’ Society. 83, pp. 913–921. 2006.
Oil: Influence of the Process Conditions on the Physicochemical Proper- https://doi.org/10.1007/s11746-006-5046-6
ties of the Products." Russian Journal of Applied Chemistry. 85(8), pp. [14] Nugrahinia, A. D., Soerawidjaja, T. H. "Directed Interesterification of
1204−1211. 2012. Coconut Oil to Produce Structured Lipid." Agriculture and Agricultural
https://doi.org/10.1134/s1070427212080125 Science Procedia. 3, pp. 248–254. 2015.
[2] AOCS. Official methods and recommended practices of the American https://doi.org/10.1016/j.aaspro.2015.01.048
Oil Chemists’ Society. Champaign: American Oil Chemists’ Society. [15] Ribeiro, A. P. B., Grimaldi, R., Gioielli, L. A., Gonçalves, L. A. G., "Zero
2004. trans fats from soybean oil and fully hydrogenated soybean oil: Physi-
[3] Bhatnagar, A. S., Kumar P. K., Hemavathy, J., Krishna, A.G. "Fatty Acid co-chemical properties and food applications." Food Research Interna-
Composition, Oxidative Stability, and Radical Scavenging Activity of tional. 42, pp. 401–410. 2009.
Vegetable Oil Blends with Coconut Oil." Journal of the American Oil https://doi.org/10.1016/j.foodres.2009.01.012.
Chemists’ Society. 86. pp. 991–999 2009. [16] Rousseau, D., Marangoni, A. G., Jeffrey, K. R. "The influence of chem-
https://doi.org/10.1007/s11746-009-1435-y ical interesterification on the physicochemical properties of complex fat
[4] Biliaderis, C. G. "Differential scanning calorimetry in food research – A systems. 2. Morphology and polymorphism." Journal of American Oil
review." Food Chemistry. 10, pp. 239–265. 1983. Chemists’ Society. 75, pp. 1833–1839. 1998.
https://doi.org/10.1016/0308-8146(83)90081-X https://doi.org/10.1007/s11746-998-0339-6
[5] Campos, R. "Experimental methodology." In: Fat crystal networks. Ma- [17] Toro-Vazquez, J. F., Dibildox-Alvarado, E., Charó-Alonso, M.,
rangoni, A. G. (ed.) New York, Marcel Dekker, pp. 267–349, 2005 Charó-Alonso, V., Gómez-Aldapa, C. A. "The Avrami index and the frac-
https://doi.org/10.1201/9781420030549.ch9 tal dimension in vegetable oil crystallization." Journal of American Oil
[6] Chiu, M. C., Gioielli, L. A., Grimaldi. R. "Lipídios estruturados obtidos Chemists’ Society. 79, pp. 855–866. 2002.
a partir da mistura de gordura de frango, sua estearina e triacilgliceróis https://doi.org/10.1007/s11746-002-0570-y
de cadeia média. I – composiçăo em ácidos graxos e triacilgliceróis." [18] Wassel, P., Young, N. W. G. "Food applications of trans fatty acids sub-
Química Nova, 31, pp. 232–237. 2008. (in Spanish) stitutes." International Journal of Food Science and Technology. 42, pp.
https://doi.org/10.1590/S0100-40422008000200008 503–517. 2007.
[7] Dayrit, F. M. "The Properties of Lauric Acid and Their Significance in https://doi.org/10.1111/j.1365-2621.2007.01571.x
Coconut Oil." Journal of the American Oil Chemists’ Society. 92, pp. [19] Wright, A. J., Hartel, R. W., Narine, S. S., Marangoni, A. G. "The effect
1–15. 2015. of minor components on milk fat crystallization." Journal of American
https://doi.org/10.1007/s11746-014-2562-7 Oil Chemists’ Society. 77, pp. 463–475. 2000.
[8] Jang, E. S., Jung, M. Y., Min, D. B. "Hydrogenation for low trans and https://doi.org/10.1007/s11746-000-0075-8
high conjugated fatty acids." Comprehensive Reviews in Food Science [20] Tan, C. P., Che Man, Y. B. "Differential scanning calorimetric analysis of
and Food Safety. 4(1), pp. 22–30. 2005. palm, palm oil based products and coconut oil: Effects of scanning rate
https://doi.org/10.1111/j.1541-4337.2005.tb00069.x variation." Food Chemistry. 76, pp. 89–102. 2002.
[9] Jenab, E., Temelli, F., Curtis, J. M. "Lipase-catalysed interesterification https://doi.org/10.1016/S0308-8146(01)00241-2
between canola oil and fully hydrogenated canola oil in contact with su-
percritical carbon dioxide." Food Chemistry. 141. pp. 2220–2228. 2013.
https://doi.org/10.1016/j.foodchem.2013.04.079
Solidification Study of the Coconut Blends 2018 62 1 127You can also read