Development and Validation of UV Spectrophotometric Method for Estimation of Tea Tree Oil in Bulk and Cosmeceutical Creams
←
→
Page content transcription
If your browser does not render page correctly, please read the page content below
Original Article

 Development and Validation of UV
 Spectrophotometric Method for Estimation of Tea
 Tree Oil in Bulk and Cosmeceutical Creams
 Basappa Palur Manjula, Vijaya Gopalachar Joshi, Ramachandra Setty Siddam Setty,
 Muniyappa Geetha
 Department of Pharmaceutics, Government College of Pharmacy, Rajiv Gandhi University of Health Sciences,
 Bengaluru, Karnataka, INDIA.

  ABSTRACT
  Background: Tea tree oil, also known as Melaleuca alternifolia essential oil is widely used in
  skin care cosmeceuticals for its antibacterial, antifungal, analgesic and anti-inflammatory
  effect. The complex and variable composition of the oil poses many challenges to the
  analytical chemist and a recent survey of analytical methods indicated only a few simple
  and validated methods for estimation of the oil. Aim: A quality by design approach has
  therefore been adopted to develop a simple and novel UV spectrophotometric method
  for estimation of tea tree oil in bulk and cosmeceutical creams. Materials and Methods:
  UV spectrophotometric method was developed for estimation of Tea tree oil using
  dichloromethane- methanol (54 % v/v) solvent system. The method was then validated
  under optimized conditions for accuracy, precision and ruggedness, limit of detection and
  limit of quantification as per ICH: Q2 (R1) guidelines. Results: A characteristic spectral
  peak was observed at 267 nm and linearity was established over a concentration range
  of 10-160 mcg/ml with R2 value of 0.9961. Accuracy based on recovery studies,
  100.5-113.6 %, precision and ruggedness based on % RSD values less than 2 %,
  LOD, 0.1277mcg/ml and LOQ and 4.195 mcg/ml indicated that the method is sensitive
  enough to be used for routine estimation. Conclusion: The method is robust and has been
  used to determine the essential oil content of two cosmeceutical creams.
  Key words: Tea tree oil, UV spectrophotometry, Box Behnken design, Optimization,                          Submission Date: 23-06-2020;
  Routine determination, Cosmeceutical cream.                                                               Revision Date: 08-10-2020;
                                                                                                            Accepted Date: 03-01-2021

INTRODUCTION                                                                                                DOI: 10.5530/ijper.55.1s.61
                                                                                                            Correspondence:
TTO, an essential oil obtained by steam                 by γ-terpinene (14% -28%), α-terpinene              Mrs. Basappa Palur
distillation of aerial parts of Melaleuca               (6%-12%) and 1, 8-cineole also known                Manjula
                                                                                                            Department of
alternifolia is widely used in skin care                as eucalyptol (≤15%), all of which have             Pharmaceutics, Government
cosmeceuticals for its antibacterial,                   potential antimicrobial activity.2 The physical     College of Pharmacy,
                                                                                                            Rajiv Gandhi University
antifungal, analgesic and anti-inflammatory             and chemical properties specified in the            of Health Sciences,
effect.1 TTO is included in European                    document published by the Health Canada             Bengaluru-560027,
                                                                                                            Karnataka, INDIA.
Pharmacopoeia, Merck Index and in Indian                Pest Management Regulatory Agency                   Phone no: +91-080-
Pharmacopoeia Addendum 2016. The                        states that the oil is not expected to show         9449046511
chemical composition of tea tree oil is                                                                     Email id: karthikamogh@
                                                        a λmax beyond 300nm. Hence the obtained             gmail.com
defined by international standard ISO 4730:
                                                        λmax at 267nm cannot be attributed to any
2017 and the identical Australian standard
AS 2782-2017 which specifies levels for 15              particular constituent and the oil used in the
of more than 113 components found in the                study conforms to the limits mentioned in
pure oil including physical parameters like             ISO4730:2017 and AS 2782:2017 standards.
relative density, refractive index and optical          The complex and variable composition
rotation. Terpinen-4-ol is the principal                of TTO poses many challenges to the
                                                                                                                  www.ijper.org
constituent of the oil (35%- 48%) followed              analytical chemist and as indicated from a
Indian Journal of Pharmaceutical Education and Research | Vol 55 | Issue 1 [Suppl] | Jan-Mar, 2021                               S285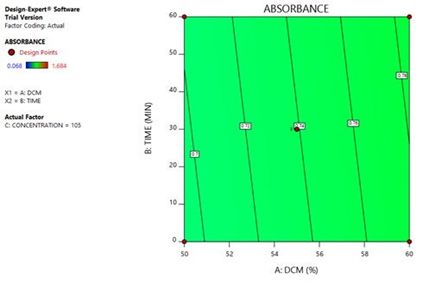
Manjula, et al.: UV Spectrophotometric Estimation of Tea Tree Oil in Bulk and Cosmeceutical Creams

literature survey, only a few simple validated methods for               The solubility of TTO was tested using various solvents
estimation of the oil have been reported. However, UV                    such as n-hexane, cyclohexane, toluene, DCM and Me
spectrophotometric method for analysis of TTO has not                    OH; binary solvent systems like chloroform-methanol
been reported till date. Biju SS et al. 2005 has reported                (2:1v/v) and DCM-Me OH (3:2v/v) were also chosen
a validated HPTLC method for determination of TTO                        for the study. DCM-Me OH (3:2v/v) was found to be
content of cosmeceutical formulations by estimating                      suitable for carrying out analytical work.
the principal constituent, terpinen-4-ol.3 Likewise Sonia
                                                                         Preparation of standard solution of TTO
K and Anupama D. 2011 have determined the terpinen-
4-ol content for 5% TTO micro emulsion.4 Gulati N                        0.025g TTO was weighed accurately into a 25ml
et al. 2012 developed a gas chromatographic method                       volumetric flask, dissolved using DCM-Me OH (3:2v/v)
using flame ionization detector for assay of α-pinene                    solvent system and volume made up to the mark using
in TTO formulations.5 Venugopal V. 2016 has analysed                     the same. The concentration of the resulting solution
ethosomes loaded with TTO for oil content by HPTLC                       was 1.0mg/ml of TTO.
method using terpinen-4-ol as reference standard.6 An                    UV spectrum of TTO standard solution
in–house validated reverse phase HPLC method was                         Standard solution of TTO was used for a spectral scan
developed to determine the eucalyptol content of TTO                     of TTO between 400-250nm using the solvent system
in bulk and cosmeceutical formulations since higher                      as blank.
levels of eucalyptol, a putative skin irritant is generally
associated with lower levels of terpinen-4-ol, the main                  Preparation of calibration curve of TTO
antimicrobial component of the oil.2,7 Estimation of                     Aliquots of 0.1, 0.2, 0.3, 0.4, 0.5, 0.6, 0.7, 0.8, 0.9,
eucalyptol content may throw some light on the safety                    1.0, 1.1, 1.2, 1.3, 1.4, 1.5 and 1.6 ml of standard TTO
and dermal irritancy of the pure oil as well as TTO                      solution were transferred into separate 10 ml volumetric
based cosmeceuticals.8                                                   flasks and the volume made up with the solvent system.
In spite of all these developments, there is still an absolute           The absorbance of the resulting solutions was read at
need for a simple and robust UV spectrophotometric                       267 nm against a solvent blank.
method suitable for routine determination of TTO                         Analytical method development based on design
in bulk and cosmeceutical formulations. The present                      of experiments
research is an attempt in this direction. As described
                                                                         Design expert software trial version 11 was chosen for
earlier, the method has as an advantage that there is
                                                                         analytical method development. Box-Behnken design
no need for the use of a standard or a specific marker
                                                                         was most appropriate for the study. Factors chosen were
compound since TTO complies with the specifications.
                                                                         percentage of dichloromethane, time of measurement
                                                                         of absorbance and concentration range corresponding
MATERIALS                                                                to A, B and C respectively. Factors and their coded levels
Tea tree oil was purchased from Messrs. Falcon Essential                 are summarized in Table 2.
Oils, Bengaluru. Dichloromethane (SD Fine Chem)
extra pure and methanol (Qualigens) HPLC grade were                            Table 1: Description of cosmeceutical creams.
used for method development. DXN Tea Tree Cream                               DXN Tea Tree Cream              Healthvit Bath and Body Tea
                                                                                                                      Tree Cream
(DXN Cream) and Healthvit Bath and Body Tea Tree
                                                                                  Net weight:30g                       Net weight:50g
Cream (HVT Cream) were purchased online from
                                                                               Ingredients: Tea tree            Ingredients: Tea tree oil, light
Amazon.in. Product information of the cosmeceutical
                                                                              oil, camphor, menthol,               liquid paraffin, white soft
creams are given in Table 1.                                                cetomacrogol, emulsifying            paraffin, cetostearyl alcohol,
                                                                                     wax, water                stearic acid, glycerin, phenoxy
Instruments                                                                                                     ethanol, perfume, tartrazine,
Shimadzu UV 1800 Spectrophotometer and Shimadzu                                                               sunset yellow, brilliant blue, light
                                                                                                                    green, amaranth, water
analytical balance were used for the study.
                                                                                 Batch No:71C009                   Batch No:WCHV0132
                                                                               Best before:02/2020                  Expiry date:01/2019
METHODS                                                                       Registration Certificate              Mfg Lic No: GC/974
                                                                                No:COS-778/15
Screening Study
                                                                                 Mfg by: DXN                       Mfg by: West Coast
Preliminary studies were carried out to identify a suitable                 Pharmaceutical, Malaysia.           Pharmaceutical Works Ltd,
                                                                                                                   Gota, Ahmedabad.
solvent system for preparing standard solution of TTO.
S286                                  Indian Journal of Pharmaceutical Education and Research | Vol 55 | Issue 1 [Suppl] | Jan-Mar, 2021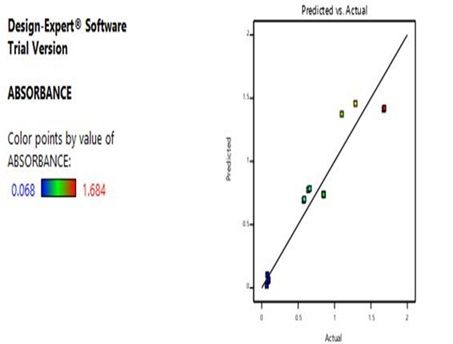
Manjula, et al.: UV Spectrophotometric Estimation of Tea Tree Oil in Bulk and Cosmeceutical Creams

                                              Table 2: Factors and their coded levels.
   Factor              Name                 Units        Type        Minimum         Maximum       Coded        Coded High      Mean        Std.
                                                                                                    Low                                     Dev.
      A                 DCM                   %        Numeric          50.0           60.0       -1 ↔ 50.0      +1 ↔ 60.0      55.0        3.78
      B                 TIME                 min       Numeric          0.0            60.0       -1 ↔ 0.0       +1 ↔ 60.0      30.0        22.68
      C          CONCENTRATION             mcg/ml      Numeric          10.0          200.0       -1 ↔ 10.0      +1 ↔ 200.0     105.0       71.81

The design suggested 15 runs and the response chosen                           Table 3: Runs suggested by Box -Behnken design.
was measurement of absorbance at 267nm, details of
                                                                               Std     Run       Factor        Factor 2          Factor 3
which are summarized in Table 3.                                                                    1        B:Time (min)     C:Concentration
All the runs were performed in triplicate and average                                            A: DCM                           mcg/ml
values of the response was analysed by ANOVA at                                                     %
0.05 level. F-test was used to assess each parameter and                       15        1          55            30               105
response by subjecting it to multiple regression analysis to                   12        2          55            60               200
generate polynomial equations. Numerical optimization                          11        3          55             0               200
as well as graphical optimization was carried out to                           2         4          60             0               105
arrive at the selected solution. The analysis of the oil
                                                                               9         5          55             0                   10
was carried out for the selected solution and observed
responses were compared with predicted responses.                              4         6          60            60               105
                                                                               8         7          60            30               200
Validation of the method under                          optimized
conditions as per ICH guidelines                                               5         8          50            30                   10
                                                                               10        9          55            60                   10
The method was then validated as per ICH guidelines
for accuracy, precision, linearity, LOD, LOQ for the                           6        10          60            30                   10

method under optimized conditions.                                             3        11          50            60               105
Accuracy of the method was carried out by adding                               1        12          50             0               105
known amount of standard solution, 80%, 100%                                   13       13          55            30               105
and 120% to a fixed concentration of oil and then                              7        14          50            30               200
determining the percent recovery.
                                                                               14       15          55            30               105
The precision of the method was established at
two levels- repeatability and intermediate precision
or ruggedness. Repeatability was based on intraday                         are done for the three independent variables (factors)
measurements at different times of the day and                             viz. percentage of dichloromethane and time of
ruggedness by using different instruments and inter-day                    measurement and concentration of TTO.
measurements for three consecutive days respectively.
                                                                           Determination of TTO content in cosmeceutical
Linearity represents the concentration range for which
                                                                           cream
a linear relation exists between concentration and the
response. This was confirmed from the equation of best                     0.5g of the cosmeceutical cream was weighed accurately
fit and R2 value, a statistical measure of goodness of fit.                into a 50 ml volumetric flask and dissolved in the
An R2 value> 0.99 is desirable for establishing linearity.                 solvent system comprising of 54% v/v DCM in Me
           LOD and LOQ were determined from                                OH. 1.0ml of the solution was transferred into a 10ml
standard deviation of the response at low concentration                    volumetric flask and diluted to the mark with the
and slope of the calibration curve.                                        same solvent system. The absorbance of the resulting
         LOD = 3.3 σ/Slope                                                 solution was read at 267 nm. All determinations were
         LOQ = 10 σ/Slope                                                  done in triplicate and average absorbance was used for
         Where: σ = the standard deviation of the                          calculating the content of TTO.
response at low concentration.                                                      TTO content of the cream was calculated using
Robustness is a measure of the resistance of accuracy                      the following formula:
and precision of the method to small variations in                         TTO Content %w/v = Absorbance x dilution factor
the method. A robust method has been developed by                          x100 / (0.5 x 10⁶)
carrying out optimization by which deliberate changes                       Where dilution factor = 500
Indian Journal of Pharmaceutical Education and Research | Vol 55 | Issue 1 [Suppl] | Jan-Mar, 2021                                          S287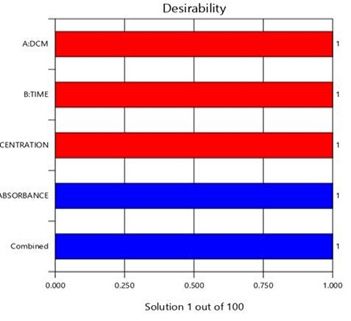
Manjula, et al.: UV Spectrophotometric Estimation of Tea Tree Oil in Bulk and Cosmeceutical Creams
RESULTS AND DISCUSSION linearity. Accordingly three factors which could affect
The composition of TTO is governed by ISO the response viz. absorbance at 267 nm were identified as
4730:2017. TTO is known to contain more than 113 percentage composition of DCM in the solvent system,
components of which minimum and maximum levels of time of measurement of absorbance and concentration
occurrence in the pure oil are specified for 15 different of TTO.
components. Few important constituents and their The next stage of development began with selection of
minimum and maximum concentrations are indicated in a design using Design Expert software, Version 11. Box
the chromatographic profile of the oil. Terpinen-4-ol is Behnken design, a response surface design was chosen
the principal constituent of the oil (35%- 48%) followed for the study since it is most suitable for determining
by γ-Terpinene (14% -28%) and α-Terpinene (6%-12%) the best factor settings or operating conditions for
and 1, 8-Cineole or eucalyptol (traces -15%).9 Hence an optimizing the response and to develop a polynomial
attempt has been made to develop a simple and robust model with less number of runs or experiments.
UV spectrophotometric method for determination of Box Behnken design was generated using three factors
TTO, based on sound principles of statistical design A, B and C corresponding to percentage of DCM, time
of experiments and validate the method as per ICH of measurement and concentration of TTO respectively
guidelines. and their minimum and maximum levels were fixed as
Preliminary studies were carried out to identify a suitable shown in the Table 2. Absorbance at 267 nm was chosen
solvent system for preparing standard solution of as the response. The design generated 15 runs which
TTO. The oil was found to be miscible with less than were performed and the response was measured in
two volumes of 85 % v/v ethanol at 20°C as per the triplicate. The response was then analysed and optimized
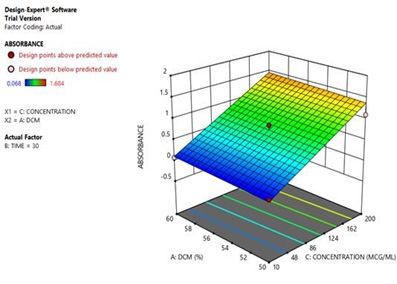
specifications provided by the supplier. However the by numerical and graphical method (Figure 2-4).
solubility of TTO was tested using various solvents such
Optimization of response (absorbance at 267 nm)
as n-hexane, cyclohexane, toluene, dichloromethane
and methanol; binary solvent systems like chloroform- A linear factorial model was used for the analysis of
methanol (2:1v/v) and dichloromethane–methanol response, the model F-value (p-value) of 38.92(0.0001)
(3:2v/v) were also chosen for the study. This was done implies the model is significant. There is only a 0.01%
with an intention of finding a common solvent for both chance that an F-value this large could occur due to
TTO and Neem seed oil since simultaneous estimation noise. P-values less than 0.0500 indicate model terms are
of both oils by UV spectrophotometry was planned as significant. In this case C (concentration) is a significant
part of an extended work. Dichloromethane - methanol model term. Values greater than 0.1000 indicate the
(3:2v/v) was found to be suitable for carrying out model terms are not significant. The lack of fit F-value
analytical work since both the oils were miscible with of 0.0386 implies the lack of fit is not significant relative
this solvent system. A spectral scan from 400-250 nm to the pure error (Table 4). Non-significant lack of fit
was obtained for standard solution of TTO which is good - we want the model to fit. The predicted R² of
exhibited a sharp peak at 267nm (Figure 1). 0.8247 is in reasonable agreement with the adjusted R²
Preliminary screening studies were carried out to identify of 0.8904; i.e. the difference is less than 0.2. Adequate
the factors which could affect the method and also to Precision measures the signal to noise ratio. A ratio
ascertain the concentration range for establishing the greater than 4 is desirable. A ratio of 15.675 indicates
Table 4: ANOVA for Linear model.
Source Sum of Squares df Mean Square F-value p-value
Model 3.69 3 1.23 38.92 < 0.0001*
A-DCM 0.0139 1 0.0139 0.4390 0.5212 NS
B-TIME 0.0002 1 0.0002 0.0060 0.9395 NS
C-CONCENTRATION 3.67 1 3.67 116.31 < 0.0001*
Residual 0.3473 11 0.0316
Lack of Fit 0.3473 9 0.0386
Pure Error 0.0000 2 0.0000
Cor Total 4.03 14
*-significant NS-not significant
S288 Indian Journal of Pharmaceutical Education and Research | Vol 55 | Issue 1 [Suppl] | Jan-Mar, 2021Manjula, et al.: UV Spectrophotometric Estimation of Tea Tree Oil in Bulk and Cosmeceutical Creams
Figure 3: Contour plot of absorbance.
Figure 1: UV spectrum of TTO.
Figure 4: Predicted vs Actual values of response.
Table 6: Predicted and actual values of response for
60 mcg/ml of TTO.
Figure 2: Response surface graph of absorbance.
Response Predicted value Actual value
Absorbance at 267 nm 0.409 0.404
Table 5: Optimized conditions for estimation.
Response DCM % Time Concentration
(min) mcg/ml)
indicated the suitability of the method for estimation
Absorbance at 267 54 5 min 60
of TTO
nm Desirability approach was used to optimize the response,
desirability value (di) for all factors and responses was
an adequate signal. Hence the model can be used to found to be 1. The optimized conditions of the method
have a desirability of 1, which indicates that the response
navigate the design space.
is also optimum (Figure 5) (Table 5 and 6).
Absorbance = 0.472566 + 0.008325* DCM + 0.000163*
The optimized conditions indicated for analysis of
Time + 0.007132 *Concentration.... (Eqn5) response are 54% DCM and time of measurement 5
The above equation clearly indicates that all the three min. These conditions were maintained for validating
factors viz. DCM, time and concentration have a the method as per ICH guidelines for accuracy,
positive impact on absorbance. precision (repeatability, intermediate precision and
ruggedness), concentration range and linearity, LOD
Analysis of TTO under optimized conditions
and LOQ. The method showed linearity in the range of
The predicted versus actual value of the response was 10-160mcg/ml with R2 value of 0.9961 (Figure 6). LOD
found to be in close agreement with each other which and LOQ values of 0.1277 mcg/ml and 4.195 mcg/ml
Indian Journal of Pharmaceutical Education and Research | Vol 55 | Issue 1 [Suppl] | Jan-Mar, 2021 S289Manjula, et al.: UV Spectrophotometric Estimation of Tea Tree Oil in Bulk and Cosmeceutical Creams
Table 7: Calibration curve of Tea Tree Oil.
Concentration Absorbance Average
mcg/ml Trial I Trial II Trial III absorbance
± SD
10.0 0.086 0.089 0.085 0.087±0.002
20.0 0.134 0.131 0.131 0.132±0.002
30.0 0.153 0.153 0.156 0.154±0.002
40.0 0.256 0.263 0.261 0.260±0.002
50.0 0.337 0.337 0.336 0.337±0.004
60.0 0.401 0.402 0.404 0.402±0.001
70.0 0.453 0.461 0.465 0.460±0.001
80.0 0.543 0.548 0.546 0.546±0.006
90.0 0.628 0.629 0.632 0.630±0.003
100.0 0.654 0.659 0.656 0.656±0.002
110.0 0.702 0.701 0.704 0.702±0.003
120.0 0.782 0.785 0.790 0.786±0.002
Figure 5: Desirability graph. 130.0 0.851 0.856 0.855 0.854±0.004
140.0 0.927 0.927 0.931 0.928±0.003
150.0 0.948 0.962 0.962 0.957±0.008
160.0 1.038 1.042 1.067 1.049±0.016
Table 8: Linearity parameters for estimation of Tea
Tree Oil, LOD and LOQ.
Parameter Value
Equation y = 0.0065x + 0.0046
R2 value 0.996
LOD mcg/ml 0.1277
LOQ mcg/ml 4.195
Figure 6: Calibration curve of Tea Tree Oil. Table 9: Results of accuracy determination.
Response* Amount Actual Average Percentage
were low indicating that the method is quite sensitive taken amount amount recovered
for estimation of TTO (Table 7 and 8). Accuracy of % mcg/ml recovered
±SD mcg/
the method was established from % recovered being ml
more than 100 for all the levels (Table 9) and precision Absorbance 80 40 42.6±1.19 106.5
of the method confirmed by % RSD values < 2% for at 267 nm 100 60 60.3±0.50 100.5
repeatability, intermediate precision and ruggedness 120 80 90.9±0.47 113.6
(Table 10 and 11). *n=3
The content of TTO in two marketed creams was
determined by the developed method viz., DXN
Cream, 0.34%w/v and HVT Cream, 0.45%w/v Table 10: Results of method precision.
respectively (Table 12). Though, it is not possible to Response* Precision Amount Amount Percent
verify the label claim owing to the current labelling mcg/ml recovered RSD
practices adopted for cosmeceuticals, still it is possible mcg/ml (SD/
±SD Average)
to conclude that the content of TTO in the creams is *100
well within the acceptable limit of 1-5%; however the Absorbance Intraday 80 90.9±0.47 0.52
composition of TTO is not mentioned on the label It at 267 nm Inter-day 80 90.9±0.47 0.52
is our observation, based on a market survey of various
*n=3
cosmetic and personal care products that 1-5% Tea tree
S290 Indian Journal of Pharmaceutical Education and Research | Vol 55 | Issue 1 [Suppl] | Jan-Mar, 2021Manjula, et al.: UV Spectrophotometric Estimation of Tea Tree Oil in Bulk and Cosmeceutical Creams
Table 11: Ruggedness (Intermediate precision). CONFLICT OF INTEREST
Response* Instrument Amount Amount Percent The authors hereby declare that there is no conflict of
mcg/ml recovered RSD interest involved in the study.
mcg/ml (SD/
±SD Average)*
100 ABBREVIATIONS
Absorbance Instrument 60 57.4±0.82 1.43
at 267 nm 1 Abs: Absorbance; ANOVA: Analysis of Variance;
Instrument 60 61.2±0.27 0.44 DCM: Dichloromethane; HPTLC: High performance
2 thin layer chromatography; ICH: International
Conference on Harmonization; ISO: International
Table 12: Content of TTO in the cosmeceutical
Organization for Standardization; LOD: Limit of
cream. detection; LOQ: Limit of quantification; Me OH:
Name of the cream TTO Content %w/v Methanol; QbD: Quality by design; RP-HPLC: Reverse
DXN Cream 0.34 phase high performance liquid chromatography; RSD:
HVT Cream 0.45 Relative standard deviation; TTO: Tea tree oil; UV:
Ultra violet.
oil, an active cosmetic ingredient of many products is Kindly provide authors images and author bio data of
included in ointments, mouthwashes, lotions and skin 4-5 sentences
care creams. TTO is also available as pure essential oil.
Most commonly, it is available in 5% concentration, but REFERENCES
higher concentrations are also available. It is also known 1. International organization for standardization. Essential oil of Melaleuca,
from several studies and reports that TTO, though a terpinen-4-ol type (Tea tree oil). ISO4730: 2017 and AS 2782:2017
Standards. 2017.
potent antimicrobial is also a potential skin irritant and 2. Carson CF, Hammer KA, Riley TV. Melaleuca alternifolia (Tea Tree) Oil: A
must be used with caution.10-12 Review of Antimicrobial and Other Medicinal Properties. Clin Microbiol Rev.
2006;19(1):50-62.
3. Biju SS, Ahuja A, Rafiullah MRM, Khar RK. A validated HPTLC method
CONCLUSION for determination of tea tree oil from cosmeceutical formulations. J Pharm
A simple and robust, cost effective UV Biomed Analy. 2005;38(1):41-4.
4. Sonia K, Anupama D. Microemulsion based transdermal drug delivery of tea
spectrophotometric method was developed and
tree oil. Int J Drug Dev Res. 2011;3(1):191-8.
validated for routine estimation of TTO in bulk and 5. Gulati N, Goyal AK, Rajesh KS, Mittal K, Rath G. Method development and
cosmeceutical creams. The developed method, though validation for the GC assay of α-pinene in tea tree oil formulation. Pharmacia.
non-specific, considering the highly complex and varied 2012;1(3):102-6.
6. Venugopal V, Goh R, Ping TY, Jin TJ. Formulation development and
composition of the oil, may be put to use for defining characterization of tea tree oil loaded ethosomes. Indonesian J Pharm.
standards for TTO based cosmeceuticals at a time when 2016;27(1):44-52.
none is existent. This study may be of significance 7. Carson CF, Riley TV. Antimicrobial activity of the essential oil of Melaleuca
to various regulatory bodies that are in the pursuit alternifolia: A Review. Lett Appl Microbiol. 1993;16(2):49-55.
8. Manjula BP, Joshi VG, Siddamsetty RS, Geetha M. Development and
of maintaining highest possible quality standards for validation of a new RP HPLC method for routine determination of tea tree
essential oils based cosmeceuticals. oil in bulk and cosmeceutical formulations. Indian Drugs. 2019;56(07):43-9.
9. Tea Tree Oil: A novel natural antiseptic and bactericide for the cosmetic
industry. Provital Group. V 02-11/09,12070 1-9.
ACKNOWLEDGEMENT 10. Yadav E, Kumar S, Mahant S, Khatkar S, Rao R. Tea tree oil: A promising
The authors wish to thank Government College essential oil. J Essent Oil Res. 2016. DOI:10.1080/10412905.2016.1232665.
Available from: www.tandfonline.com/doi/full/10.1080/10412905
of Pharmacy and Drugs Control Department,
11. Wilson DR. How to use tea tree oil for skin. Medical News Today. 2019.
Government of Karnataka for providing necessary 12. Olsen C. Tea Tree Oil: A Natural Ingredient for the Body Care and Cosmetics
facilities to carry out research. Industries. Kali Press, Port Townsend. 2020.
Indian Journal of Pharmaceutical Education and Research | Vol 55 | Issue 1 [Suppl] | Jan-Mar, 2021 S291Manjula, et al.: UV Spectrophotometric Estimation of Tea Tree Oil in Bulk and Cosmeceutical Creams
PICTORIAL ABSTRACT SUMMARY
TTO has a complex and variable composition
consisting of more than 113 components and therefore
poses many challenges to the analytical chemist for
method development. A quality by design approach
has been employed to develop a simple and novel UV
spectrophotometric method for estimation of tea tree
oil in bulk and cosmeceutical creams. The method was
validated as per ICH Q2:R(1) and is suitable for routine
determination of TTO in bulk and cosmeceutical
creams. The analytical method is significant in the light
of scant quality standards available for standardization
of creams containing TTO, an essential oil having both
beneficial as well as skin irritant properties.
About Authors
Manjula BP is Associate professor in Ramachandra Setty S is Principal, Senior
the Department of Pharmaceutics, Professor and Head, Department of
Government College of Pharmacy, Pharmacology, Government College of
Bengaluru. Pharmacy, Bengaluru.
Vijaya G Joshi is Professor and M Geetha is Assistant Professor in
Head, Department of Pharmaceutics, the Department of Pharmaceutics,
Government College of Pharmacy, Government College of Pharmacy,
Bengaluru. Bengaluru.
Cite this article: Manjula BP, Joshi VG, Setty RS, Muniappa G. Development and Validation of UV Spectrophotometric
Method for Estimation of Tea Tree Oil in Bulk and Cosmeceutical Creams. Indian J of Pharmaceutical Education and
Research. 2021;55(1s):s285-s292.
S292 Indian Journal of Pharmaceutical Education and Research | Vol 55 | Issue 1 [Suppl] | Jan-Mar, 2021You can also read