Dana Incorporated August 8, 2017 Jonathan Collins James Kamsickas Jonathan Collins Executive Vice President and Chief Financial Officer

Page created by Helen Christensen
 
CONTINUE READING
Dana Incorporated August 8, 2017 Jonathan Collins James Kamsickas Jonathan Collins Executive Vice President and Chief Financial Officer
Dana Incorporated
J.P. Morgan
Wolfe  Research
Global Auto Industry Conference
Auto     Conference
January 15, 2019
August 8, 2017
                         Jonathan Collins
                          James Kamsickas
Executive Vice President
               President and
                         & Chief Financial
                             Chief         Officer
                                   Executive  Officer

                            Jonathan Collins
Executive Vice President and Chief Financial Officer

                                                        © Dana 2019
                                                               2017   1
Dana Incorporated August 8, 2017 Jonathan Collins James Kamsickas Jonathan Collins Executive Vice President and Chief Financial Officer
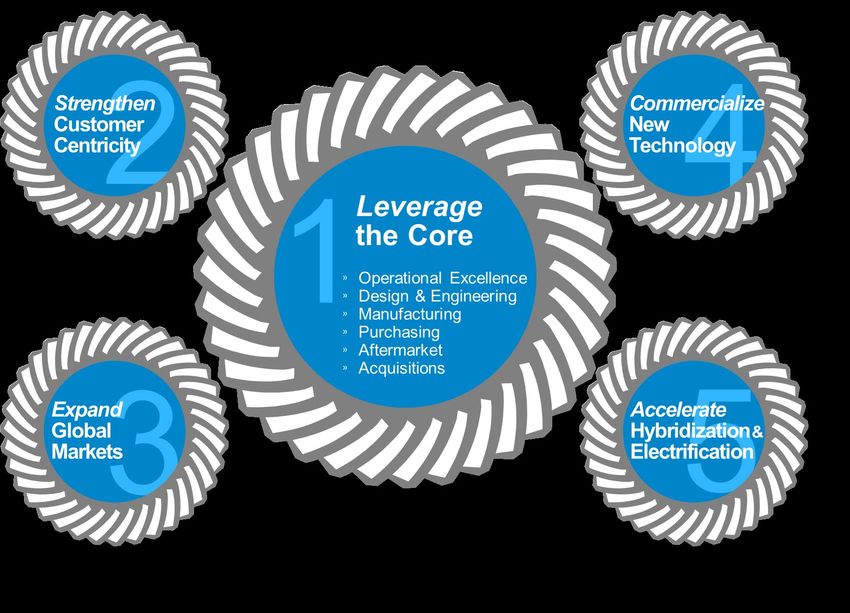
Safe Harbor Statement
Certain statements and projections contained in this presentation are, by their nature,
forward-looking within the meaning of the Private Securities Litigation Reform Act of 1995.
These forward-looking statements are based on our current expectations, estimates and
projections about our industry and business, management’s beliefs, and certain
assumptions made by us, all of which are subject to change. Forward-looking statements
can often be identified by words such as “anticipates,” “expects,” “intends,” “plans,”
“predicts,” “believes,” “seeks,” “estimates,” “may,” “will,” “should,” “would,” “could,”
“potential,” “continue,” “ongoing,” similar expressions, and variations or negatives of these
words. These forward-looking statements are not guarantees of future results and are
subject to risks, uncertainties and assumptions that could cause our actual results to differ
materially and adversely from those expressed in any forward-looking statement. Dana’s
Annual Report on Form 10-K, subsequent Quarterly Reports on Form 10-Q, recent
Current Reports on Form 8-K, and other Securities and Exchange Commission filings
discuss important risk factors that could affect our business, results of operations and
financial condition. The forward-looking statements in this presentation speak only as of
this date. Dana does not undertake any obligation to revise or update publicly any
forward-looking statement for any reason.
                                                                                      © Dana 2019   2
Dana Incorporated August 8, 2017 Jonathan Collins James Kamsickas Jonathan Collins Executive Vice President and Chief Financial Officer
Dana Snapshot
Founded in   1904

             2018 preliminary sales:
             $8.1 billion
                                       136 major facilities
                                        33 countries
                                         6 continents
                                             customers in
~30,000                 21             143   countries
 people           technical centers

                                                              © Dana 2019   3
Dana Incorporated August 8, 2017 Jonathan Collins James Kamsickas Jonathan Collins Executive Vice President and Chief Financial Officer
Business Overview
       Markets                           Segments                       Regions        Technologies                         Products
      Light Vehicles                  Light Vehicle Driveline          North America                       Axles, driveshafts, transmissions, hydraulic
                                      Technologies
                                                                                          Drive            wheel and track drives, drive units for electric and
                                       40%                                    46%
                                                                                                           hybrid vehicles
51%

                                                                                                           Winches, slew drives, planetary gearboxes,
                                                                                          Motion           hydraulic pumps, motors and valves,
                                      Commercial Vehicle                  Europe                           electronic controls
                                      Driveline Technologies

      Heavy Vehicles                  27%                                     28%
                                                                                                           e-Motors, generators, power electronics,
                                                                                          Electrodynamic   controls and software

                                      Off-Highway Drive and            South America                       Transmission and engine oil cooling, battery
28%

                                      Motion Technologies                                 Thermal          and electronics cooling, charge air cooling,
                                      21%                                      6%                          and exhaust-gas and heat recovery

       Off-Highway                                                                                         Gaskets and seals, transmission separator
                                                                                          Sealing          plates, cam covers and oil pan modules, heat
                                      Power Technologies                Asia Pacific                       shields, and fuel cell plates
                                      12%                                     20%                          Active and passive system controls, Software
                                                                                          Digital
21%

                                                                                                           as a Service including descriptive and
                                                                                                           predictive analytics

                       2018 preliminary sales including 100% of DDAC                                                                           © Dana 2019        4
Dana Incorporated August 8, 2017 Jonathan Collins James Kamsickas Jonathan Collins Executive Vice President and Chief Financial Officer
© Dana 2019   5
Dana Incorporated August 8, 2017 Jonathan Collins James Kamsickas Jonathan Collins Executive Vice President and Chief Financial Officer
Acquisition Benefits

  Completes in-house        Establishes European
    electrodynamic          e-Technology center of
      capabilities                excellence

  Augments breadth of        Strengthens Asia new
e-Drive systems offerings   energy market presence

                                              © Dana 2019   7
Dana Incorporated August 8, 2017 Jonathan Collins James Kamsickas Jonathan Collins Executive Vice President and Chief Financial Officer
Snapshot
                                                 Sales by End Market                                Sales by Region
                                  4                                                                            Americas

                               Global
                                                     Heavy                                                       10%
                                                    Vehicles
                                                      25%              Off-Highway
                              Locations                                    55%

$
       2019T Sales:                                                                                                    Europe

         ~$30M                        2
                                                                                                                        40%
                                              Other 20%                              Asia-Pacific
                                                                                         50%

      Purchase Price:           Engineering
          $88M                   Centers
                                                                           Key Customers

                   Manufacturing
                 in Europe and China

A Leader in Low Voltage Electrodynamic Components
                                                                                                              © Dana 2019   8
Dana Incorporated August 8, 2017 Jonathan Collins James Kamsickas Jonathan Collins Executive Vice President and Chief Financial Officer
Electrodynamic Technology
 Business         Brands              Motors                  Inverters / Controls

                                                     High
                                Permanent
                                 Magnet

                                                    Voltage
                                                    Range

                                Induction
                                                     Low

  Acquisition establishes complete suite of electrodynamic technology
                                                                          © Dana 2019   9
Dana Incorporated August 8, 2017 Jonathan Collins James Kamsickas Jonathan Collins Executive Vice President and Chief Financial Officer
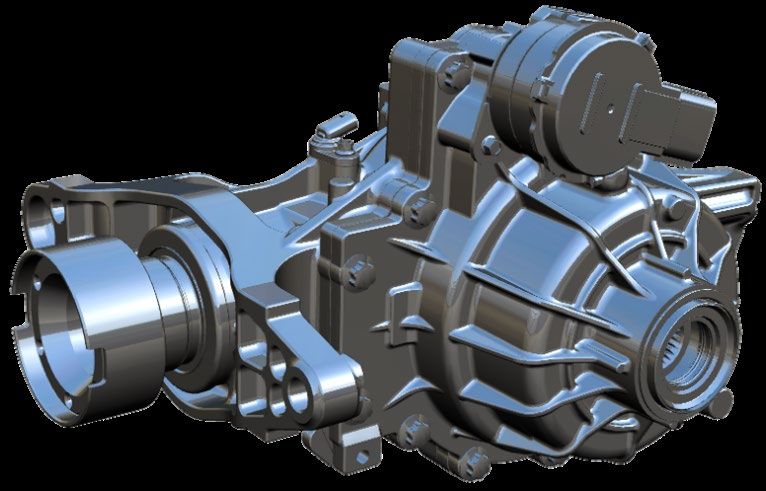
e-Propulsion Product Portfolio
                                                                 Technology Solutions
   Mild hybrid           Primary Axle Hybrid Drive (P/HEV)                                                   Battery Electric Vehicle (BEV)

  Power               Hybrid                   Hybrid             Independent                  Direct               e-Drive                   Rigid               Wheel
Electronics          Drive Unit                 Axle                 e-Axle                    Drive                 Unit                     e-Axle              Drives

                                                                  Vehicle Applications
Recreational       Utility        Passenger Car Material Handling City Delivery                Light Truck          Medium Duty          Heavy Duty/Bus       Mining Truck

  Club Car       Taylor Dunn      Bolloré Blue Car   BYD 1.6T & 2.5T   Zenith Electric Van   [Under Development]       Workhorse        Karsan ATAK midibus   Sandvik DD422iE

                                                                                                                                                               © Dana 2019      10
Dana Incorporated August 8, 2017 Jonathan Collins James Kamsickas Jonathan Collins Executive Vice President and Chief Financial Officer
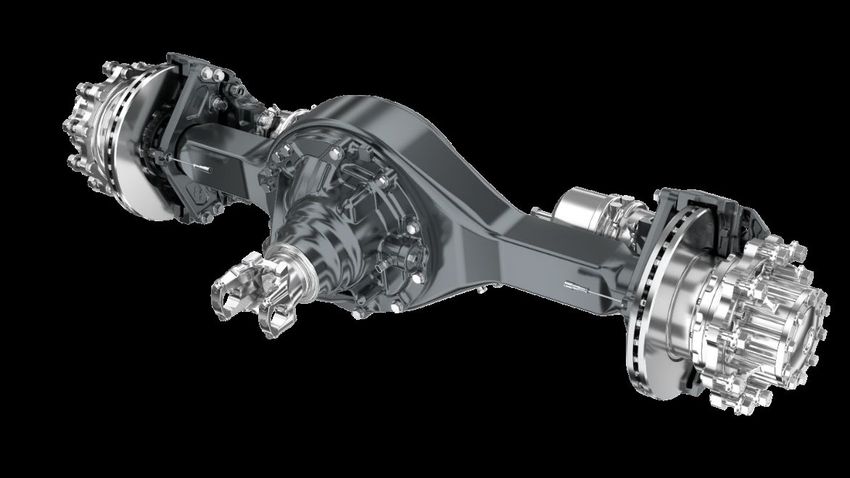
e-Propulsion Content Growth
           Full-Frame Light Trucks       Medium-Duty Trucks        Off-Highway Equipment

  ICE

                             >2x                       >2x                               ≈
                              CPV                      CPV                             CPV

Electric

                       Significant content per vehicle expansion opportunity
                                                                                   © Dana 2019   11
e-Propulsion Market Outlook
                 Full-Frame Light Trucks                          Medium-Duty Trucks              Off-Highway Equipment*

                  Internal                                      Internal                            Internal
                                                 Battery                                          Combustion
                Combustion                                    Combustion
                                                 Electric                                             92%
                    99%                                           95%
                                                   0%                                  Battery
                                                    Hybrid                             Electric                                        Battery
                                                     1%                                  1%                                            Electric
    2018                                                                               Hybrid                                            8%
                                                                                        4%

                                                     43%                                22%                                            25%
                                                    CAGR                               CAGR                                           CAGR
                  Internal                                       Internal
                Combustion                                     Combustion                           Internal
                    92%                                            84%                            Combustion
                                                   Battery                                            73%
                                                                                       Battery
                                                   Electric
                                                                                       Electric                                       Battery
                                                     3%
    2025                                            Hybrid
                                                                                         9%                                           Electric
                                                                                                                                        27%
                                                     5%                                 Hybrid
                                                                                         7%

                                                 All segments offer attractive market growth
Source: Roland Berger and management estimates                                                                 *Excludes forklifts and scissor lifts
                                                                                                                          © Dana 2019        12
Spicer Axles Driving the Future
                      Light Vehicle                                   Commercial Vehicle
        Ultra-Efficient AdvanTEK® Axle System                   HD Single AdvanTEK® Axle System

 Delivers ~2% improvement in fuel economy to the end consumer    Provides 60 pounds of weight savings

 The most efficient axle for automotive applications – a full    Application in 4x2, 6x2, and 6x4
 30% better than current best-in-class competitive products      vehicle configurations

                                                                                              © Dana 2019   13
Driving Growth
  Industry-leading technology
  powering growth

  Significant new business
  wins in all segments

  Multiple end markets
  provides cycle stability

  Investing for the future
  of mobility

                                © Dana 2019   14
2015 to 2018 Performance Improvement

                                                                                                                                          Diluted Adjusted
SALES                                 Adj. EBITDA                                                     Free Cash Flow                      Earnings Per Share

~$2.0 ~$300 ~$100 ~$1.15
billion                               million                                                        million

     33%                                          47%                                                           64%                              67%

                        Outstanding performance, outstanding future…
          Comparison based on 2015 results to preliminary 2018 results for sales, EBITDA and cashflow; EPS compared to latest guidance.             © Dana 2019   15
J.P. Morgan
 Outlook and Financials
 Auto Conference
 August 8, 2017
                           Jonathan Collins
Executive
  Executive
          Vice
            Vice
               President
                 President
                         and
                           & Chief Financial Officer

                                                       © Dana 2019
                                                              2017   16
2018 Preliminary Results
Sales surpassed high end of
guidance range as Q4                                                                         Key Financial Metrics
demand exceeded
expectations; however,
conversion on the                                                                                                                                                  ~$8,143M
incremental sales was
negligible as premium costs                                   Sales                                   $7,750M                                                  $8,050M
to fill the orders offset the
added contribution margin                                                                                            ~$957M
and product mix was                                                                                      $950M                                                 $1,010M
unfavorable                                                   Adjusted EBITDA

Adjusted EBITDA landed near
low end of guidance range,                                    Profit Margin                                                       ~11.8%
~$8M lower than prior
indication primarily due to
increased commodity costs
                                                              FCF Margin                                                           ~3.0%
Free cash flow results are in
line with prior expectation at                                                                                                   ~$2.90
~3.0% margin
                                                              Diluted Adjusted EPS                           $2.75                                             $3.05

                                           Delivering preliminary results within range of expectations
                                 See appendix for comments regarding the presentation of non-GAAP measures              Guidance range    Preliminary Result      Prior Indication

                                                                                                                                                                                     © Dana 2019   17
2018 Preliminary Sales and Profit Changes
                                                  Full   Positive Negative
                                                  Year   Change Change
Sales growth of 13%
compared with last year                  Sales                                 ~$815M
driven by conversion of               Adjusted
backlog, improving end-               EBITDA                                   ~$465M
market demand, a full year of                                                  Market                                                              ~$8.1B
the 2017 acquisitions, and
recovery of commodity                                                                                                             ~65M
                                                                               ~$350M                   ~$50M                    Recovery
inflation                                                                                                             ~Flat
                                                                               Backlog
                                                                                                        ~$30M                     ~$(45)M
~85 bps of margin expansion                      $7.2B
as a result of organic and                                                     ~$135M
inorganic growth was largely
offset by ~65 bps margin
headwind due to commodity
cost increases, net of                                                         ~17%
recoveries                                                                   conversion
                                                 $835M                                                                                            ~$957M
In addition to ~$110M of
commodity cost increases,
Section 232 and 301 tariffs
increasing costs by ~$10M                         11.6%                        ~55 bps                  ~30 bps                   ~(65) bps       ~11.8%
with minimal commercial
recovery
                                                   2017                      Organic Growth        Inorganic Growth   Currency   Commodities   2018 Preliminary

                                       Delivered >$900M of sales growth and added $120M of profit
                                See appendix for comments regarding the presentation of non-GAAP measures

                                                                                                                                                   © Dana 2019    18
2019 – 2021 Sales Backlog: $700 Million
                               $ in Millions
Backlog includes
booked incremental new
business net of any lost
                                                                                                                                       Key Customers
                                                                                                        +$150
replacement business
                                                                                                         New
Backlog is incremental to                                                 +$200                         Growth

2018 sales holding both                                                Sustained
foreign currency exchange                                             Prior Backlog
rates and vehicle                                    +$350                                                             $700
production volumes                                   +$50M                                       $550
constant                                           Added to
                                                 Prior Backlog     $350
Delivering positive backlog
in all business units across
all major customers and                   2018 Base                2019                          2020                   2021
regions                                         AP                             Other                                PTG
                                               13%                             15%                                  10%
                                                                    Navistar                                      OH
                                     SA                               6%                                          8%
                                     7%
                                                                                                   Ford          CV
                                                Region              Daimler
                                                                                  Customer         41%           7%    Segment
                                    EU                                9%
                                   12%                        NA                                                                  LV
                                                             68%     Nissan                                                      75%
                                                                      9%
                                                                                       FCA 20%

                                           Backlog ensures outperformance of market through 2021
                                                                                                                                               © Dana 2019   19
2019 Mobility Market Demand Outlook
Mobility   Primary                    Core                         Sales        North           Europe                        South     Asia       Dana
Market     Source                   Segments                       Dist1       America          & Africa                     America   Pacific    Impact
                                                                                  46%                  28%                     6%        20%          100%

                                       Full Frame                    51%

.

                                    Medium Duty
                                                                     28%

                                      Heavy Duty

                                       Agriculture

                                     Construction                    21%

                                           Mining

                                   Dana Impact                      100%

                                                                     Legend:
                                                                      YoY ∆     >+3%     (3%)
2019 Guidance Ranges
Guidance reflects existing
Dana business and                                               Guidance Range     Guidance Range w/ ODS
represents ~$250M or 3%
organic growth, ~$65M of
profit growth, 40 bps of profit
                                                                       ~$8,400M                   ~$9,150M
margin expansion, 100 bps of
free cash flow margin             Sales                   +/- $150M               +/- $200M
expansion, and ~$0.20 or 7%
EPS growth                                                             ~$1,025M                    ~$1,125M
Guidance range with Oerlikon      Adjusted EBITDA          +/- $30M                +/- $40M
Drive Systems (ODS) reflects
10 months of activity and
assumes a March 1st close         Implied Profit Margin                 ~12.2%                       ~12.3%
Guidance with ODS
represents ~$1B or 12%
sales growth, ~$165M of           Implied FCF Margin                     ~4.0%                       ~3.0%
profit growth, 50 bps of profit
margin expansion, and                                                   ~$3.10                       ~$3.20
~$0.30 or 10% EPS growth                                   +/- $0.20               +/- $0.25
                                  Diluted Adjusted EPS
ODS is expected to be a use
of cash in 2019 as transaction                                                                 Guidance Range     Mid Point
costs and integration
expenses are included in FCF
                                  Expecting 3rd year of double digit sales, profit, and FCF growth
                                                                                                            © Dana 2019       21
2019 Sales and Profit Changes
Higher conversion on organic                Full
                                            Year
                                                   Positive Negative
                                                   Change Change
growth due to efficiency
improvements as well as the        Sales
benefit of structural costs     Adjusted
actions taken in H2 of 2018     EBITDA

Overlap of Jeep Wrangler
program during H1 2018                                                                  ~$750M
                                                                                                                            ~$9.2B
resulting in ~$110M of non-
recurring sales, contribution              ~$8.1B                        ~$350M
margin loss offset by the                                                Backlog                  ~$(10)M     ~$90M
elimination of launch costs                                                             ~$100M    ~($75)M
incurred in 2018                                                                                              ~($40)M
                                                                         ~$115M
ODS is expected to accrete                                               ~($110)M
~$100M of profit (10 mo.)              ~$957M                             Wrangler
                                                                                                                           ~$1,125M
including ~$10M of cost                                                    Launch
synergies                                                                 >30%
                                                                        conversion
Foreign currency expected to
provide modest headwind                    11.8%                         ~100 bps       ~10 bps              ~(60 bps)      12.3%
primarily due to EUR/USD

Commodities costs expected
to remain higher than prior         2018 Preliminary                   Organic Growth             Currency   Commodities   2019 Target
year average albeit with
higher recovery ratio than
prior year as costs plateau     Poised to deliver $1B of sales growth and add $165M of profit
                                                                                                                             © Dana 2019   22
Key Financial Metrics Trends
                                          Sales                                                                                           Adjusted EBITDA
 $ in Billions
                                        +$3.1
                                                                                                              $ in Millions
                                                                     ~$9.2                                        $1,400

                                                                                                                                                      +$470                                                        14%

                                                      ~$8.1                                                                                                                    ~$1,125
                                                                                                                                                                                                                   14%

                                                                                                                                                                                                     ~12.8%       +200
                                                                                                9%                                                                  ~$957
                                        $7.2                                                                                                                                                                      bps
                                                                                                                                                                                                                   13%

                                                                                               CAGR                                                   $835                       ~12.3%                            13%

               $6.1                                                                                                        $652       $660                          ~11.8%
                          $5.8                                                                                                                        11.6%
                                                                                                                                                                                                                   12%

                                                                                                                                       11.3%                                                                       12%

                                                                                                                           10.8%                                                                                   11%

                                                                                                                   $200                                                                                            11%

               2015A    2016A          2017A          2018P          2019T          2020T                                  2015A     2016A           2017A          2018P       2019T                2020T
                                                    ODS                                                                                                 ODS                   Profit Margin

                             Free Cash Flow                                                                                          Diluted Adjusted EPS
 $ in Millions
        $450                                                                                    7%

                                                                                                                                                                                 ~$3.20
                                                                     ~$335
        $400

                                                                                       5%
                                                                                                6%

        $350

                                                                                                +300                                                                ~$2.90*
                                                                                                bps                                                                                                                 16%
                                                      ~$240           ~4%
                                                                                                5%
        $300

        $250

                                                                                                4%
                                                                                                                                                      $2.52                                                        CAGR
        $200

               $146                     $161                          ~3%                                                             $1.94
                                                                                                3%

                                                       ~3%                                                                 $1.74
        $150

        $100

                 2%       $62
                                          2%
                                                                                                2%

         $50

                                                                                                1%

                           1%                                        ~$(60)
          $0

        -$50                                                                                    0%

               2015A    2016A          2017A          2018P          2019T          2020T                                  2015A      2016A          2017A          2018T        2019T                2020T
                                 ODS                   FCF Margin
                                                                                                                                                                    ODS

2019 FCF excludes pension termination impact                                                            *As presented in the third quarter 2018 earnings release.                             A=Actual; P=Preliminary T=Target

                            See appendix for comments regarding the presentation of non-GAAP measures                                                                                                © Dana 2019           23
Strong Balance Sheet
                            Pro Forma Capitalization                                                              Maturity Profile
                                                                                        $ in Millions

                                                                                                                           $750
              ($ in millions)                                 YE 2018        YE 2019
                                                             Preliminary    Pro forma
                                                                                                                                                                      $790
              Cash and Marketable Securities                   ~$525         ~$575
              Revolver                                           ~575         ~725                                         $405
                                                                                                                                                   $430    $405
                                                                                                                                      $305
                                             Liquidity       ~$1,100        ~$1,300
              Term Loan A                                      ~$265         ~$460        $35           $35    $35
                                                                                         2019           2020   2021        2022        2023         2024   2025       2026
              Term Loan B                                                     ~445
                                                                                                                Current Debt   Pro Forma Debt   Revolver

              Senior Notes                                     ~1,500        ~1,500
              Other Debt                                           ~20         ~50              No maturities in the next three years
              Total Debt                                     ~$1,785        ~$2,455
                                                                                                Net leverage projected to increase by
              Net Debt                                       ~$1,260        ~$1,880
                                                                                                < ½ a turn with ODS acquisition
              Adjusted EBITDA                                  ~$957        ~$1,125
                                      Net Leverage              ~1.3x         ~1.7x             Liquidity to increase by ~$200M

See appendix for comments regarding the presentation of non-GAAP measures

                                                                                                                                                                  © Dana 2019   24
Capital Allocation Priorities
Capital expenditures have
normalized at ~4% of          1               Investing to deliver backlog generates attractive returns
sales as largest program          Organic
have refreshed (i.e. Ford                     Targeting consistent capital spend levels at ~4% of sales
Super Duty and Jeep               Growth
Wrangler)

Disciplined M&A process                       Expand product technology
continues to deliver          2
accretive acquisitions         Inorganic
position for long term
                                              Enhance geographic presence
                                Growth
growth prospects related
to vehicle electrification

As free cash flows            3               Reduce debt and pension liabilities (U.S. frozen pension plan
continues to increase,             Capital    fund and termination planned for 2019)
excess cash will be used
to further strengthen the         Structure
                                              Drive towards investment grade credit metrics
balance sheet

                             4                Pay competitive dividend
                                 Cash
                                              Ambient level of share repurchase to mitigate dilution;
                              Repatriation
                                              $200M authorized ($175M remaining for 2019)

                             Investing in growth and further strengthening balance sheet
                                                                                                          © Dana 2019   25
Investment Highlights
                              1
                                   Global
                                  Presence
           8      Clear                      2    Broad
               Investment                        Customer
                Priorities                         Base

     7    Solid                                    3    Relevant
         Balance                                       Technology
          Sheet                                         Portfolio

          6     Expanding                    4   Significant
               Profit & FCF                         Sales
                 Margins      5   Strong          Backlog
                                  Market
                                  Demand
                                                                    © Dana 2019   26
Non-GAAP Financial Information
The preceding slides refer to Adjusted EBITDA, a non-GAAP financial measure which we have defined as net income before interest, taxes, depreciation,
amortization, equity grant expense, restructuring expense and, non-service cost components of pension and other postretirement benefits (OPEB) cost and
other adjustments not related to our core operations (gain/loss on debt extinguishment, pension settlements, divestitures, impairment, etc.). Adjusted
EBITDA is a measure of our ability to maintain and continue to invest in our operations and provide shareholder returns. We use adjusted EBITDA in
assessing the effectiveness of our business strategies, evaluating and pricing potential acquisitions and as a factor in making incentive compensation
decisions. In addition to its use by management, we also believe adjusted EBITDA is a measure widely used by securities analysts, investors and others to
evaluate financial performance of our company relative to other Tier 1 automotive suppliers. Adjusted EBITDA should not be considered a substitute for
income before income taxes, net income or other results reported in accordance with GAAP. Adjusted EBITDA may not be comparable to similarly titled
measures reported by other companies.
Diluted adjusted EPS is a non-GAAP financial measure which we have defined as adjusted net income divided by adjusted diluted shares. We define
adjusted net income as net income attributable to the parent company, excluding any nonrecurring income tax items, restructuring charges, amortization
expense and other adjustments not related to our core operations (as used in adjusted EBITDA), net of any associated income tax effects. We define
adjusted diluted shares as diluted shares as determined in accordance with GAAP based on adjusted net income. This measure is considered useful for
purposes of providing investors, analysts and other interested parties with an indicator of ongoing financial performance that provides enhanced
comparability to EPS reported by other companies. Diluted adjusted EPS is neither intended to represent nor be an alternative measure to diluted EPS
reported under GAAP.
Free cash flow is a non-GAAP financial measure which we have defined as net cash provided by (used in) operating activities excluding voluntary pension
contributions, less purchases of property, plant and equipment. We believe this measure is useful to investors in evaluating the operational cash flow of the
company inclusive of the spending required to maintain the operations. Free cash flow is neither intended to represent nor be an alternative to the measure
of net cash provided by (used in) operating activities reported under GAAP. Free cash flow may not be comparable to similarly titled measures reported by
other companies.
Please reference the “Non-GAAP financial information” accompanying our quarterly earnings conference call presentations on our website at
www.dana.com/investors for reconciliations of adjusted EBITDA, diluted adjusted EPS and free cash flow to the most directly comparable financial measures
calculated and presented in accordance with GAAP. We have not provided a reconciliation of our adjusted EBITDA and diluted adjusted EPS outlook to the
most comparable GAAP measures of net income and diluted EPS. Providing net income and diluted EPS guidance is potentially misleading and not
practical given the difficulty of projecting event driven transactional and other non-core operating items that are included in net income and diluted EPS,
including restructuring actions, asset impairments and income tax valuation adjustments. The reconciliations of these non-GAAP measures with the most
comparable GAAP measures for the historical periods presented on our website are indicative of the reconciliations that will be prepared upon completion of
the periods covered by the non-GAAP guidance.

                                                                                                                                                  © Dana 2019   27
You can also read