SECOND QUARTER 2021 EARNINGS - SITEONE LANDSCAPE SUPPLY
←
→
Page content transcription
If your browser does not render page correctly, please read the page content below

Second Quarter 2021 Earnings

Disclaimer
Forward-Looking Statements
This presentation contains “forward-looking statements” within the meaning of the Federal Private Securities Litigation Reform Act of 1995. Forward-looking statements may
include, but are not limited to, statements relating to our 2021 Adjusted EBITDA outlook. Some of the forward-looking statements can be identified by the use of terms such as
“may,” “intend,” “might,” “will,” “should,” “could,” “would,” “expect,” “believe,” “estimate,” “anticipate,” “predict,” “project,” “potential,” or the negative of these terms, and similar
expressions. You should be aware that these forward-looking statements are subject to risks and uncertainties that are beyond our control. Further, any forward-looking statement
speaks only as of the date on which it is made, and we undertake no obligation to update any forward-looking statement to reflect events or circumstances after the date on which it
is made or to reflect the occurrence of anticipated or unanticipated events or circumstances. New factors emerge from time to time that may cause our business not to develop as
we expect, and it is not possible for us to predict all of them. Factors that may cause actual results to differ materially from those expressed or implied by the forward-looking
statements include, but are not limited to, the following: the potential negative impact of the COVID-19 pandemic (which, among other things, may exacerbate each of the risk listed
below); economic downturn or recession; cyclicality in residential and commercial construction markets; general economic and financial conditions; weather conditions, seasonality
and availability of water to end-users; public perceptions that our products and services are not environmentally friendly; competitive industry pressures; product shortages and the
loss of key suppliers; product price fluctuations; ability to pass along product cost increases; inventory management risks; ability to implement our business strategies and achieve
our growth objectives; acquisition and integration risks; increased operating costs; risks associated with our large labor force (including work stoppages due to COVID-19);
retention of key personnel; construction defect and product liability claims; impairment of goodwill; adverse credit and financial markets events and conditions (which have
worsened and may continue to worse as a result of the COVID-19 pandemic); credit sale risks; performance of individual branches; environmental, health and safety laws and
regulations; hazardous materials and related materials; laws and government regulations applicable to our business that could negatively impact demand for our products;
computer data processing systems; cybersecurity incidents (including the July 2020 ransomware attack); security of personal information about our customers; intellectual property
and other proprietary rights; the possibility of securities litigation; unanticipated changes in our tax provisions; our substantial indebtedness and our ability to obtain financing in the
future; increases in interest rates; risks related to our common stock; terrorism or the threat of terrorism; and other risks, as described in Item 1A, “Risk Factors,” and elsewhere in
our Annual Report on Form 10-K for the fiscal year ended January 3, 2021, as updated by our subsequent filings under the Securities Exchange Act of 1934, as amended,
including Forms 10-Q and 8-K.
Non-GAAP Financial Information
This release includes certain financial information, not prepared in accordance with U.S. GAAP. Because not all companies calculate non-GAAP financial information identically (or
at all), the presentations herein may not be comparable to other similarly titled measures used by other companies. Further, these measures should not be considered substitutes
for the information contained in the historical financial information of the Company prepared in accordance with U.S. GAAP that is set forth herein.
We present Adjusted EBITDA in order to evaluate the operating performance and efficiency of our business. Adjusted EBITDA represents EBITDA as further adjusted for items
permitted under the covenants of our credit facilities. EBITDA represents our Net income (loss) plus the sum of income tax (benefit) expense, interest expense, net of interest
income, and depreciation and amortization. Adjusted EBITDA is further adjusted for stock-based compensation expense, (gain) loss on sale of assets and termination of finance
leases not in the ordinary course of business, other non-cash items, financing fees, other fees, and expenses related to acquisitions and other non-recurring (income) loss.
Adjusted EBITDA excludes any earnings or loss of acquisitions prior to their respective acquisition dates for all periods presented. Adjusted EBITDA is not a measure of our
liquidity or financial performance under GAAP and should not be considered as an alternative to net income, operating income or any other performance measures derived in
accordance with GAAP, or as an alternative to cash flow from operating activities as a measure of our liquidity. The use of Adjusted EBITDA instead of net income has limitations
as an analytical tool. Because not all companies use identical calculations, our presentation of Adjusted EBITDA may not be comparable to other similarly titled measures of other
companies, limiting its usefulness as a comparative measure. Net debt is defined as long-term debt (net of issuance costs and discounts) plus finance leases, net of cash and
cash-equivalents on our balance sheet. Leverage Ratio is defined as Net debt to trailing twelve months Adjusted EBITDA. We define Organic Daily Sales as Organic Sales divided
by the number of Selling Days in the relevant reporting period. We define Organic Sales as Net sales, including Net sales from newly-opened greenfield branches, but excluding
Net sales from acquired branches until they have been under our ownership for at least four full fiscal quarters at the start of the fiscal year. Selling Days are the number of
business days, excluding Saturdays, Sundays and holidays, that SiteOne branches are open during the relevant reporting period.

                                                                                                                                                                                 2
Conference call agenda

                               Introduction
                              John Guthrie, CFO

                            Business Update

                         Doug Black, Chairman and CEO

                            Financial Update

                              John Guthrie, CFO

                          Development Update
                   Scott Salmon, EVP Strategy & Development

                           Closing & Outlook
                         Doug Black, Chairman and CEO

                                    Q&A

                                                              3
Company and industry overview

■ Largest and only national wholesale
  distributor of landscape supplies

■ $20 billion highly fragmented market(1)

■ More than five times the size of next
  competitor and only ~13% market share(1)

■ Serving residential and commercial
  landscape professionals
                                                                                                                                    Distribution Center

■ Complementary value-added services                                                                                                Branch

  and product support

                                                                         Balanced end markets (FY20)                     Repair
■ Approximately 130,000 SKUs                                                                                            & Upgrade                   Maintenance
                                                                                                                           18%                          41%

■ Over 590 branches and three distribution
  centers covering 45 U.S. states and six
  Canadian provinces(2)
                                                                                                                       New
                                                                                                                    Construction
                                                                                                                       41%

             (1)   As of year end 2020. Source: Management estimates, Company data, independent 3rd party support
                                                                                                                                                              4
             (2)   Branch count as of Q2‘21
SiteOne is poised for continued growth and margin enhancement

   Current strategy

   ✓ Leverage strengths of both large and local company
        ■ Fully exploit our scale, resources and capabilities
        ■ Execute local market growth strategies
        ■ Deliver superior value to our customers and suppliers
        ■ Close and integrate high value-added acquisitions           Value creation levers
        ■ Entrepreneurial local area teams supported by world-class
          functional support
                                                                      1) Organic growth

                                                                      2) Margin expansion
   ✓ Drive commercial and operational performance
        ■ Category management                                         3) Acquisition growth
        ■ Supply chain
        ■ Salesforce performance
        ■ Operational excellence
        ■ Marketing and Digital

                                                                                              5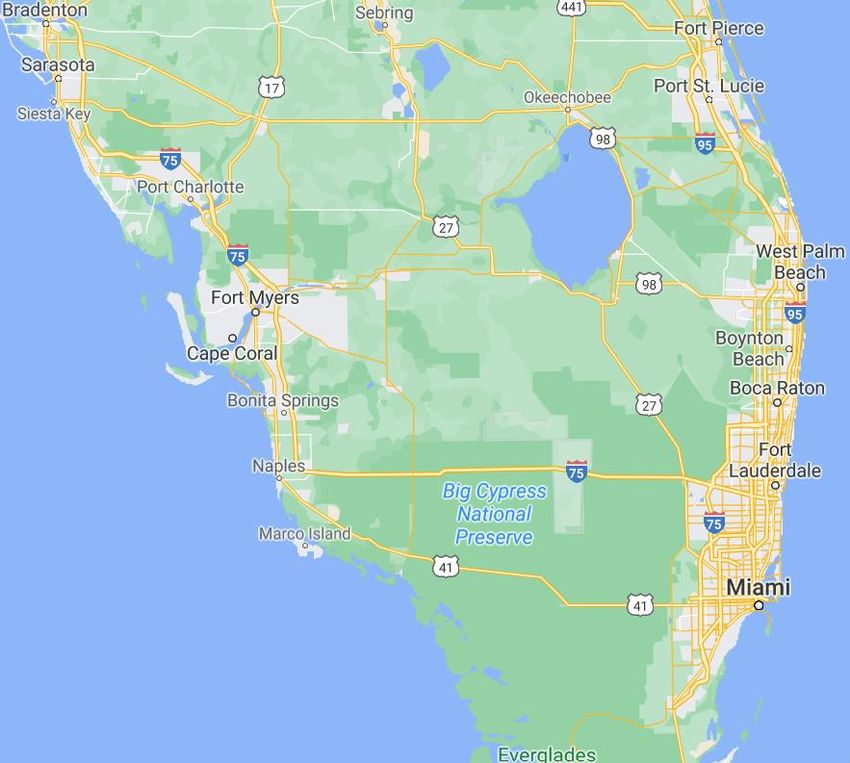
Track record of performance and growth

     Net Sales                                                                                             Adjusted EBITDA

     (in Millions)                                                       2,705                             (in Millions)                                                    260
                                                             2,358
                                                    2,112                             ’15-’20                                                                   201                      ’15-’20
                                   1,862                                              Growth                                                           176                               Growth
                     1,648                                               33.3%                                                           157
       1,452                                                32.8%
                                                                                      Sales $                               134                                             9.6%
                                                                                                                                                                                     Adj. EBITDA $
                                                                                       +86%                   107                                                                        +144%
                                   32.0%        32.1%
                                                                                                                                                                8.5%
                     31.3%                                                             GM %                                              8.4%       8.3%                             Adj. EBITDA %
                                                                                                                            8.1%
       29.6%                                                                          +370 bps               7.3%                                                                      +230 bps

      FY 2015        FY 2016      FY 2017      FY 2018      FY 2019     FY 2020                             FY 2015        FY 2016     FY 2017     FY 2018     FY 2019   FY 2020
                         Net Sales             Gross Margin %                                                              Adj. EBITDA           Adj. EBITDA Margin %

        2015                                2016                      2017                       2018                          2019                          2020                      2021

                                         Initial Public                    Building the Foundation
       Brand                               Offering
                                                                                                                                     Performance & Growth
                                                                                  Acquisitions
■   McGinnis Farms (’01)             ■   Hydro-Scape         ■   Aspen Valley            ■   Pete Rose                 ■ Cutting Edge              ■   Wittkopf             ■   Lucky Landscape
■   Century RainAid (’01)            ■   Blue Max            ■   Stone Forest            ■   Atlantic Irrigation       ■ All Pro Horticulture      ■   Empire Supplies      ■   Arizona Stone & Solstice
■   UGM (’05)                        ■   Bissett             ■   Angelo's                ■   Village Nurseries         ■ Landscape Depot           ■   The Garden Dept      ■   Timberwall
■   LESCO (’07)                      ■   Glen Allen          ■   AB Supply               ■   Terrazzo & Stone          ■ Fisher’s Depot            ■   Big Rock             ■   Melrose Irrigation Supply
■   Eljay (‘14)                      ■   Loma Vista          ■   Evergreen Partners      ■   Landscaper’s Choice       ■ Stone & Soil Depot        ■   Alliance Stone       ■   Rock & Block
■   Diamond Head (‘14)               ■   East Haven          ■   South Coast Supply      ■   Auto-Rain                 ■ Voss Materials            ■   Modern Builders
■   Stockyard (‘14)                                          ■   Marshall Stone          ■   All American Stone        ■ Trendset Concrete         ■   BURNCO Landscape
■   BISCO (‘14)                                              ■   Harmony Gardens         ■   Landscape Express           Products                      Centres
■   Shemin (‘15)                                                                         ■   Kirkwood                  ■ Design Outdoor            ■   Hedberg Supply
■   AMC (‘15)                                                                            ■   Stone Center              ■ Dirt Doctors              ■   Alpine Materials
■   Green Resource (‘15)                                                                 ■   CentralPro                ■ Daniel Stone              ■   Dirt and Rock
■   Tieco (‘15)                                                                          ■   C&C Sand and Stone                                    ■   Stone Center of VA
                                                                                         ■   All Around
                             Source: Company data
                                                                                                                                                                                                6
Significant room to grow across product lines

                                # of markets(1)

                                                                 Missing either           Missing both
                                Full Product                                                                                 No
                                                                 Hardscapes or            Hardscapes
                                Line Offering                                                                             Presence
                                                                    Nursery               and Nursery

SiteOne offers all                                                                                                             ~45
product lines in only
~21% of our target
markets today…
                                                                                                   ~85

                                                                      ~50

                                           ~50

                         (1)   Target markets as of Q4 2020 are represented by metropolitan statistical areas (“MSAs”) where either SiteOne currently has a
                               presence or MSAs with a population above ~200k, which cover ~80% of the total U.S. population.

              Source: Management estimates; U.S. Census Bureau                                                                                                7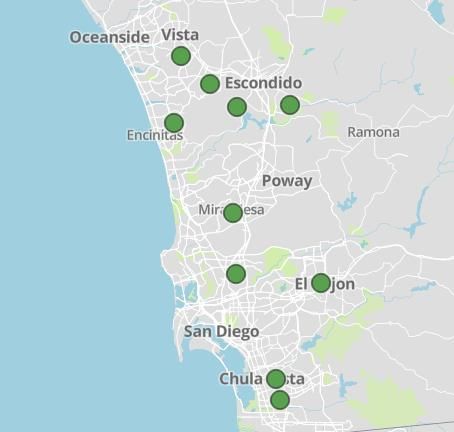
Second Quarter 2021 highlights

Second Quarter 2021 highlights (compared to second quarter 2020):

✓   Net sales increased 33% to $1.1 billion

✓   Organic Daily Sales increased by 22%

✓   Gross profit increased 36% to $388.2 million; gross margin increased 80 basis points to 35.8%

✓   SG&A as a percentage of Net sales decreased by 60 basis points to 20.8%

✓   Net income increased 56% to $123.5 million

✓   Adjusted EBITDA increased 44% to $190.6 million

✓   Adjusted EBITDA margin increased 140 basis points to 17.6%

✓   Net leverage ratio decreased to 0.7x from 2.2x

✓   Acquired Timberwall Landscape & Masonry Products, Melrose Irrigation Supply, and Rock & Block
    Hardscape Supply

                                                                                                    8
                Source: Company data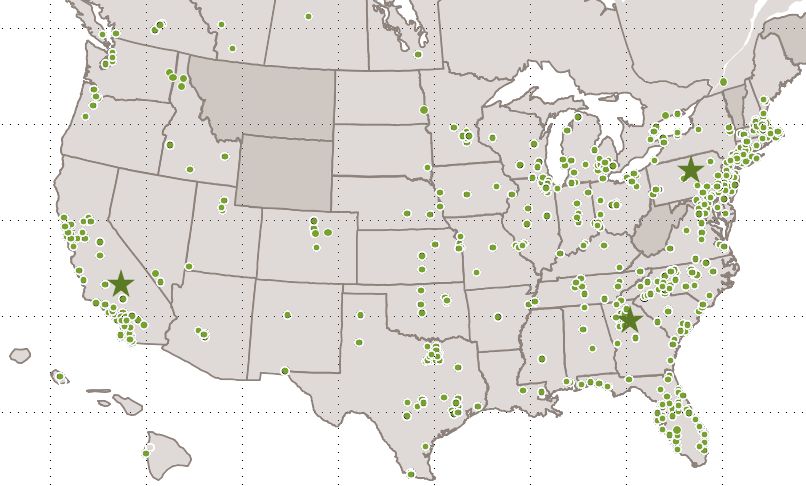
Review of Second Quarter 2021 financial results

Summary financials                                   Financial highlights
($ in millions)
                            +33%
                                                     ■ Net sales increased 33% YoY to $1.1 billion

  Net sales                               1,083.9       – Organic Daily Sales increased by 22%
                  817.7
                                                        – Acquired sales growth was $90.4 million, contributing 11% to
                  Q2’20                     Q2’21         the overall growth rate

                              +36%           35.8%   ■ Gross profit increased 36% to $388.2 million
                  35.0%
Gross profit                                            – Gross margin increased 80 bps to 35.8%
 & margin                                   388.2
                  286.1                                 – Reflects supply chain execution, more favorable pricing and
                                                          customer mix
                  Q2’20                      Q2’21
                                                     ■ Net income increased 56% to $123.5 million
                            +56%

Net income                                  123.5       – Improvement driven by higher Net sales, gross margin
                                                          improvement, and SG&A leverage
                   79.1
                  Q2’20                      Q2’21

                                                     ■ Adjusted EBITDA increased 44% to $190.6 million
                            +44%
   Adjusted
   EBITDA                                               – Adjusted EBITDA margin increased 140 basis points to
                                            190.6
                                                          17.6%, driven by gross margin improvement and SG&A
                  132.1                                   leverage
                  Q2’20                      Q2’21
                          Source: Company filings
                                                                                                                        9
Balance sheet & cash flow highlights
Second Quarter 2021 Balance sheet & cash flow highlights (compared to prior-year period)
($ in millions)
■ Working capital increased to $623.8 million, compared to $583.8
million
Working capital $623.8 – Reflects strong sales growth and additions from new acquisitions
■ Cash provided by operating activities of $137.7 million, compared
to $184.7 million
– Higher inventory and receivables supporting increased sales
Cash provided
by operating $137.7
activities ■ Net debt $257.2 million, compared to $476.5 million
– Reduction reflects proceeds from August 2020 equity offering and
solid operating cash flow
■ Net debt / Adjusted EBITDA of 0.7x, compared to 2.2x
Net debt1 $257.2
– Leverage decrease attributable to reduced net debt and improved
profitability
– Year-end target net debt / Adjusted EBITDA leverage2 of 1.0x – 2.0x
1 Net debt is calculated as long-term debt plus finance leases, net of cash and cash equivalents
2 Leverage ratio defined as net debt (including finance leases) to trailing twelve months Adjusted EBITDA 10
Source: Company filingsProven track record of successful acquisitions
2014 – 2015 2016 2017 2018 2019 2020 2021 YTD Total
▪ Eljay ▪ Hydro- ▪ Aspen Valley ▪ Pete Rose ▪ Cutting Edge ▪ Wittkopf ▪ Lucky
Scape Landscape Landscape
▪ Diamond ▪ Stone Forest ▪ Atlantic Irrigation ▪ All Pro
Supplies
Head ▪ Blue Max Horticulture ▪ Arizona Stone
▪ Angelo's ▪ Village Nurseries
▪ Empire Supplies
▪ Stockyard ▪ Bissett ▪ Landscape ▪ Timberwall
▪ AB Supply ▪ Terrazzo & Stone
Depot Supply ▪ The Garden
▪ BISCO ▪ Glen Allen ▪ Melrose
▪ Evergreen ▪ Landscaper’s Dept.
▪ Fisher’s Irrigation Supply
▪ Shemin ▪ Loma Vista Partners Choice
Landscape ▪ Big Rock
▪ Rock & Block
▪ AMC ▪ East ▪ South Coast ▪ Auto-Rain Depot
▪ Alliance Stone
Haven Supply
▪ Green ▪ All American ▪ Stone & Soil
▪ Modern Builders
Resource ▪ Marshall Stone Stone Depot
▪ BURNCO
▪ Tieco ▪ Harmony ▪ Landscape ▪ Voss Materials
Landscape
Gardens Express
▪ Trendset Centres
▪ Kirkwood Concrete
▪ Hedberg Supply
Products
▪ Stone Center
▪ Alpine Materials
▪ Design Outdoor
▪ CentralPro
▪ Dirt and Rock
▪ Dirt Doctors
▪ C&C Sand &
▪ Stone Center of
Stone ▪ Daniel Stone
Virginia
▪ All Around
# Acquisitions 8 6 8 13 10 11 5 61
Annualized
~$270M ~$150M ~$130M ~$230M ~$100M ~$190M ~$90M ~$1,160M
net sales(1)
# branches
68 29 26 78 21 30 19 271
added
(1) Trailing twelve months (TTM) revenues in the year acquired 11
Source: Company dataM&A continues to add significant value
Timberwall Landscape & Masonry Products
✓ Closed on April 30, 2021
✓ Extends our leading hardscapes
and landscape supplies platform in
the greater Minneapolis market
✓ Cross-sell opportunities
✓ Purchasing synergies
SiteOne existing
Hedberg Supply (Oct 2020)
Timberwall
Source: Company data
12M&A continues to add significant value
Melrose Irrigation Supply
✓ Closed on April 30, 2021
✓ Expands our market-leading
irrigation presence across South
Florida with 6 locations
✓ Cross-sell opportunities
✓ Purchasing synergies
SiteOne existing
Melrose
Source: Company data
13M&A continues to add significant value
Rock & Block Hardscape Supply
✓ Closed on May 7, 2021
✓ Expands our leading hardscapes
platform with 2 locations in
Southern California
✓ Cross-sell opportunities
✓ Purchasing synergies
SiteOne existing
Modern Builders (Aug 2020)
Rock & Block
Source: Company data
14Robust pipeline provides significant growth opportunity
✓ SiteOne is the leading industry consolidator
13%
✓ Significant sourcing advantage with 80+ associates scouting
new growth opportunities
87%
✓ Our pipeline is deep and expanding
~$20bn market(1)
✓ M&A team in place to execute our acquisition strategy
✓ Acquisitions are expected to be accretive and present significant profit
growth potential
(1) As of year end 2020. Management Estimates
152021 outlook
✓ Market trends remain positive; sustaining growth against tougher comparisons
✓ Key commercial and operational initiatives are expected to support market
share gains and gross margin expansion
✓ Healthy M&A activity with robust pipeline
✓ Raising 2021 Adjusted EBITDA expectation to $335 million to $365 million,
representing year-over-year growth of 29-40%, compared to prior range of $300
million to $320 million
✓ Expect continued Adjusted EBITDA margin expansion
16Investment highlights
Uniquely
Clear market leader
attractive industry
Compelling and
Proven management
sustainable
team
growth strategy
Operational and
Value-creating
commercial
acquisitions
excellence
17Appendix Non-GAAP Reconciliations
Non-GAAP reconciliations

    Adjusted EBITDA Reconciliation
                                                           2021                               2020                           2019
   ($ in millions)
                                             Q2’21        Q1’21     Q4’20        Q3’20         Q2’20        Q1’20        Q4’19   Q3‘19

        Net income (loss)                    $123.5         $7.4     $11.5        $48.2         $79.1 $(17.5)             $2.5   $34.6
           Income tax (benefit) expense         36.8        (2.5)       1.6        13.8          25.6        (13.5)      (5.6)       9.7
           Interest expense, net                 4.3         5.5        9.1         6.6              7.6       7.7         7.5       8.2
           Depreciation and amortization        20.3        19.4       18.2        16.3          16.4         16.3        14.8      14.6
        EBITDA                               $184.0        $29.8     $40.4        $84.9        $128.7        $(7.0)      $19.2   $67.1
    A       Stock-based compensation             4.6         3.1        2.7         2.6              2.8       2.5         2.0       2.5
    B       (Gain) loss on sale of assets       (0.2)        0.1      (0.2)        (0.4)             0.1       0.1         0.1       0.1
    C       Financing fees                           --      0.7            --           --            --           --      --        --
    D       Acquisitions & other                 1.3         0.8        1.0         0.7              0.5       0.8         0.9       0.8
    E Adjusted EBITDA                        $190.6        $34.5     $43.9        $87.8        $132.1        $(3.6)      $22.2   $70.5

    A Represents stock-based compensation expense recorded during the period.

    B Represents any gain or loss associated with the sale of assets and termination of finance leases not in the ordinary course of
        business.
    C Represents fees associated with our debt refinancing and debt amendments.

    D Represents professional fees, retention and severance payments, and performance bonuses related to historical acquisitions.
        Although we have incurred professional fees, retention and severance payments, and performance bonuses related to acquisitions in
        several historical periods and expect to incur such fees and payments for any future acquisitions, we cannot predict the timing or
        amount of any such fees or payments.
    E Adjusted EBITDA excludes any earnings or loss of acquisitions prior to their respective acquisition dates for all periods presented.

                                                                                                                                             19
Non-GAAP reconciliations
Adjusted EBITDA Reconciliation
($ in millions) 2020 2019 2018 2017 2016 2015
Net income $121.3 $77.7 $73.9 $54.6 $30.6 $28.9
Income tax expense 27.5 13.8 1.3 18.0 21.3 19.5
Interest expense, net 31.0 33.4 32.1 25.2 22.1 11.4
Depreciation & amortization 67.2 59.5 52.3 43.1 37.0 31.2
EBITDA 247.0 $184.4 $159.6 $140.9 $111.0 $91.0
A Stock-based compensation 10.6 11.7 7.9 5.9 5.3 3.0
B (Gain) Loss on sale of assets (0.4) 0.3 (0.4) 0.6 -- 0.4
C Advisory fees -- -- -- -- 8.5 2.0
D Financing fees -- -- 0.8 1.7 4.6 5.5
E Acquisitions, rebranding & other 3.0 4.7 8.1 8.1 4.9 4.6
F Adjusted EBITDA $260.2 $201.1 $176.0 $157.2 $134.3 $106.5
A Represents stock-based compensation expense recorded during the period.
B Represents any gain or loss associated with the sale of assets not in the ordinary course of business.
C Represents fees paid to CD&R and Deere for consulting services. In connection with the IPO, we entered into termination agreements with
CD&R and Deere pursuant to which the parties agreed to terminate the related consulting agreements.
D Represents fees associated with our debt refinancing and debt amendments, as well as fees incurred in connection with our initial public offering
and secondary offerings.
E Represents (i) expenses related to our rebranding to the name SiteOne, (ii) professional fees, retention and severance payments, and
performance bonuses primarily related to historical acquisitions. Although we have incurred professional fees, retention and severance payments,
and performance bonuses related to acquisitions in several historical periods and expect to incur such fees and payments for any future
acquisitions, we cannot predict the timing or amount of any such fees or payments.
F Adjusted EBITDA excludes any earnings or loss of acquisitions prior to their respective acquisition dates for all periods presented.
20Non-GAAP reconciliations
2021 Organic Daily Sales Reconciliation
2021 2020
($ in millions) FY’21 Q4’21 Q3’21 Q2’21 Q1’21 FY’20 Q4’20 Q3’20 Q2’20 Q1’20
Reported Net Sales -- -- -- $1,083.9 $650.2 $2,704.5 $675.1 $751.9 $817.7 $459.8
A Organic Sales -- -- -- $975.0 $613.3 $2,629.3 $641.0 $732.7 $799.2 $456.4
B Acquisition contribution -- -- -- $108.9 $36.9 $75.2 $34.1 $19.2 $18.5 $3.4
Selling Days 253 61 63 64 65 256 65 63 64 64
Organic Daily Sales -- -- -- $15.2 $9.4 $10.3 $9.9 $11.6 $12.5 $7.1
A Organic Sales equals Net sales less Net sales from branches that were acquired in 2020 and 2021.
B Represents Net sales from acquired branches that have not been under our ownership for at least four full fiscal quarters at
the start of the 2021 fiscal year. Includes Net sales from branches acquired in 2020 and 2021.
21You can also read