Premium packaging solutions - Aluflexpack
←
→
Page content transcription
If your browser does not render page correctly, please read the page content below
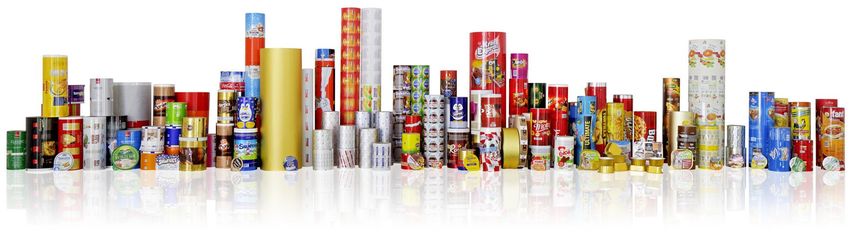
Premium packaging solutions

                              1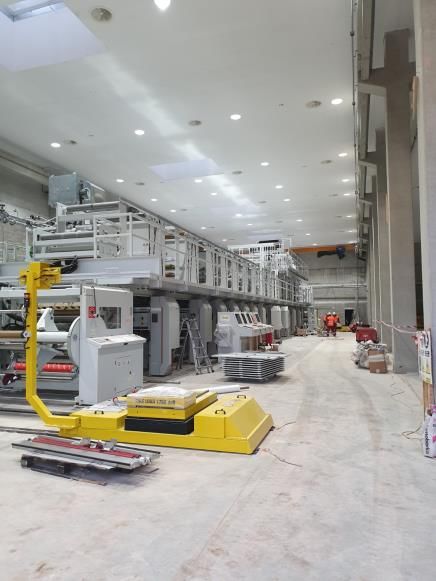
Aluflexpack AG
Full year results 2019
20 March 2020
Disclaimer

The information contained in this presentation is not for use within any country or jurisdiction or by any persons where such use would constitute a violation of law. If this applies to you, you are not
authorized to access or use any such information. The presentation may not be reproduced, published or transmitted, in whole or in part, directly or indirectly, to any person (whether within or outside
such person’s organization or firm) other than its intended recipients.

The attached information is not an offer to sell or a solicitation of an offer to purchase any security in the United States or elsewhere and shall not constitute an offer, solicitation or sale any securities of
Aluflexpack AG (Aluflexpack, Group) in any state or jurisdiction in which, or to any person to whom such an offer, solicitation or sale would be unlawful nor shall it or any part of it form the basis of, or be
relied on in connection with, any contract or investment decision. No securities may be offered or sold within the United States or to U.S. persons absent registration or an applicable exemption from
registration requirements. Any public offering of securities to be made in the United States will be made by means of a prospectus that may be obtained from any issuer of such securities and that will
contain detailed information about us. Any failure to comply with the restrictions set out in this paragraph may constitute a violation of the securities laws of any such jurisdiction. This presentation is not
an offering circular within the meaning of article 652a of the Swiss Code of Obligations, nor is it a listing prospectus within the meaning of the listing rules of the SIX Swiss Exchange or a prospectus
under any other applicable laws.

This presentation may contain “forward-looking statements” that are based on our current expectations, assumptions, estimates and projections about us and our industry. Forward-looking statements
include, without limitation, any statement that may predict, forecast, indicate or imply future results, performance or achievements, and may contain the words “may”, “will”, “should”, “continue”, “believe”,
“anticipate”, “expect”, “estimate”, “intend”, “project”, “plan”, “will likely continue”, “will likely result”, or words or phrases with similar meaning. Undue reliance should not be placed on such statements
because, by their nature, forward-looking statements involve risks and uncertainties, including, without limitation, economic, competitive, governmental and technological factors outside of the control of
Aluflexpack AG (Aluflexpack, Group), that may cause Aluflexpack’s business, strategy or actual results to differ materially from the forward-looking statements (or from past results). Nothing contained in
this presentation is or should be relied upon as a promise or representation as to the future. It is up to the recipient of the presentation to make its own assessment as to the validity of such forward-
looking statements and assumptions.

The information contained in the presentation does not purport to be comprehensive. Aluflexpack undertakes no obligation to publicly update or revise any information contained herein or forward-
looking statements, whether to reflect new information, future events or circumstances or otherwise. It should further be noted, that past performance is not a guide to future performance. Please also
note that interim results are not necessarily indicative of the full-year results. Persons requiring advice should consult an independent adviser. Some financial information in this presentation has been
rounded and, as a result, the figures shown as totals in this presentation may vary slightly from the exact arithmetic aggregation of the figures that precede them. While we are making great efforts to
include accurate and up-to-date information, we make no representations or warranties, expressed or implied, and no reliance may be placed by any person as to the accuracy and completeness of the
information provided in this presentation and we disclaim any liability for the use of it. Neither Aluflexpack nor any of its directors, officers, employees, agents, affiliates or advisers is under an obligation
to update, correct or keep current the information contained in this presentation to which it relates or to provide the recipient of it with access to any additional information that may arise in connection
with it and any opinions expressed in this presentation are subject to change.

In this presentation, we utilise certain alternative performance measures, including EBITDA, adjusted EBITDA, adjusted Operating Profit, organic growth, Working Capital ratio, and others that in each
case are not recognized under International Financial Reporting Standards (“IFRS”). These non-IFRS measures are presented as we believe that they and similar measures are widely used in the
markets in which we operate as a means of evaluating a company’s operating performance and financing structure. They may not be comparable to other similarly titled measures of other companies
and are not measurements under IFRS or other generally accepted accounting principles, nor should they be considered as substitutes for the information contained in the financial statements included
in this presentation. For a particular definition of any of the mentioned and non-mentioned alternative performance indicators please see either notes in this presentation or definitions in our HY2019
interim financial statement.

By receiving this Presentation, you agree to be bound by the foregoing limitations. Any failure to comply with these restrictions may constitute a violation of applicable securities laws.
This Presentation does not constitute investment, legal, accounting, regulatory, taxation or other advice.
THIS PRESENTATION IS NOT AN INVITATION TO PURCHASE SECURITIES OF ALUFLEXPACK AG OR THE GROUP.

                                                                                                                                                                                                                      3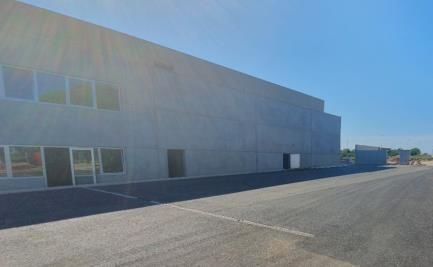
Executive summary

                                                                                  Increase in FY 2019 net sales by 14.4% to € 207.9m resulting
         Continuation of
                                                                                  from solid organic growth of 8.4% and full year consolidation
         growth path
                                                                                  effects of Turkish subsidiary(1).

                                                                                  Good business development across all key product end markets,
         End market                                                               in particular coffee/tea (+39% yoy), pet food (+16% yoy) and
         development                                                              dairy (+7% yoy).

                                                                                  Increase in adjusted EBITDA by 36.6% yoy to € 29.5m (14.2%
         Sustainable Earnings                                                     margin) and in adjusted EBIT by 72.8% yoy to € 13.8m (6.6%
                                                                                  margin).

                                                                                  Capex of € 32.8m directed to organic growth projects in 2019,
         Execution of growth
                                                                                  o/w majority relates to Stand-up-Pouch expansion and to
         strategy on track
                                                                                  additional capacities for other key end-markets

                                                                                  Net sales for the full year 2020 expected between € 220m and €
         Outlook
                                                                                  230m. EBITDA before one-off effects between € 32m and € 35m

Notes: Organic growth was calculated by comparing full year 2019 sales with pro forma 2018 sales of EUR 191.8 Mio. The latter include the effects from the Turkish subsidiary Arimpeks, which was acquired in September 2018, as if the company was
acquired on 1 January 2018.                                                                                                                                                                                                                           4
Financial Highlights - Sales
Growth of 14.4% in FY 2019, thereof 8.4% organic
Net sales
(in €m)
Drivers
• Strong organic growth of 8.4% as a result
of excellent service & product quality, and
focus on fast growing end markets
• Ramp-up of business with existing
customers, increasing volumes with
207.9 existing products and by introducing new
181.7 products
160.6
144.1 • Acquisition of new customers
• First business contribution from stand-up
pouch expansion
.
• Contributions from M&A activity
(Arimpeks, September 2018)
2016 2017 2018 2019
5End market dynamics
Strong business development across key end markets
End market growth rates for Aluflexpack Net sales split by end markets
(in %, yoy) (1) (2019)
39%
2%
14% 19%
16%
14%
€207.9m 18%
7%
4%
2%
14%
18%
Coffee/tea Dairy Pet food Pharma Confectionery
Coffee/tea Other food
Dairy Confectionery
-10%
Pet food Other non-food
Pharmaceutical
-19%
6Financial Highlights - Earnings
Improvement of adj. EBITDA to € 29.5m, margin to 14.2%
Adj. EBITDA Adj. Operating Profit (EBIT)
(in €m / margin in % of net sales)(1) (in €m / margin in % of net sales)(2)
10.0% 11.3% 11.9% 14.2% 2.3% 3.7% 4.4% 6.6%
29.5
21.6
13.8
18.1
14.4
8.0
5.9
3.3
2016 2017 2018 2019 2016 2017 2018 2019
Drivers
• Economies of scale, cost positions growing slower than top line
• Efficiency improvements across organisation
• Improved product mix
Notes: PARTLY UNAUDITED AND SUBJECT TO CHANGE; (1) Adjustments in 2018 include voluntary one-off bonuses to management paid by the majority shareholder in the amount of € 1.9m, the adoption of a pension plan in the amount of € 0.8m
and gains on the sale & lease back transaction in the amount of € 2.7m; adjustments in 2019 include voluntary one-off bonuses to management paid by the majority shareholder in the amount of € 8.1m, transaction cost for the initial public offering in
the amount of €3.5m, expenses in relation to the fire incident in the amount of € 5.4m and income in relation to the fire incident in the amount of € 7.1m, and € 0.4m in redundancy payments to former members of the Management Board (2) In addition
to the factors mentioned in (1), adjustments include acquisition related amortizations of € 1.6m in 2016, € 1,6m in 2017, € 1,6m in 2018 and € 2.0m in 2019, as well as impairments in relation to the fire incident in the amount of € 0.8m in 2019. 7Profit and Loss statement - overview
Sustainable level of earnings in 2019
(in M€) 2019 2018 DELTA (%) Comments
Net Sales 207,931 181,741 14.4 • Improvement in adj. EBITDA by
36.6% on the back of 1) economies of
Adjusted EBITDA(1) 29,463 21,563 36.6 scale, 2) efficiency gains, 3) product
mix and 4) full year consolidation of
Adjusted EBITDA margin 14.2% 11.9% Turkish subsidiary
Adjusted Operating Profit (EBIT)(1) 13,761 7,971 72.8 • Increase in adj. EBIT to € 13.8m
proves that investments into platform
Adjusted Operating Profit margin 6.6% 4.4% pay off
Financial result -2,081 -7,868 • Financial result improved to -€ 2.1m in
2019, amongst other things, due to
Result before tax -1,464 -1,511 decreased IC loans expenses
Result for the period -3,427 -1,314 • Due to one-off items, such as costs in
relation to the listing on the stock
o/w owners of the company -3,490 -1,272 exchange, the Result for the period
decreased to -€ 3.4m
o/w non-controlling interests 63 -42
Notes: (1) A detailed reconciliation between reported and adjusted numbers can be viewed in the appendix of this presentation
8Cost management
Improvement in material costs and other operating costs margins
Adj. material costs Adj. Other operating expenses
(in €m / in % of net sales)(1) (in €m / in % of net sales)(2)
65.4%
64.5% 12.6%
12.4% 12.2%
63.5% 63.4%
10.6%
117.3 131.8
94.3 102.0 20.3 22.1 22.1
17.8
2016 2017 2018 2019 2016 2017 2018 2019
Comments
Adj. Personnel expenses • In 2019, Material costs in % of net sales improved reaching a level
(in €m / in % of net sales)(3) clearly below the prior year mainly based on 1) efficiency gains such as
reduced production waste, 2) benefits from further integration of our
supply chain, and 3) product mix improvement
• Other operating costs in % of net sales decreased significantly in FY
2019, due to e.g. a lower relative share of energy and transportation
13.1% 13.5% 13.4% costs, and effects from the implementation of IFRS 16.
12.7%
• Personnel expenses stabilized in % of net sales in FY 2019, still being
24.5 28.0 impacted by an increase in workforce for the expansion in Umag where
18.4 21.0
additional people where employed for training purpose before operating
2016 2017 2018 2019 on the machines.
Notes: (1) Material costs is defined as Cost of materials, supplies and services less temporary personnel, less income from disposal from recycling products, less income from insurance), less income from claims and adjusted for changes in finished
and unfinished goods; (2) Adjusted for costs for listing on the sock exchange; (3) Adjusted for temporary personnel costs and one-off bonus payments paid by the majority shareholder
9Financial Position - overview
As of 31 December, 2019
(in T€) 31 Dec 2019 31 Dec 2018 DELTA (%) Comments
ASSETS
• Increase in non-current assets
Non-current assets 133,321 100,440 32.7 in the amount of € 133.3m due
o/w Property plant and equipment 102,197 68,508 49.2 to investments into platform,
o/w Intangible assets and goodwill 29,932 30,585 specifically into the Stand-up-
-2.1
Pouch expansion
o/w other non current assets 1,192 1,347 -11.5
Current assets 145,069 96,510 50.3 • Equity ratio of 61.9% underlines
o/w Inventories 48,721 49,390 -1.4 solid financial profile
o/w Trade receivables 22,830 22,630 0.9
o/w Other receivables and assets 10,695 5,514 94.0 • Net cash position of € 12.1m at
the balance sheet date
o/w Cash and cash equivalents 62,823 18,976 231.1
Total assets 278,390 196,949 41.4 • Decrease in working capital
resulting from stringent
management
EQUITY AND LIABILITIES
Total equity 172,188 25,927 564.1 • Decrease in liabilities on the
Non-current liabilities 48,189 84,116 -42.7 back of repayment of
Current liabilities 58,013 86,906 -33.2 shareholder loans
Total equity and liabilities 278,390 196,949 41.4
10Capital management
Trade Working Capital Ratio(1) decreased to 15.8% in 2019
Trade Working Capital (Ratio)
(in €m / in % of net sales)(1)
Comments
21.1%
• Despite increase in sales, inventories decreased by € 0.7m from
31 December 2018 to 31 December 2019
16.1% 15.8%
14.3% • Trade receivables remained relatively stable and increased by €
0.2m
38.3
32.7 • Increase in operative payables by € 5.2 driving improvement in
23.2 23 Trade Working Capital Ratio
2016 2017 2018 2019
Notes: (1) Working Capital is calculated as the sum of total inventories and trade receivables less total operative payables for a respective period.The Working Capital ratio is calculated by dividing end of period working capital through the sales of the
last 12 months.
11Invested platform to support future growth
CapEx and depreciation levels reflect expansion investments
Depreciation and amortization Capital expenditures
(in €m / in % of net sales)(1) (actuals in €m / CapEx-to-net sales ratio in %)
15.8%
13.2%
10.2%
8.8% 8.8%
8.6%
8.4%
8.3%
2.2 32.9
1.8
1.8 1.8
21.3
18.6
13.2 15.3
10.8 11.9 12.6
2016 2017 2018 2019 2016 2017 2018 2019
Depreciation Amortization
Note(s): (1) Depreciation and amortization net of impairments, Capex equals payments made for PPE
12Cashflow statement - overview
Operating cashflow distorted by one off items
(in T€) FY 2019 FY 2018 Comments
• Increase in cash and cash equivalents due to net cash
Cash and cash equivalents at the inflow from capital increase and contributions from
beginning of the period 18,976 3,778 operating cash flow
Net cash used in operating activities 15,450 11,949 • Operating cash flow improved by 29% yoy and was
negatively impacted by € 8.1m related to one-off bonus
payment paid by the majority shareholder, by the
Net cash used in investing activities -32,840 -21,178
recognition of a receivable in the amount of EUR 3.4
million for insurance compensation booked in other
Net cash from financing activities 60,064 24,378 receivables and assets and by FX effects in the amount
+/- effect of exchange rate fluctuations of EUR 2.5 million in relation to intercompany loans at
on cash held 1,174 50 the balance sheet date, which are offset in financing CF
Cash and cash equivalents at the end of
the period 62,823 18,976 • Investments of €32.8m mainly into expansion of Stand-
up-Pouch capacities
• Net inflow from cash flow from financing activities
based on capital increase of € 148m and repayments of
loans.
13Return on capital employed
ROCE(1) increased to 9.6% highlighting significant improvement of capital efficiency
Return on Capital Employed
(in %)(1)
Comments
9.6%
• Despite increase in capital employed as a result of the
6.9% investments in recent years, return on capital employed
5.9% (ROCE) increased to 9.6% in 2019.
3.8%
• Increase in ROCE underlines value-adding effects of
investments made into the platform over recent years.
2016 2017 2018 2019
Notes: (1) RROCE stands for return on capital employed and refers to Adjusted Operating Profit (EBIT) divided by capital employed, which is defined as average equity plus average net financial debt for a given period.
14Capital allocation 2019
€ 32.8m invested into future
Finalization of expansion of stand-up pouch
manufacturing capacities
Capex 2019 Additional capacities for Pharma and Coffee/tea, as
€ 32.8m well as Dairy and Confectionery end markets
Efficiency and product quality improvements
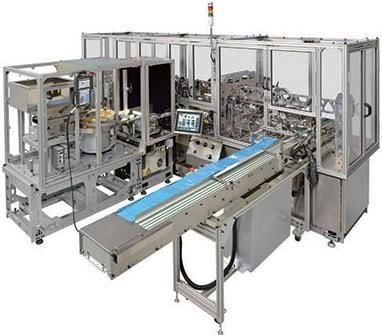
15Construction of Umag well advancing
Over € 25m already invested in infrastructure and new machinery
Rotogravure printing Slitter/ Rewinder/ Pouch-Making/ Spout/
1 & laminating machine 2 Laser 3 Thomson Die/ Zip 4 Infrastructure Umag
installed installed installed mainly completed
• • Pouch making and spout machines • Construction of main production
Rotogravure printing machine up • Rewinder and laser are up and
and running since Q3 2019. installed and running building almost finished
running
• • Theoretical installed capacity of • Recuperation connected
Laminator up and running since Q3 • Slitter installed
500m pcs since Q4 2019(1)
• Expansion incl. relocation of
machines and warehouse mainly
finished.
“1bn Pouches” expansion
• Installed capacity: 500m stand-up pouches p.a. by end Q3 20191
• Targeted end markets: Pet food, baby food, liquids etc.
• Production for selected blue chip customers
• Increased demand for high value-added products at industrial scale
• Potential features: zippers, spouts, special formats, etc.
Notes: (1) Stated capacity is referring to 100g standard format
16Strategic positioning
Focus on proven cornerstones in Aluflexpack’s business model
Development & Focus on Deep integration Leverage on
manufacturing of fast growing of the economies of
high value adding end markets value chain scale/operating
products leverage
Developments 2019
- Expansion in SUP Strengthen position Leverage existing Decrease of other
business in coffee/tea, pet lacquering, operating costs in
- Further develop- food and pharma extrusion, % of net sales
ment of coffee end markets lamination and achieved, e.g.
capsules and blister printing capacities energy and
foil business transportation costs
Source(s): Company information
17Major building blocks for accelerated growth
Capacity
Stand-up
expansion & Value accretive
pouch business
efficiency acquisitions
improvements
Organic growth Bolt-on M&A
18Disciplined M&A strategy…
…to further accelerate growth strategy
Cornerstones of AFP’s M&A strategy Criteria
Win new customers and offer them the whole range of
Customers products, strengthen positioning with existing customers
Strengthen AFP’s extended technology portfolio and
Operations supply chain integration to generate synergies
Strengthen AFP’s international presence with acquisitions
Geography in North America, Asia Pacific, MENA region and Europe
Extend product portfolio for existing customers,
Products strengthen positioning in existing target product markets,
improve product quality
19Outlook
• The full extent of the effects of the outbreak of COVID-19 on the business development of
Aluflexpack is not assessable at the moment. For the time being, Aluflexpack is not
experiencing a slowdown of demand or material problems in the supply of raw material
and remains fully focused on the execution of its growth strategy
• In light of the current market environment and given the current development pipeline,
Management Board expects above market growth for 2020, and Group net sales between
€ 220 and 230m and EBITDA before one-off items from €32 to 35m
• Q1 sales statements to be published on 5 May 2020
20Investor Relations
Contact Investor Relations Financial Calendar 2020
04.02.2020 FY 2019 Sales Statement
Lukas Kothbauer 20.03.2020 Publication of results for the full year ending 31 Dec. 2019
Head of Investor Relations and M&A 05.05.2020 Q1 Sales Statement
Phone: +43 664 858 1124 08.05.2020 Annual General Meeting
E-Mail: lukas.kothbauer@aluflexpack.com 24.08.2020 Publication of results for the half year ending 30 Jun. 2020
06.11.2020 Q3 Sales Statement
21Appendix
Income statement

(in T€)                                     2019       2018
Gross Sales                                 211,132   184,321
Sales deductions                             -3,201     -2,580
Net Sales                                   207,931   181,741
Change in finished and unfinished goods        720       2,641
Other operating income                       14,480     10,672
Cost of materials, supplies and services   -138,647   -125,344
Personnel expenses                          -35,796    -26,056
Other operating expenses                    -29,507    -22,144
EBITDA                                       19,181     21,510
Depreciation and amortisation               -18,565    -15,154
Operating Profit                               616       6,356
Interest income                                 66         5
Interest expenses                            -3,730     -3,923
Other financial income                        3,358      1,703
Other financial expenses                     -1,775     -5,653
Financial result                             -2,081     -7,868
Result before tax                            -1,464     -1,511
Tax expense/benefit                          -1,963       197
Result for the period                        -3,427     -1,314
Thereof attributable to:
    Owners of the company                   -3,490     -1,272
    Non controlling interests                 63         -42

                                                                 23
Balance Sheet – Assets
(in T€) 31 Dec 2019 31 Dec 2018
ASSETS
Intangible assets and goodwill 29,932 30,585
Property, plant and equipment 102,197 68,508
Other receivables and assets 154 114
Deferred tax assets 1,038 1,233
Non-current assets 133,321 100,440
Inventories 48,721 49,390
Trade receivables 22,830 22,630
Other receivables and assets 10,695 5,514
Cash and cash equivalents 62,823 18,976
Current assets 145,069 96,510
TOTAL ASSETS 278,390 196,949
24Balance Sheet – Equity and Liabilities
(in T€) 30 Jun 2019 31 Dec 2018
Capital stock 15,553 86
Capital reserves 135,887 1,958
Retained earnings 19,802 23,000
Equity attributable to owners of the Company 171,242 25,044
Non controlling interests 946 883
Total equity 172,188 25,927
Loans from affiliated companies 0 43,979
Bank loans and borrowings 22,916 23,527
Other financial liabilities 18,377 9,934
Deferred tax liabilities 4,536 4,343
Employee benefits 1,715 1,383
Other liabilities 645 950
Non-current liabilities 48,189 84,116
Bank loans and borrowings 6,080 17,581
Loans from affiliated companies 0 23 776
Other financial liabilities 3,392 923
Current tax liabilities 1,288 978
Provisions 117 23
Employee benefits 1,453 978
Trade payables and advances received from customers 38,881 33,695
Accruals 2,765 2,316
Other liabilities 4,037 6,636
Current liabilities 58,013 86,906
TOTAL LIABILITIES 106,202 171,022
TOTAL EQUITY AND LIABILITIES 278,390 196,949
25Cash flow statement
(in T€) 2019 2018
Income/Loss before tax -1,464 -1,511
+/- Financial results excluding other financial income/expense 3,663 3,918
+/- Other non-cash expenses and income -3,928 -178
+ Costs of initial public offering 2,751 0
+ Depreciation and amortization 18,565 15,154
-/+ Gains and losses from disposals of PPE and intangible assets 0 -2,695
-/+ increase and decrease in inventories 694 -5,165
-/+ Increase and decrease in trade receivables -215 -2,089
-/+ Increase and decrease in other receivables and assets -5,244 1,393
+/- Increase and decrease in trade payables 3,298 -777
+/- Increase and decrease in accruals 446 12
+/- Increase and decrease in other liabilities -2,907 3,171
+/- Increase and decrease in provisions 91 671
+/- Increase and decrease in liablities for employee benefits 769 -7
-/+ Income taxes paid -1,069 51
Net cash provided / used in operating activities 15,450 11,949
+ Payments received for disposals of PPE and intangible assets 0 14,595
- Payments made for purchases of PPE and intangible assets -32,907 -18,605
- Payments for acquisition of subsidiaries 0 -17,178
+ Interest received 66 5
+/- Other payments received/made for investing activities 0 4
Net cash used in investing activities -32,840 -11,419
+ Proceeds from issuance of share capital 148,038 0
- Payments for the costs of initial public offering -9,505 0
+ Issuance of share capital 0 86
+ Contribution in kind 8,123 1,958
- Payments of lease liabilities (2018: payments of financial lease liabilities) -4,232 -1,661
+ Issuances of financial liabilities (3rd parties) 5,246 9,860
+ Issuances of financial liabilities (MTC group companies) 0 26,192
- Repayments of financial liabilities (3rd parties) -17,333 -10,103
- Repayments of financial liabilities (MTC group companies) -67,755 -36
- Interest paid -2,519 -1,918
26
Net cash from financing activities 60,064 24,378Overview of earnings adjustments
ADJUSTMENTS ON EBITDA LEVEL (in T€) 2019 2018
EBITDA - IFRS reported 19,181 21,510
Transaction costs of the initial public offering and other related expenses 3,473 0
Extraordinary personnel expenses1 8,110 1,911
Expenses in relation to fire incident2 5,419 0
Income in relation to fire incident3 -7,090 0
Redundancy payment to former members of the Management Board 370 0
Gain from divestment of property, plant and equipment 0 -2,695
One-off pension plan adoption according to IAS 19 0 836
EBITDA - adjusted 29,463 21,563
ADJUSTMENTS ON EBIT LEVEL (in T€) 2019 2018
Operating Profit (EBIT) - IFRS reported 616 6,356
Transaction costs of the initial public offering and other related expenses 3,473 0
Extraordinary personnel expenses1 8,110 1,911
Expenses in relation to fire incident2 5,419 0
Income in relation to fire incident3 -7,090 0
Redundancy payment to former members of the Management Board 370 0
Gain from divestment of property, plant and equipment 0 -2,695
One-off pension plan adoption according to IAS 19 0 836
Acquisition related amortizations 1,977 1,544
Impairment in relation to fire incident4 886 0
Operating Profit (EBIT) - adjusted 13,761 7,963
Notes: (1) Voluntary one-off bonus payment to management by majority shareholder; (2) Expenses refer to write off of stock and other expenses in relation to the fire incident that occurred at Eliopack on 24 June 2019 and exclude write-offs of book values
of tangible assets (3) Income refers to reimbursements for stock write off, other expenses and replacement values of tangible assets in relation to the fire incident that occurred at Eliopack on 24 June 2019 (4) Impairments were made to technical equipment
in relation to the fire incident that occurred at Eliopack on 24 June 2019; 27You can also read