FIXED INCOME PRESENTATION - September 2019 - Merlin Properties
←
→
Page content transcription
If your browser does not render page correctly, please read the page content below

FIXED INCOME
PRESENTATION
September 2019

DISCLAIMER

This presentation has been prepared by          Certain statements in this document            presentation in other jurisdictions may        RELIED ON IN CONNECTION WITH ANY
MERLÍN Properties, SOCIMI, S.A. (the            regarding the market and competitive           also be restricted by law and persons          CONTRACT OR COMMITMENT TO SELL
Company) for informational use only.            position data may be based on the              into whose possession this presentation        OR PURCHASE SHARES. ANY DECISION
                                                internal analyses of the Company,              comes should inform themselves about           TO SELL OR PURCHASE SHARES IN ANY
The information contained in this
                                                which involve certain assumptions and          and observe any such restrictions. In          OFFERING SHOULD BE MADE SOLELY
presentation does not purport to be
                                                estimates. These internal analyses may         particular, any offer that might result from   ON THE BASIS OF PUBLICLY AVAILABLE
comprehensive or to contain all the
                                                have not been verified by any independent      the transaction herein escribed will not be    INFORMATION.
information that a prospective purchaser
                                                sources and there can be no assurance          made, directly or indirectly, in the United
of securities of the Company may desire                                                                                                       This presentation may include forward-
                                                that the assumptions or estimates are          States of America, or by use of mails, or by
or require in deciding whether or not to                                                                                                      looking statements. These forward-
                                                accurate. Additionally, certain information    any means or instrumentality (including,
purchase such securities, and has not                                                                                                         looking statements involve known and
                                                in this presentation may be based on           without limitation, facsimile transmission,
been verified by the Company or any                                                                                                           unknown risks, uncertainties and other
                                                management accounts and estimates of           telephone and internet) of interstate or
other person. The information contained                                                                                                       factors, which may cause such actual
                                                the Company and may have not been              foreign commerce of, or any facilities of
in this document is subject to change                                                                                                         results, performance or achievements, or
                                                audited or reviewed by the Company’s           any national securities exchange of, the
without notice. Neither the Company                                                                                                           industry results, to be materially different
                                                auditors, whereas the information              United States, Canada, Australia or Japan.
nor any of affiliates, advisors or agents                                                                                                     from those expressed or implied by
                                                on certain competitors contained               The securities of the Company have not
makes any representation or warranty,                                                                                                         these forward-looking statements. These
                                                herein is based on publicly available          been and, should there be an offering, will
express or implied, as to the accuracy                                                                                                        forward-looking statements are based
                                                information which has not been verified        not be registered under the U.S. Securities
or completeness of any information                                                                                                            on numerous assumptions regarding the
                                                by the Company. Accordingly, recipients        Act of 1933, as amended (the Securities
contained or referred to in this document.                                                                                                    present and future business strategies
                                                should not place undue reliance on this        Act) and, subject to certain exceptions,
Each of the Company and its employees,                                                                                                        of the Company and the environment in
                                                information.                                   may not be offered or sold in the United
officers, directors, advisors, agents or                                                                                                      which they expect to operate in the future.
                                                                                               States. The securities of the Company have
affiliates expressly disclaims any and all      This information is provided to the                                                           Forward-looking statements speak only
                                                                                               not been and, should there be an offering,
liabilities whatsoever (in negligence or        recipients for informational purposes                                                         as of the date of this presentation and the
                                                                                               will not be registered under the applicable
otherwise, whether direct or indirect, in       only and recipients must undertake their                                                      Company expressly disclaim any obligation
                                                                                               securities laws of any state or jurisdiction
contract, tort or otherwise) for any loss       own investigation of the Company. The                                                         or undertaking to release any update
                                                                                               of Canada or Japan and, subject to certain
howsoever arising from any use of this          information providing herein is not to                                                        of, or revisions to, any forward-looking
                                                                                               exceptions, may not be offered or sold
presentation, the information contained         be relied upon in substitution for the                                                        statements in this presentation, any
                                                                                               within Canada or Japan or to or for the
or referred to therein, any errors therein or   recipient’s own exercise of independent                                                       change in their expectations or any change
                                                                                               benefit of any national, resident or citizen
omissions therefrom or otherwise arising        judgment with regard to the operations,                                                       in events, conditions or circumstances on
                                                                                               of Canada or Japan.
in connection with this presentation.           financial condition and prospects of the                                                      which these forward-looking statements
Neither the Company, nor any of its             Company.                                       THIS PRESENTATION DOES NOT                     are based.
affiliates, advisors or agents undertakes                                                      CONSTITUTE OR FORM PART OF ANY
                                                Neither this presentation nor any copy                                                        In reviewing this presentation, the
any obligation to provide the recipients                                                       OFFER FOR SALE OR SOLICITATION OF
                                                of it shall be taken, transmitted into,                                                       recipient is agreeing to, and accepting, the
with access to additional information or                                                       ANY OFFER TO BUY ANY SECURITIES IN
                                                disclosed, diffused, send, published or                                                       foregoing restrictions and limitations.
to update this document or to correct any                                                      THE UNITED STATES OR IN ANY OTHER
inaccuracies in the information contained       distributed in the United States, Canada,      JURISDICTION, NOR SHALL IT OR ANY
or referred to therein.                         Australia or Japan. The distribution of this   PART OF IT FORM THE BASIS OF OR BE

                                                                                                                                                                                       ı2ı
Contents

Strategy
Positioning
Value Creation
Capital Structure
Sustainability
History    |

         FIVE INTENSE YEARS TO POSITION MERLIN AS THE LEADING SPANISH REIT
         AND AMONG THE TOP 10 EUROPEAN REITS

         2014                                    2015                                            2016                                      2017                           2018                  2019
Acquisition of
Tree portfolio                                           Acquisition                             Acquisition      Sale of hotel                  Investment in                                 Acquisition
   (888 BBVA     Acquisition         Acquisition         of 47 assets             Acquisition of of 40            portfolio and   Acquisition    refurbishment   Acquisition   Sale of Testa   of 3 assets
    branches)    of 12 assets        of Testa            and ZAL Port             Metrovacesa    assets           10 assets       of 11 assets   & development   of 6 assets   & non-core      in Portugal
      € 740M     € 544M              € 1.6bn             € 331M                   € 1.7bn        € 812M           € 761M          € 388M         € 109M          € 570M        € 594M          € 125M

       July                               June                                     June                           Dec.
        2014      2014                    2015            2015                     2016               2016        2016            2017             2017          2018          2018             2019

  June             Dec.          May              Dec.           Dec.          Feb.       2016          Oct.                             2017                      Feb.          Dec.          Apr.
  2014             2014          & July           2015           2015          2016                     2016                                                       2018          2018          2019
                                 2015

  € 1.3bn        Refinancing    € 1.7bn          Inclusion       Refinancing   BBB        2 bond        Baa 2                          2 bond                     BBB           Refinancing    ESG
  IPO            of Tree debt   Capital          in IBEX 35      of Testa      S&P        issuances     Moody’s                        issuances                  positive      of Tree debt   Indexed
                 € 940M         increase         Index           debt          rating     € 1.7bn       rating                         € 900M                     outlook       € 717m         financing
                                                                 € 1.7bn                                                                                          S&P                          € 1.55bn
                                                                                                                                                                  rating

                                                                                                                                                                                                      ı4ı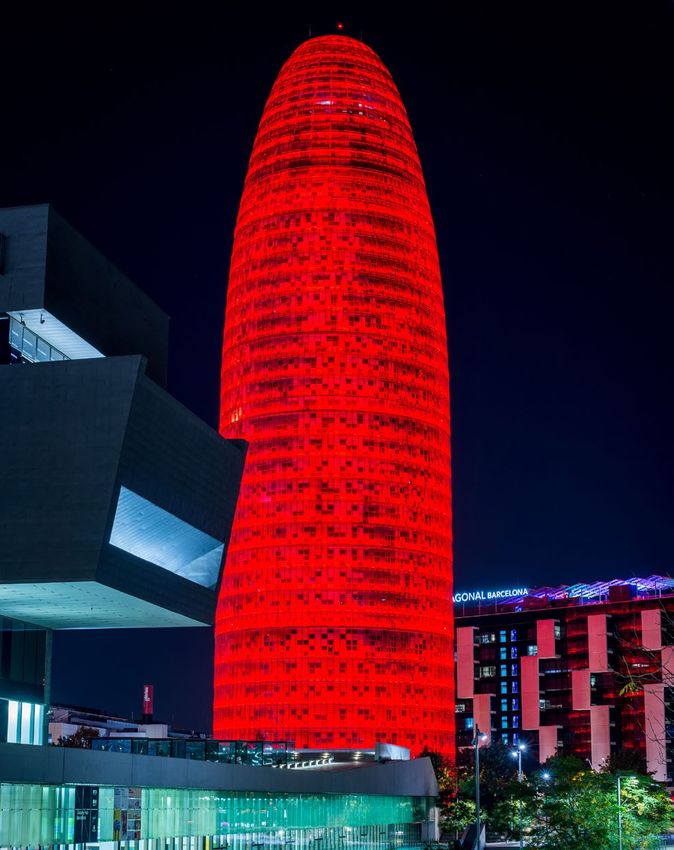
MERLIN today    |    Overview

LARGEST AND MOST DIVERSIFIED SPANISH REIT

   Fast facts                                                                Portfolio breakdown                                            Capital structure

       999                                                                                     4%                                                 > € 6.0bn
       ASSETS        (1)                                                             9%                                                           MARKET CAP

       € 12.4bn                                                                                                                             € 7.1bn / € 15.11
                                                                             18%                                      50%
       GAV                                                                                by GAV           (2)                             EPRA NAV PER SHARE

       € 524m                                                                                                                                          41.0%
       GRI                                                                        19%                                                                      LTV

       >4.4m sqm                                                                               3%
                                                                                                                                                   6.0 years
       GLA OWNED              (1)
                                                                                   10%                                                            AV. MATURITY

       93%                                                                                                                                              2.0%
       OCCUPANCY RATE                                                        19%                                      46%                     AV. INTEREST RATE
                                                                                            by GRI(1)
       4.6%                                                                                                                                              BBB
       GROSS YIELD                                                                                                                          STANDARD & POOR’S
                                                                                  22%

       5.7 years                                                        Offices     Shopping Centers        High Street retail
                                                                                                                                                        Baa2
       WAULT                                                                                                                                          MOODY’S
                                                                                       Logistics      Other(3)

Company 6M2019
(1)
    Fully consolidated excluding assets where MERLIN holds a minority stake
(2)
    GAV of land under development and NAV of equity method included in its respective category (offices, shopping centers and logistics)
(3)
    Includes 3 hotels, non-core land and miscellaneous
                                                                                                                                                                  ı5ı
Strategy
Strategy    |    Strategy pillars

 A CLEARLY DEFINED STRATEGY INSPIRED BY THE BEST REIT PRACTICES

           Office                                                                  Shopping Centers

         40        %
  Breadth of prime space                           Core & Core Plus
                                                                                         20       %
                                                                                     Urban or Dominant
Madrid, Barcelona and Lisbon                       Spain & Portugal                    National scale

                                           Best                       Investment
                                     governance                       grade
                                       practices                      capital
                                                                      structure

                                             One of              Dividend
                                         the world’s             policy:
                                          most cost              80% of
                                            efficient            AFFO
             Logistics                        REIT’s                                High Street Retail

             20        %
        National footprint
                                                                                         20       %
                                                                                   High triple net cash flow
 “One-stop shop” solution for 3PL                                                     Inflation multiplier

                                                                                                               ı7ı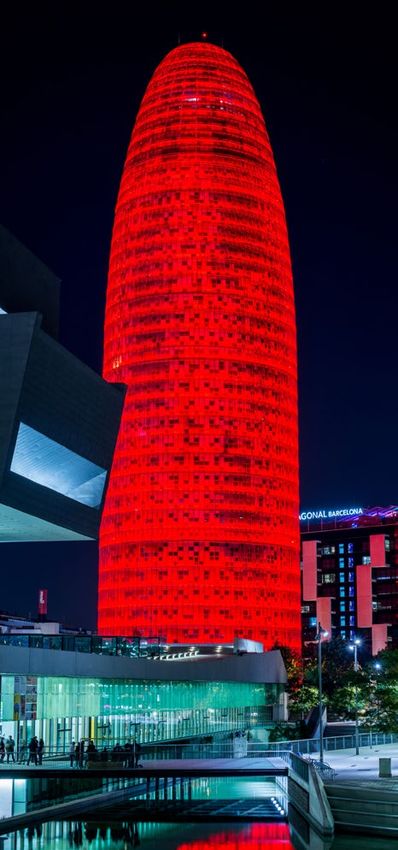
Strategy    |    Asset categories evolution (by GRI)

LOGISTICS, THE FASTEST GROWING ASSET CATEGORY SINCE 2014

                                2014                                                                2018                                             2019 PF(1)
                                                                                                                                                                (1)

                                5  %
                                                                                                    3%                                                     2
                                                                                                                                                           %
                  12%                                               Hoteles
                                                                                              10%                        Hoteles
                                                                                                                                                   16%
                                                                    Residencial en alquiler                              Residencial en alquiler

          14%                                         69%           Otros
                                                                                18%                                46%   Otros
                                                                                                                                     16%                                  45%
                                                                    Logístico                                            Logístico

                                                                     Oficinas                                            High Street Retail

                                                                     Centros comerciales                                  Centros comerciales

                                                                    High Street Retail                                    Oficinas
                                                                                         23    %
                                                                                                                                                   21%
                                                                                                                                                     (1)

                               Offices                     High Street Retail                       Shopping centers        Logistics                          Other(2)

(1)
      Pro-forma to include logistics WIP and offices WIP
(2)
      Other includes hotels, non core land and miscellaneous
                                                                                                                                                                                ı8ı
Positioning
Positioning    |    Fast facts

#1 REIT ACROSS ALL ASSET CATEGORIES WHERE MERLIN OPERATES
                                                                                                           FULLY CONSOLIDATED(1)

                                                                                                           148 ASSETS
                                                   #1
                                                                •F  lexibility to offer multitenant
                                                                   or headquarter buildings
                                                                                                           1,434 K SQM
                                                                • Capacity to adapt to the needs
                                           Office                  of the tenant
                                                                                                           € 6.1 BN GAV
                                                                                                           € 244 M GRI
                                                                                                                                         MINORITY STAKES(2)

                                                                                                                                         TRES AGUAS 50%
                                                   #1            •M  ainly urban footprint in high GDP/
                                                                    capita areas in Spain
                                                                                                           18 ASSETS
                                                                                                           544 K SQM
                                                                                                                                         1 ASSET
                                                                                                                                         68 K SQM
                                 Shopping                        • Reference landlord for top retailers   € 2.3 BN GAV
                                   Centers                       • Critical mass with retail brands       € 119 M GRI
                                                                                                                                         € 9 M GRI

                                                                 • “ One-stop-shop” solution for
                                                                                                           Existing       WIP            ZAL PORT 48.5%

                                                   #1                logistics operators wishing to
                                                                     operate across Spain
                                                                 • Big footprint to match the rapid
                                                                                                           47 ASSETS
                                                                                                           1,087 K SQM
                                                                                                                          14 PROJECTS
                                                                                                                          1,076 K SQM
                                                                                                                                         50 ASSETS
                                                                                                                                         469 K SQM
                                   Logistics                         development of 3PL activity
                                                                                                           € 0.8 BN GAV   € 0.7 BN GAV   (+258 SQM WIP)
                                                                                                           € 50 M GRI     € 48.3 M GRI   € 46 M GRI(3)
                                                                                                                                         (+€ 22 M GRI WIP)(3)

                                                   #1           •E  xcellent conditions of BBVA lease
                                                                   agreement: triple net lease with
                                                                                                           760 ASSETS
                                                                                                           396 K SQM
                            High Street                            1.5x HICP annual uplift
                                                                • O
                                                                    ptimization of retail space in        € 2.2 BN GAV
                                  retail                           office buildings                        € 98 M GRII

(1)
     M19 reported figures. Office includes adquisitions post 6M19
    6
(2)
    Data for Minority Stakes is reported for 100% of the subsidiary
(3)
    Pre canon                                                                                                                                             ı 10 ı
Positioning | Offices overview
PRIME SPACES IN BOTH CBD AND NBA OFFERING A WIDE VARIETY OF SOLUTIONS TO CLIENTS
Fast facts Breakdown
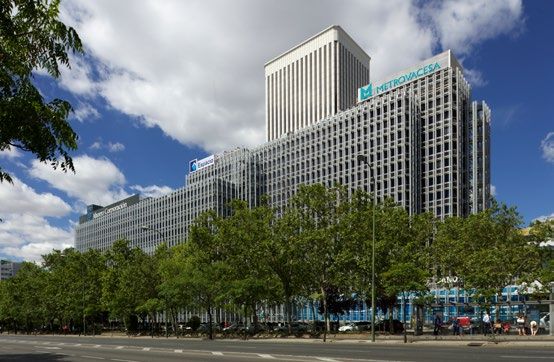
Reversion in MVC assets
By geography By location By product
Otros Periferia
# ASSETS 148 Lisbon NBA
Barcelona Prime + CBD
GLA (sqm) 1,434 k By GAV Madrid By GAV By GAV
GAV (€ M) 6,109
GRI (€ M) 244
• Madrid 76% • Prime + CBD 41% • Multi tenant 67%
GROSS YIELD 4.1% • Barcelona 17%
• Lisbon 6%
• NBA 48%
• Periphery 11%
• Single tenant 33%
• Other Spain 1%
OCCUPANCY 90%
1,048K MAD
254K BCN
113K LISBON
Lorem ipsum
Top 10
tenants
ı 11 ıPositioning | Shopping Centers overview
URBAN AND DOMINANT ASSETS OFFERING NATIONAL SCALE IN HIGH GDP/CAPITA AREAS
Fast facts Breakdown
Reversion in MVC assets
Fully Tres By geography By type By size(2)
Consol. Aguas (1) Other
# ASSETS 18 1 Andalusia
Valencia
GLA (sqm) 544 k 66 k By GAV Galicia By GAV By GAV
GRI (€ M) 119 9 Catalonia
Madrid
GAV (€ M) 2,292(3) Lisbon
• Lisbon 21% • Valencia 11% • Urban 48% • Extra-large 35%
GROSS YIELD 5.3% • Madrid 14% • Andalusia 7% • Dominant 39% • Large 36%
• Catalonia 15% • Other Spain 18% • Secondary 13% • Medium 23%
OCCUPANCY 93%(4) • Galicia 14% • Small 6%
ANNUAL
FOOTFALL 108 m pax
Top 10
tenants
(1)
100% of Tres Aguas of which MERLIN owns 50%
(2)
As per the definition of AECC (Spanish Shopping Center Association)
(3)
Including WIPs at book value
(4)
Excluding X-Madrid, Monumental and retail units under development ı 12 ıPositioning | Logistics overview
NATIONAL FOOTPRINT IN MAIN LOGISTICS HUBS
Fast facts Breakdown
Reversion in MVC assets
Existing WIP By reach BySpain
OtherOther
Spain tenant type
Consolidated ZAL Port(1) Consolidated ZAL Port(1) OtherBasque country
Spain Basque
Other Spain
country
BasqueSeville
country Basque country
# ASSETS 45 44 14 6 Seville
Seville Seville
Barcelona
Barcelona
GLA (Sqm) 1,087 k 469 k 1,076 k 258 k By GAV Barcelona BarcelonaBy GAV
MadridMadrid
+2.9m sqm under management Madrid Madrid
GAV (€ m) 847 607
• Madrid
•• Madrid
58%58%
Madrid 58%• Madrid 58% • National
• National
National39% • National
39% 39% 39% • 3PL •mono-client
• 3PL
3PL•mono-client
3PL 41% 41% 41%
mono-client
mono-client 41%
GRI (€ m) 50 32 48(2) 22
• Catalonia
•• Catalonia
(2)
27%
Catalonia 27%•
27% Catalonia 27% • Ports 32%
32% •
• Ports 32%
Ports Ports 32% • 3PL • 3PL • 39% 39%
• 3PL multi-client 39%
multi-client
multi-client 3PL multi-client 39%
••• Basque
• Sevilla 6% 6% • Sevilla 6% •• Regional • Regional • End•user • End
Sevilla 25%
25% 25% 20% user 20%
Sevilla 6% •
Regional
Regional 25% End End20%
•user user 20%
• 5% Country 5%• Production related
•
GROSS YIELD 5.9% 7.9% • • Other
Basque
Country
Country
• Basque
Basque
5%
Country
Spain •
4%
5%
Other Spain 4%
Production
4%
Production
• • Production related 4%
related 4%
related 4%
• Other
• Other 4% 4%
SpainSpain
By geography
OCCUPANCY 96% 98% n.a. 100% Other Spain
Basque country
• Madrid 58% • National 39%
• Catalonia 27% Seville
• Ports 32%
By GAV • Sevilla 6% • Regional 25%
Barcelona
• Basque Country 5% • Production rela
Madrid
• Other Spain 4%
• Madrid 58% • National 39% • 3PL mono-clien
• Catalonia 27% • Ports 32% • 3PL multi-client
• Sevilla 6% • Regional 25% • End user 20%
Top 10
• Basque Country 5% • Production related 4%
• Other Spain 4%
tenants
(1)
Figures reported for 100% of ZAL Port
(2)
Total expected gross rents. GAV includes acquisition cost plus estimated Capex
ı 13 ıFY 16 Financial Results summary FY18
Positioning | GAV
Gross yield 4.1% 5.3% 4.4% 5.9% - 4.5%
12,375
12,173
6,096
GAV
TOTAL with minority stakes
(€ million)
Shopping centers
High Street Retail
2,292 2,229
Minority stakes
Logistics
Offices
TOTAL
Other(1)
847 709
202
€/sqm AG 4,437 4,293 5,631 779 2,564
Source: Company
(1)
Other includes logistics WIP, office WIP, land for development, non-core land and miscellaneous
ı 14 ıPositioning | Occupancy and WAULT
96% 100%
90% 93%
93%
AVERAGE
OCCUPANCY
17.6
5.7 years
2.9 4.3 AVERAGE
WAULT
2.5
Offices Shopping centers Logistics High street retail
ı 15 ıPositioning | Trading update 6M2019
VERY GOOD PERFORMANCE AND PROSPECTS ACROSS THE BOARD
Rent LfL sqm Release
#contracts
YoY(1) contracted spread(2)
Office +8.3% 245,979 +6.1% 197
Shopping Centres +3.9% 51,405 +2.9% 153
High street retail +2.7% - - -
Logistics +6.2% 66,824 +5.0% 14
Other (5.3%) - - -
TOTAL +5.7% 364,208 364
(1)
ortfolio in operation for the 6M19 (€ 241.5m of GRI) and for the 6M18 (€ 228.6m of GRI)
P
(2)
LTM Change in rent in renewals and relets
ı 16 ıValue creation
Value creation | Growth Plans 2019-2022
Offices Shopping Centers
LANDMARK I PLAN FLAGSHIP PLAN
Upscaling refurbishments Converting our shopping centers
to create “prime within the prime” Organic in the flagship store of online retail
growth
SELECTED € 519m € 202m DEVELOPMENT OF “X”
DEVELOPMENTS A BRAND NEW CONCEPT
Designed Internally
by signature funded
architects
Logistics include
forward purchase,
Logistics spec development High Street Retail
BEST II PLAN € 327m and built to suit TREE
Lever on inflation growth
BEST III PLAN € 284m(1) OTHER
Development of the best footprint Total pending CAPEX Capturing reversion
in the Iberian market 2019-2022
€ 803m
(1)
€ 284m until 2022. Total investment for the Best III plan amounts to € 308m
ı 18 ıValue creation | Landmark I - Update
Torre Torre Marqués de Castellana Diagonal Adequa Adequa Plaza Ruiz Alfonso
Monumental
Charmartín Glòries Pombal 3 85 605 7 4 Picasso XI
GLA (sqm) 18,295 37,614 12,460 22,387 15,254 14,795 32,109 15,793 31,576 9,945
Acquisition
(€m) 31.2 142.0 - - - - 64.5 28.2 - -
Capex (€m) 38.0 27.2 1.6 28.9 25.1 8.6 43.8 16.8 49.7 13.0
Rent (€m) 4.6 11.8 0.2 2.5 2.4 1.8 8.4 3.6 3.2 1.4
Yield on Cost 6.7% 7.0% 9.4% 8.7% 9.7% 20.9% 7.8% 7.9% 6.5% 11.1%
2019 2019
Delivery 2019 2020 2020 2020 2021 2022 2022 2022
(Phase II) (Phase II)
Total Acquisition Total Capex Total investment Pending Capex Additional Rents Yield on Cost
€ 266.0m € 252.6m € 518.6m € 200.6m € 40.0m 7.7%
ı 19 ıValue creation | Landmark I - Successful delivery on Torre Glòries
Redesigned to welcome Returns
Barcelona’s business future
• Acquisition € 142.0m
Reconversion into
• Capex € 27.2m
multi-tenancy
• Total investment € 169.1m
Lobby & communal areas
• ERV € 11.8m
Amenities & Flex space
• Yield on cost 7.0%
Observatory
(vs 6.5% underwriting)
Total investment € 27.2m
5 businesses in 1 asset Fast execution of lease-up
• Office 29,073 sqm • Full occupancy of office space
• Observatory 2,906 sqm • € 23.0/sqm/m average rent
signed vs € 20.4/sqm/m
• Flex space 2,429 sqm(1) Original BP (+12.7%)
• Amenities 4,340 sqm
• Advertising+storage 1,143 sqm
ı 20 ı
(1)
Part of the office 29,073 sqmValue creation | Flagship - update
Arturo Soria
Larios X-Madrid Tres Aguas(1) El Saler Porto Pi Callao 5
Plaza
GLA (sqm) 41,460 6,985 47,424 67,690 47,013 58,779 11,629
GLA MERLIN (sqm) 37,822 6,069 47,424 33,845 28,978 32,568 11,629
Works: 28.1 Works: 35.2 Works: 25.1 Works: 21.1
Capex (€m) 5.4 10.1 19.4
Ad. GLA: 19.9 Investment: 10.5 Ad. GLA: 12.0 Ad. GLA: 15.2
Rent (€m) 3.1 0.6 5.4 1.5 2.0 1.7 3.9
Yield on Cost 6.4% 11.1% 11.8% 15.1% 5.5% 4.6% 20.2%
Delivery 2019 2019 2019 2019 2020 2021 2021
∆ GLA + X-Mad inv. Total Capex Total investment Pending Capex Additional Rents Yield on Cost
€ 57.5m € 144.4m € 201.9m € 109.0m € 18.2m 9.0%
(1)
Only including MRL 50% ı 21 ıValue creation | Flagship - Successful delivery of Arturo Soria
Deep re-do Capex 100% Occupancy Yield on Capex
of common € 5.4m + 3.4% Tenant sales 11.1%
areas and
acceses
Make over of
Terrace & Parking
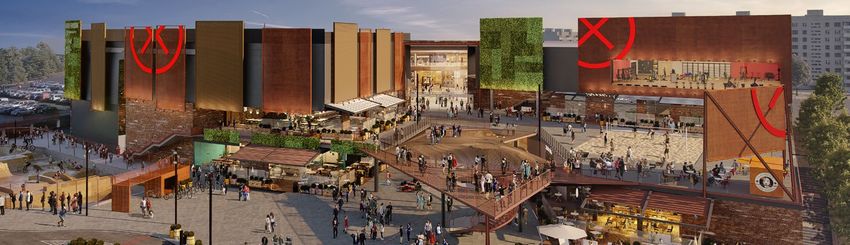
ı 22 ıValue creation | Flagship - X-Madrid achieving high pre-leasing rate
X-MADRID: A NEW CONCEPT TO BE LAUNCHED IN 4Q 2019
Experience
Ground breaking Diving
citywave®
mall focused on Surfing Madrid
experiences and Climbing
cutting edge Escape room Gourmet dining
retailers Gourmet dining
VIP cinemas
Cutting edge retailers
92% Pre-let € 5.4m ERV
Main anchors € 11.8%
secured Yield on cost
ı 23 ıValue creation | Flagship - Compelling returns prospects for Larios
A full Buying 95% pre-let € 19.9m Additional space
refurbishment additional space additional space € 28.1m Capex
nearing to expand + 8.9% release € 48.0m Total investment
completion anchors and spread in recent 6.4% Yield on cost
retenant to grow renewals
F&B experience
ı 24 ıValue creation | Best II - Update
ED
ER
IV
EL
D
Guadalajara Guadalajara
Madrid Guadalajara Guadalajara Toledo Madrid Guadalajara Guadalajara
Cabanillas Cabanillas
Pinto II B(1) Cabanillas F Cabanillas III Seseña San Fernando II Azuqueca III Azuqueca II
Park I extension Park II
GLA (sqm) 29,473 20,723 21,879 28,541 34,224 51,000 92,994 98,757 210,678
Capex (€m) 13.7 10.7 11.8 15.5 21.7 30.1 56.0 54.7 112.4
Rent (€m) 1.2 0.8 0.9 1.2 1.9 2.3 3.9 4.4 8.5
Yield on Cost 8.5% 7.6% 7.4% 7.5% 8.9% 7.5% 6.9% 8.1% 7.5%
Delivery 2019 2019 2019 2019 2020 2020 2020 2021 2021
Total investment Pending Capex Additional Rents Yield on Cost
€ 326.6m € 228.1m € 25.0m 7.7%
(1)
2nd phase of Pinto II only ı 25 ıValue creation | Best II
BEST II FOCUSED ON THE 2 MAIN LOGISTICS CORRIDORS OF MADRID
+680K sqm € 25m
GLA ERV
Madrid
€ 327m 7.7%
Investment Yield on Cost
ı 26 ıValue creation | Best III
LAUNCH OF BEST III TO EXPAND FOOTPRINT TO OTHER AREAS OF THE IBERIAN PENINSULA
Valencia Zaragoza Madrid Sevilla Lisbon
Valencia
Ribarroja Plaza II San Fernando III ZAL WIP Park
GLA (sqm) 34,992 11,421 98,942 42,632 224,864 96,572
ERV (€m) 1.9 0.5 5.0 2.0 10.7 4.1
Investment (€m) 25.5 7.1 52.3 24.0 147.6 51.6
ERV YoC 7.4% 7.2% 9.7% 8.5% 7.2% 7.9%
Delivery 2019 2020 2021 2019/2020 2020/2021 2021/2022
Total investment GLA Additional Rents Yield on Cost
€ 308m (1)
509k sqm € 24m 7.9%
(1)
€ 284m total investment until 2022
ı 27 ıValue creation | Best III
LAUNCH OF BEST III TO EXPAND FOOTPRINT TO OTHER AREAS OF THE IBERIAN PENINSULA
+509K sqm € 24m
GLA Basque Country ERV
Zaragoza
Madrid
Valencia
Lisbon
€ 308m(1) 7.9%
Investment Yield on Cost
Seville
(1)
€ 284m until 2022
ı 28 ıValue creation | Sources & uses
SELF-FUNDING CAPEX PROGRAM
Excess of cash from non-core disposals to be used for debt repayment and share buybacks
611 1,332
(€m)
202
(529)
519
(216)
391
(196)
Landmark Flagship Best II Total Capex Capex Invested Cash available Cash flow Non core
& Best III 2018-2022 as of Jun-19 as of Jun-19 retention disposals
until FY22(1) requirements
Assuming 20% of FY2018 AFFO
(1)
ı 29 ıValue creation | Potential rental growth (2018-2022)
(€m)
+32%
22.4(1) 661.5
25.0
18.2 636.9
40.0 617.3
56.2 (24.6)
499.7
469.4
Not considering rental
growth nor inflation
GRI GRI Reversionary Landmark Flagship Best II Best III Potential Non core Potential Previous
FY17 FY18 potential GRI FY22 disposals GRI FY22 GRI forecast
post disposals
ERV considered for Best III in the period
(1)
ı 30 ıCapital structure
Capital structure | Policy
INVESTMENT GRADE BBB RATING BY S&P WITH POSITIVE OUTLOOK AND Baa2 RATING
BY MOODY’S
Maturity Leverage
schedule • LTV below 50%
•T
arget to reach
• 5-10 years LTVCapital structure | Debt position
210 5,292
3,250 5,076
(216)
(€ million)
853
979
Secured Unsecured Unsecured RCF Total Gross Cash Total Net
bank loans loans bonds Debt Debt
% Gross
18.5% 16.1% 61.4% 4.0% 100.0%
financial debt
Average
cost (%) 2.50% 1.57% 2.10% 0.90% 2.04%(1)
% interest rate
hedged 97.8% 98.5% 100.0% 0.0% 95.4%
1.74% excluding hedging
(1)
ı 33 ıCapital structure | Debt maturity profile
FINANCIAL DISCIPLINE WHILE EXTENDING MATURITIES
1,820
720
(€ million)
1,077
17
867
716 17 776
16 176
850 1,100
700 850
15 600
8 7 13 14 210
1 2 14
2019 2020 2021 2022 2023 2024 2025 2026-2031
Unsecured loans Unsecured bonds Secured bank loans RCF
ı 34 ıCapital structure | Key metrics
AMPLE COVENANT HEADROOM AND STRONG DEBT METRICS LED BY CA. 41% LTV
Unsecured senior notes covenants MRL EMTN Program 6M 2019 PF
LTV 2.5x 3.9x
Unsec. Assets to Unsec. Debt >125% 230.1%
Other key metrics
Unsecured debt 81.5%
Unencumbered assets (by GAV) 80.2%
Undrawn facilities € 490m
Average cost (fully loaded with hedging) 2.04%(3)
Fixed interest rate(2) 99.3%
LTM NOI / LTM finance cost
(1)
Excluding RCF
(2)
1.74% excluding hedging
(3)
ı 35 ıSustainability
Sustainability    |    ESG and certification progress

                              ESG Benchmarks                            Certifications

                                                                                             98%(1)
                                                           Accesibility
                                   Gold since 2017

                                                                                             Shopping
                                                                                              centers

                                                           Efficiency
                                   MERLIN has obtained
                                                                                   66%        64%        66%
                                   82 points in the 2019
                                   edition

                                                                                   Offices   Shopping   Logistics
                                   Well above our peers                                       centers

                                   (62 points), European
                                   average (71 points)     Quality
                                   and Global average                               >850k sqm
                                   (72 points)                                      certified
    Excluding WIPs and Portugal
(1)

                                                                                                                    ı 37 ı
BREEAM
BREEAM €€6.2bn
6.2bn LEED
LEED
43,6%
43,6% 56,4%
56,4%
Sustainability | Efficiency certificates
66%
66% 64%
64% BREEAM € 6.2bn LEED
43,6% 56,4%
40%
40% Offices 36%
36% Breeam
BREEAM
BREEAM
Leed
LEED
LEED
66% 64% Platinum
Platinum
6%6%
2016
2016
40%
2019H1
2019H1 2016
2016 >36%
760k sqm
2019H1
2019H1
Very
Very
BREEAM
48%
48%
good
good Silver
Silver LEED
certified (2016-YTD) 19%
19%
Platinum
Pass
Pass 18%
18% Very good Silver
82%
82%6%
2016 2019H1 2016 2019H1 3%3%
48% 19%
BREEAM € 6.2bn LEED Good
Good
66%
66% BREEAM €56,4%
6.2bn LEED
43,6% Pass 18%
49%
49%56,4% 82%
Gold
Gold
Shopping Centers 43,6% 3% 75%
75%
35%
35% Good
66% 49% Gold
66% 64%
64% 75%
Very
Verygood
good
0% 36%
2016
2016
35%
36%
2019H1
2019H1
> 330k sqm BREEAM
BREEAM
Pass
Pass
LEED
30%
30% LEED
certified (2016-YTD) PlatinumVery good
15%
15% 100%
100% 30% Platinum
6%
Very good Pass
Silver 6%
2016 2019H1 2016 2019H1
48% Very good Silver
6 2019H1 2016 2019H1 15%19%
48% 100%Good
Good
19%
29
29 55%
55%
Pass 18% Pass 82%
24
24 Logistics 640
6403% 18% Good 82%
1 29
565
565 3% 55%
473
473 Good
66% 24 640 Good
21 1010 66% 565 49% Gold
Good
Good Silver
Silver Platinum
Platinum
473 49% 75% Gold
133
133 68%
68% 19%
75% 19% 18%
18%
5%
> 710k sqm
10 Good Silver Platinum
35%
133 68% 19% 18%
6 2017
2017 2018
2018 2019H1
2019H1 a 2016
a 2016b 2017 certified
b 2017c 2018
c 2018 (2016-YTD)
d 2019H1
d 2019H1 Very good 48%
48% 52%
52%
Very good
2016 2017 2018 2019H1 a 2016 b 2017
30%
30% 48% 52%
16 2019H1 Pass c 2018 d 2019H1
2016 2019H1
15% 100%Pass Pass
Pass Gold
Gold
15% 100% 32%
32%Pass 63%
63%
Gold ı 38 ı
Good 32% 63%
GoodSustainability | ESG Indexed Loan
# Largest in the European KPI’s
Real Estate sector to date
1 2
Continuous
xternal LEED/
E
investment
# Second largest in energy
BREEAM energy
ever in Spain across all industries certifications
efficiency
achieved in
improvement
office, logistics
across the
and retail assets
portfolio
€ 1.55 bn
3 4
Handicapped Electric
Sustainability-linked financing access for all consumption
tenants and sourced by
customers renewal
€ 850 m € 700 m throught AIS energies
Term Loan Revolving Credit Facility certification
of its buildings
Leading national and international financing institutions
ı 39 ıSustainability | European Investment Bank funding
Projects funded
€ 115m
logistics loan funded by the AZUQUECA II AZUQUECA III
European Investment Bank
€ 51m € 64m
Tranch I Tranch II
SESEÑA CABANILLAS PARK II
Advantageous terms
10 years loan
Assets
exceeding 400,000 sqm
Fixed or variable rates European Investment Bank support
based on:
Interest substantially below • Project location
MERLIN’s average funding cost
• Energy efficiency certification
ı 40 ıPaseo de la Castellana, 257 28046 Madrid +34 91 769 19 00 info@merlinprop.com www.merlinproperties.com
You can also read