PANGOLIN ASIA FUND ASEAN's Consumer Story Has Decades To Run - ASEAN alone has a population of 670 million - and they all want a house, two cars ...
←
→
Page content transcription
If your browser does not render page correctly, please read the page content below

PANGOLIN ASIA FUND
                                  ASEAN’s Consumer Story Has Decades To Run

ASEAN alone has a population of 670 million – and they all want a house, two cars and high cholesterol just like the rest of us
About The Fund

Pangolin Asia Fund is a long term value fund with a primary focus on South East Asia (ASEAN).
The fund was founded by James Hay in Dec 2004 who has a significant personal interest in the
fund.

Pangolin Investment Management (PIM) manages the fund, which seeks absolute returns
rather than to perform in relation to any benchmark equity index.

The fund’s investment objective is to achieve long term capital growth through capital
appreciation and income.

The fund may invest in illiquid companies and instruments. Little regard is be taken for
geographical spread or diversification and the fund may hold 25% of its assets in the securities
of one issuer at the time of purchase.

Although the manager has a mandate to use gearing and hedging instruments these are
unlikely to be used and the fund should be considered as a long‐only vehicle.

  PANGOLIN ASIA FUND | FEBRUARY 2018 | PRIVATE AND CONFIDENTIAL                                 1

110
140
170
200
230
260
290
320
350
380
410
440
470
500
530
80
Dec 04
Feb 05
Apr 05
CAGR
Jun 05
483.86
Aug 05
Oct 05
CAGR of PAF:
Dec 05
Feb 06
Apr 06
Jun 06
CAGR of MSCI ASEAN:
YTD return of PAF: 5.1%
Aug 06
Oct 06
YTD return of MSCI ASEAN:
of MSCI Asia ex JPN:
Dec 06
Feb 07
YTD return of MSCI Asia ex JPN:
Apr 07
Jun 07
Aug 07
Oct 07
Dec 07
Feb 08
PAF
Apr 08
Jun 08
Aug 08
Oct 08
Dec 08
Feb 09
Historical Performance
Apr 09
Jun 09
Aug 09
Oct 09
Dec 09
Feb 10
Apr 10
Jun 10
Aug 10
MSCI ASEAN
Oct 10
Dec 10
Feb 11
PANGOLIN ASIA FUND | FEBRUARY 2018 | PRIVATE AND CONFIDENTIAL
Apr 11
Jun 11
Aug 11
Oct 11
Dec 11
Feb 12
Apr 12
Jun 12
PAF vs. MSCI South East Asia
Aug 12
Oct 12
Dec 12
Thirteen years track record and annualised return of 13.09%
Feb 13
Apr 13
MSCI Asia x JP
Jun 13
Aug 13
Oct 13
Dec 13
Feb 14
Apr 14
Jun 14
Aug 14
Oct 14
Dec 14
Feb 15
Apr 15
Jun 15
Aug 15
Oct 15
Dec 15
Feb 16
Apr 16
Jun 16
Aug 16
Oct 16
Dec 16
Feb 17
Apr 17
Jun 17
Aug 17
Oct 17
Dec 17
257.15
510.62
2
243.15
Feb 18
Historical Performance Data
Year   Details    Jan      Feb      Mar      Apr      May      Jun      Jul      Aug      Sep      Oct      Nov      Dec      YTD
       NAV       501.11   510.62
2018                                                                                                                         5.11%
       % chg     3.15%    1.90%
       NAV       400.08   412.81   435.93   436.54   446.18   451.43   455.76   457.12   472.10   485.61   483.86   485.79
2017                                                                                                                         24.18%
       % chg     2.27%    3.18%    5.60%    0.14%    2.21%    1.18%    0.96%    0.30%    3.28%    2.86%    ‐0.36%   0.40%
       NAV       352.31   360.43   387.79   396.17   386.04   395.41   412.53    411.2   410.02   411.25   388.48   391.19
2016                                                                                                                         9.16%
       % chg     ‐1.69%   2.30%    7.59%    2.16%    ‐2.56%   2.43%    4.33%    ‐0.32%   ‐0.29%   0.30%    ‐5.54%   0.70%
        NAV      382.31   391.18   389.48   396.82   389.67   380.77   374.61   333.73   333.52   350.84   355.19   358.38
2015                                                                                                                         ‐4.76%
       % chg     1.60%    2.32%    ‐0.43%   1.88%    ‐1.80%   ‐2.28%   ‐1.62% ‐10.91% ‐0.06%      5.19%    1.24%    0.90%
        NAV      370.08   388.25   398.79   410.89   423.38   423.84   436.37   425.85   413.36   408.97   395.23   376.28
2014                                                                                                                         ‐0.52%
       % chg     ‐2.16%   4.91%    2.71%    3.03%    3.04%    0.11%    2.96%    ‐2.41%   ‐2.93%   ‐1.06%   ‐3.36%   ‐4.79%             Best monthly return    35.77%
        NAV      343.47   350.86   364.04   374.14   395.94   375.98   382.69   361.54   378.56   394.53   384.87   378.24
2013                                                                                                                         11.48%    Worst monthly return   ‐20.42%
       % chg     1.23%    2.15%    3.76%    2.77%    5.83%    ‐5.04%   1.78%    ‐5.53%   4.71%    4.22%    ‐2.45%   ‐1.72%
        NAV      290.78   311.15   303.35   313.01   301.88   312.18   316.87   323.01   323.75   334.08   332.63   339.29             Maximum drawdown       ‐47.53%
2012                                                                                                                         24.85%
       % chg     7.00%    7.01%    ‐2.51%   3.18%    ‐3.56%   3.41%    1.50%    1.94%    0.23%    3.19%    ‐0.43%   2.00%
                                                                                                                                       % of positive months   67.92%
        NAV      261.86   258.03   271.83   283.00   290.51   291.75   310.23   289.05   260.46   278.31   269.95   271.75
2011                                                                                                                         0.85%
       % chg     ‐2.82%   ‐1.46%   5.35%    4.11%    2.65%    0.43%    6.33%    ‐6.83%   ‐9.89%   6.85%    ‐3.00%   0.67%              Annualised return      13.09%
        NAV      201.91   205.09   213.68   227.44   213.93   227.45   234.62   238.78   253.28   258.37   260.53   269.47
2010                                                                                                                         37.58%
       % chg     3.08%    1.57%    4.19%    6.44%    ‐5.94%   6.32%    3.15%    1.77%    6.07%    2.01%    0.84%    3.43%
        NAV      95.67    96.38    98.12    133.22   145.25   151.32   159.71   167.99   173.21   174.49   182.60   195.87
2009                                                                                                                         95.34%
       % chg     ‐4.59%   0.74%    1.81%    35.77%   9.03%    4.18%    5.54%    5.18%    3.11%    0.74%    4.65%    7.27%
        NAV      157.49   156.55   150.63   154.03   146.18   136.23   132.58   125.09   113.55   90.36    85.98    100.27
2008                                                                                                                         ‐38.81%
       % chg     ‐3.89%   ‐0.60%   ‐3.78%   2.26%    ‐5.10%   ‐6.81%   ‐2.68%   ‐5.65%   ‐9.23% ‐20.42% ‐4.85%      16.62%
        NAV      136.43   140.75   144.17   153.68   157.90   159.36   159.56   150.23   158.13   163.17   160.72   163.86
2007                                                                                                                         27.19%
       % chg     5.90%    3.17%    2.43%    6.60%    2.75%    0.92%    0.13%    ‐5.85%   5.26%    3.19%    ‐1.50%   1.95%
        NAV      104.53   106.09   109.42   116.62   108.82   106.34   107.96   110.76   112.41   117.94   125.81   128.83
2006                                                                                                                         31.74%
       % chg     6.89%    1.49%    3.14%    6.58%    ‐6.69%   ‐2.28%   1.52%    2.59%    1.49%    4.92%    6.67%    2.40%
        NAV      99.24    99.37    97.77    98.86    96.77    97.05    100.14   94.90    96.99    97.05    96.14    97.79
2005                                                                                                                         ‐2.57%
       % chg     ‐1.13%   0.13%    ‐1.61%   1.11%    ‐2.11%   0.29%    3.18%    ‐5.23%   2.20%    0.06%    ‐0.94%   1.72%
        NAV        ‐        ‐        ‐        ‐        ‐        ‐        ‐        ‐        ‐        ‐        ‐      100.37
2004
       % chg       ‐        ‐        ‐        ‐        ‐        ‐        ‐        ‐        ‐        ‐        ‐      0.37%

   PANGOLIN ASIA FUND | FEBRUARY 2018 | PRIVATE AND CONFIDENTIAL                                                                                                    3
Our Strategy
The fund’s primary investment universe includes small cap and related equity instruments
and focuses on identifying undervalued companies in Asia with superior management
and prospects.
The fund adopts a value‐driven, bottom‐up approach with at least a three year view
The focus is predominantly on under‐researched and cheap stocks
Committed to underpaying our investments which provides downside protection
Well managed, cash rich and cash‐flow positive companies will survive and prosper even
in tough times
Tolerate short‐term volatility for long‐term capital gain
Avoid environmentally‐destructive and cyclical industries
Concentrated portfolio and very selective ‐ stock picking is how we make money
PANGOLIN ASIA FUND | FEBRUARY 2018 | PRIVATE AND CONFIDENTIAL 4
What We Own

Slightly more than half of the portfolio is exposed to the consumer sector such as fashion,
health & beauty retailing, supermarkets, consumer electronics & IT products distribution,
household appliance and food manufacturing
                                                        Healthcare

                                                            1.0%

                     Consumer Staple

                                                23.7%                                        Others
                                                                             32.8%

                                            23.0%

                                                                     21.6%
                            Financials

                                                                               Consumer Discretionary

  PANGOLIN ASIA FUND | FEBRUARY 2018 | PRIVATE AND CONFIDENTIAL                                         5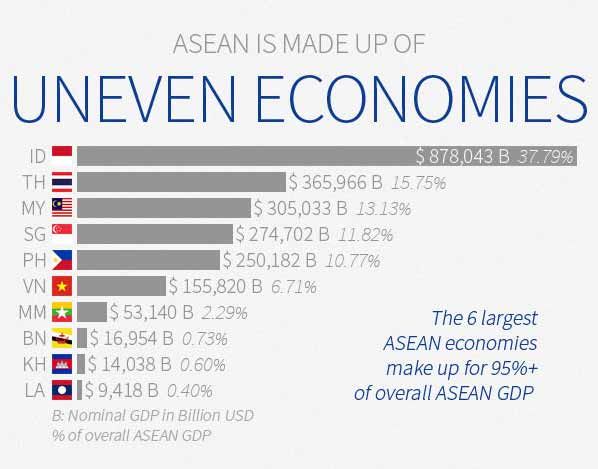
We Don’t Invest In This

Cleared jungle in Sarawak                                            Newly planted palm oil in Sarawak

     PANGOLIN ASIA FUND | FEBRUARY 2018 | PRIVATE AND CONFIDENTIAL                                       6
Portfolio Metrics

                               Return (in local currencies, except MSCI Asia Ex‐Japan)
   Period       DOW      S&P 500      JSE        KLSE           STI    SET     MSCI ex JP   MSCI‐ASEAN    PAF
  Feb 2018      ‐4.28%    ‐3.89%     ‐0.13%      ‐0.66%     ‐0.45%    0.18%     ‐5.04%        ‐1.53%     1.90%
 YTD 2018       1.25%     1.50%      3.80%       3.31%      3.38%     4.36%      2.11%        4.03%      5.11%

                                                    Return (in USD)
                                                                                                                                By Geography
   Period       DOW      S&P 500      JSE        KLSE           STI    SET     MSCI ex JP   MSCI‐ASEAN    PAF
  Feb 2018      ‐4.28%    ‐3.89%     ‐2.78%      ‐1.13%     ‐1.41%    ‐0.31%    ‐5.04%        ‐1.53%     1.90%
                                                                                                                     Thailand
  YTD 2018      1.25%     1.50%      2.32%       6.72%      4.25%     7.95%      2.11%        4.03%      5.11%
                                                                                                                                                           Indonesia
                 % Change in Currency Vs USD
                                                                                                                                19.1%
   Month         MYR         SGD         IDR              THB                                                                                   31.0%
  Feb 2018      ‐0.47%      ‐0.96%      ‐2.65%          ‐0.49%
  YTD 2018       3.31%      0.85%       ‐1.43%          3.44%
                                                                                                         Singapore      11.0%
Pangolin Asia Fund Fundamentals (Feb 28, 2018)

                                       2017              2018f
P/E                                    15.4               13.6
Profit Growth (%)                       13                 12
                                                                                                                                        40.0%
ROE                                     19                 19
ROIC                                    25                 25
Div Yld (%)                             3.7                3.9

                                                                                                                                                Malaysia

            PANGOLIN ASIA FUND | FEBRUARY 2018 | PRIVATE AND CONFIDENTIAL                                                                                     7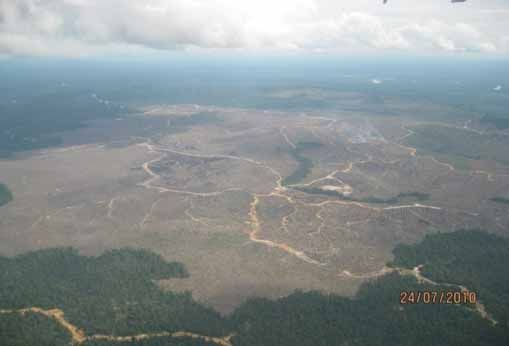
Why Invest In Us The investment style is based on fundamentals backed by company visits Opportunities abound in overlooked and undervalued small cap companies We are long‐term investors in businesses, not market traders Most of our time is spent discovering ideas and cultivating relationship with business managers Majority of the fund has direct exposure to the ASEAN consumer sector James and the team have more than 60 years’ experience investing in South East Asia PANGOLIN ASIA FUND | FEBRUARY 2018 | PRIVATE AND CONFIDENTIAL 8
Activism
While not an “Activist Fund,” as long term investors we maintain close relationships with
the companies we own
This includes not only voting but also attending AGMs and EGMs
And questioning both the management and non‐executive directors, with an emphasis on
reminding the latter that they are there to protect minorities
Pangolin’s focus is on making good companies better, not bad companies good
For example, we don’t tell Padini how to sell clothes but we do advise them on their
balance sheet
PANGOLIN ASIA FUND | FEBRUARY 2018 | PRIVATE AND CONFIDENTIAL 9Our Investors Our main investors are primarily high net worth individuals, family offices and long term institutional clients such as pension funds and endowments The fund is suitable for those willing to bear a substantial risk by investing in a fund whose performance will be dependent on the performance of Asian equity markets and the investments selected by the investment manager The fund is not suitable for investors with a short term view We recommend a minimum investment horizon of 3 ‐5 years PANGOLIN ASIA FUND | FEBRUARY 2018 | PRIVATE AND CONFIDENTIAL 10
Why ASEAN?

ASEAN has emerging markets with lower valuations, lower debt and higher growth than other
regions in the world.
The combined economies of ASEAN make it a major economic power.
The combined population creates the world’s third largest market with more than 600m
people.
Besides being a huge market, ASEAN accounts for 7% of the global exports, which makes them
the fourth largest exporting region in the world.

                                                                                  FUNDAMENTALS (Feb 28, 2018)
                                                                                         Div Yld (%)   P/E    P/E Fwd   P/BV
                                                                  MSCI EM ASEAN             2.5        18.6     16.6    2.3
                                                                  MSCI World                2.3        21.0     16.0    2.4
                                                                  MSCI USA                  1.9        24.3     17.4    3.3
                                                                  Pangolin Asia Fund        3.9        15.4     13.6    2.5

  PANGOLIN ASIA FUND | FEBRUARY 2018 | PRIVATE AND CONFIDENTIAL                                                               11
Changes In ASEAN Big changes in ASEAN are taking place The growth in ASEAN region is projected to have an average of 5.2% between 2016 & 2020 (source: OECD) ASEAN has lower government debt levels compared to the West – Lessons learnt from 1998 A combination of strong work ethic and low corporate taxes encourages the wealth retention Tourism is on the rise, especially in Thailand, Malaysia and Indonesia Government policy initiatives have been encouraging Sizeable and deep capital market ‐ yet low foreign ownership in equity Favourable demographics combined with urbanization are happening at a rapid rate Big and important changes happening in consumption and infrastructure PANGOLIN ASIA FUND | FEBRUARY 2018 | PRIVATE AND CONFIDENTIAL 12
ASEAN Advantage
Thailand Malaysia
Massive infrastructure investments Massive infrastructure investments
Influx of tourists Maintaining trade surplus
Strong household consumption Cheap Ringgit boasts tourism and export
Major hub for auto industry
Economic recovery
Singapore Indonesia
High GDP per capita at USD 80,000 Massive infrastructure investments
Attracts many FDI's High urbanization
Moving into high tech sectors such as Domestic consumption account for 56% of GD
E‐commerce and Fin‐tech Private consumption rebound as Indonesia is at
the bottom of the cycle
PANGOLIN ASIA FUND | FEBRUARY 2018 | PRIVATE AND CONFIDENTIAL 13ASEAN Advantage ‐ Consumption Patterns Are Changing For Millions
Traditional Market, NTT, Indonesia Cold Storage Supermarket, Malaysia
Padi Fields Bario, Sarawak Kuala Lumpur City Centre
PANGOLIN ASIA FUND | FEBRUARY 2018 | PRIVATE AND CONFIDENTIAL 14ASEAN Advantage ‐ Consumption Patterns Are Changing For Millions
Huge Crowd seen at Padini Concept Store during the holiday season Construction of MRT in Jakarta
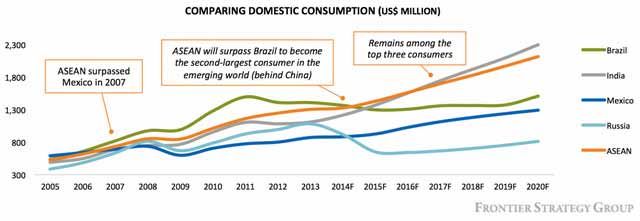
PANGOLIN ASIA FUND | FEBRUARY 2018 | PRIVATE AND CONFIDENTIAL 15ASEAN Advantage – Consumption ASEAN's market of more than 600 million people is 9% of world's total population Its consumer market of USD 1.2 trillion exceeds that of India, South Korea, and Brazil This consumer market will double by 2030 when looking at the growth in households PANGOLIN ASIA FUND | FEBRUARY 2018 | PRIVATE AND CONFIDENTIAL 16
ASEAN Advantage

Source: ASEAN UP

                                   2017       2017       2017      2017             2017            2016      2017     2018(F)     2016
                                 Govt Debt Inward FDI Interest   Population   Credit to Private   GDP (USD     GDP      GDP      Market Cap
                    Country       % GDP      % GDP      Rate      (million)    Sector % GDP        billion)   Growth   Growth      % GDP
                   Indonesia        27         2.2       4.75       264              40             932        5.1       5.1        46
                    Malaysia        50         2.9       3.25       32              136             297        5.9       5.0        121
                   Philippines      38         2.6       3.00       105             66              305        6.7       6.7        79
                   Singapore       112         19.6      1.02        6              182             297        3.6       2.5        216
                    Thailand        33         2.0       1.50       69              118             407        3.9       4.1        106
                    Vietnam         64         6.4       4.25       96              141             205        6.8       6.6        33
             Source: Thomson Reuters Eikon, World bank

  PANGOLIN ASIA FUND | FEBRUARY 2018 | PRIVATE AND CONFIDENTIAL                                                                               17
Pangolin Investment Management
The Team
James Hay – Director
James, British and born in 1963, has been involved with Asian financial markets since 1986 with BZW and Kim Eng Securities in London, and with Arab‐Malaysian Securities, TA
Securities and Caspian Securities in Malaysia, where he has lived since 1993. Since 1998, James has primarily been investing fundamentally in Asian markets for himself and,
since 2004, for the fund.
Vinchel Budihardjo – Director
Vinchel has been with the company since 2005. He has a Masters degree in Corporate Finance from Georgia State University. His responsibilities include company analysis
and stock selection.
Irvan Mondro ‐ Director
Irvan has a Bachelor’s Degree in Economics from Pelita Harapan Business School. His responsibilities include company analysis and research. He has been with Pangolin since
2010 and is well versed in English and Bahasa Indonesia.
Kok Chiew Sia ‐ Analyst
Chiew Sia is a Malaysian National and holds a Bachelor’s Degree in Finance from Curtin University of Technology. She speaks English, Mandarin, Cantonese and Bahasa
Malaysia. Prior to joining Pangolin in 2013, she worked as an analyst with Hwang DBS Vickers Research (Malaysia) and DBS Vickers (Hong Kong) covering consumer sectors for
over 6 years.
Jalene Ngiam – Operations Executive
Jalene has an Honours Degree in Banking & Finance from University of London. She and Zubaidah handle the company’s operations ad administration. She speaks English and
Mandarin. Jalene joined Pangolin in 2013
Zubaidah Zam Ibrahim – Administration
Zu is the personal assistant to James Hay and handles operational matters for Pangolin Investment Management. Previously she has worked for Siemens and Deutsche Bank
AG, Malaysia.
Simon Woods – Non‐Executive Director
Trained as a securities analyst and was the former head of research for BZW in Singapore and Country Manager for Jardine Fleming in Malaysia. He then worked for Swiss
based multi Family Office in Singapore, first as COO and then as CEO. Simon is currently the COO of East India Capital Management (Singapore).
Alexander John Mearns – Non‐Executive Director
Alex is the Chief Executive Officer of Eurekahedge and has been with the company since 2002. He previously worked as a Business Analyst at Robert Fleming Asset
Management in London. He has also worked for the British Government as an Energy Analyst with the Department of Trade and Industry. Alexander holds a Bachelor of
Science (Hons) in Mathematics and Statistics from Manchester Metropolitan University.
PANGOLIN ASIA FUND | FEBRUARY 2018 | PRIVATE AND CONFIDENTIAL 18Pangolin Investment Management
Directors
James Hay – Director
James, British and born in 1963, has been involved with Asian financial markets since 1986 with BZW and Kim Eng Securities in London, and with
Arab‐Malaysian Securities, TA Securities and Caspian Securities in Malaysia, where he has lived since 1993. Since 1998, James has primarily been
investing fundamentally in Asian markets for himself and, since 2004, for the fund.
Gerald Ambrose
Gerald has twenty years’ experience of Asian stock markets both as an Asia ex‐Japan equity salesman and as a fund manager. He has worked and
lived in Malaysia, London and Singapore. He is managing director of Aberdeen Asset Management’s Kuala Lumpur office. As a broker Gerald
specialised in small and medium sized companies within ASEAN, experience that fits Pangolin’s strategy perfectly. Before entering the financial
world, Gerald was a member of the Royal Navy. He served as a submariner during the Falklands War and has more medals than Muttley.
Fiona Somerville
Fiona was formerly a fund manager with Invesco MIM Asset Management in London for whom she covered the Asia ex‐Japan markets. She has also
worked in the Asian broking industry for both Kim Eng Securities in London and Jardine Fleming in Hong Kong. In 2000, following a Masters degree,
she joined Pictet Asset Management in Singapore as their Institutional Marketing Manager covering Australia. In 2001 she returned to Hong Kong as
a Consultant with Eban International, specialising in executive search for fund management firms in the Asian region. In 2011 she set up her own
firm, Black Kite Search, with the same focus. Fiona is a graduate of Oxford University and holds an MSc in Finance from London Business School. Her
experience of Asian markets and fund management is directly relevant to the operations of the fund.
PANGOLIN ASIA FUND | FEBRUARY 2018 | PRIVATE AND CONFIDENTIAL 19Fund Information
Structure, Key Terms
Max leverage : 35% (currently unused and unlikely to be used)
Typical portfolio holdings : 4 ‐ 30 securities
Unit pricing : Monthly
Subscription : Monthly; minimum US$200,000
Redemption : Quarterly with 60 days notice ( A 10% gate can be imposed)
Redemption Fees : 2% within 12 months of investment, for the benefit of the fund
Management Fee : 1.5% of fund’s NAV per annum, paid monthly
Performance Fee : 15% of increase in NAV, paid annually, above high watermark
Fund Type : Open ended
Launch date : December 2004
Bloomberg Code : PANGOLN KY
ISIN No. : KYG6902M1006
Regulator : Monetary Authority of Singapore
Service Providers
Fund Domicile : Cayman Islands (CI)
Investment Manager : Pangolin Investment Management (CI)
Investment Advisor : Pangolin Investment Management Pte Ltd, Singapore
Custodian : Deutsche Bank AG, Singapore
Administrator : Crowe Horwath First Trust Fund Services, Singapore
Auditor : RSM Cayman Limited
Legal Advisor : Mourant Ozannes, CI
US Counsel : Lowenstein Sandler, NY
Tax Advisor : BDO International, Singapore
Additional Information for Investors in Switzerland
Representative in Switzerland is PvB Pernet von Ballmoos AG, Bellerivestrasse 36, 8008 Zürich where the prospectus / offering memorandum, the articles of
association as well as the annual report may be obtained free of charge from the representative. The Paying Agent in Switzerland is Neue Helvetische Bank,
Seefeldstrasse 215, 8008 Zürich. For investors who have acquired the units sold in and distributed from Switzerland, the place of performance and the
court of jurisdiction have been established at the registered office of the representative.
PANGOLIN ASIA FUND | FEBRUARY 2018 | PRIVATE AND CONFIDENTIAL 20Disclaimer
This presentation is for market research purposes only. It is not an offer of securities and must not be construed as an offer
to sell or an invitation to subscribe to any securities or other financial products in any jurisdiction or country.
Investment in the Pangolin Asia Fund can only be made by completing an application form attached to the appropriate offer
document.
Information contained in this document is not intended to be securities or financial product advice and should not be relied
upon as such. The repayment of an investment in and the performance of funds managed by Pangolin Investment
Management is not guaranteed by PIM, any organisation or any person. The potential investment is subject to investment
risk, including possible delays in repayment and loss of income and principal invested.
Past performance is not indicative of or a guarantee of future results. This presentation is intended as a general outline only
and is not a definitive statement on the subject matter. It is not intended for public use or distribution.
PANGOLIN ASIA FUND | FEBRUARY 2018 | PRIVATE AND CONFIDENTIAL 21Contact Details
Pangolin Investment Management
50 Raffles Place
#22‐02 Singapore Land Tower
Singapore 048623
Tel: +65 6334 4475
Fax: +65 6438 8082
pangolin@pangolinfund.com
www.pangolinfund.com
PANGOLIN ASIA FUND | FEBRUARY 2018 | PRIVATE AND CONFIDENTIAL 22You can also read