High Yield Residential Socimi - CONFIDENTIAL - Gavari Properties

Page created by Marshall Medina
 
CONTINUE READING
High Yield Residential Socimi - CONFIDENTIAL - Gavari Properties
CONFIDENTIAL

High Yield
Residential Socimi

September 2020
High Yield Residential Socimi - CONFIDENTIAL - Gavari Properties
Investment opportunity

The opportunity                                                                Strategy and Investment philosophy                                               Market outlook

The opportunity consists in taking part in the capital increase of Gavari      Acquisition and reform of more than 20 year-old residential buildings in         In Madrid, housing prices have risen since 2014 at an annual rate of 7.2%
Properties Socimi S.A. (REITs) in order to increase the current portfolio of   metropolitan outlying districts of Madrid and adjacent municipalities and        (Málaga 7.4%) and rental prices at 7.5% according to Idealista.com, due
158 homes in the metropolitan outlying districts of Madrid and Malaga –        the city of Málaga, with high demand, short supply and limited volatility.       to, among other reasons, a large imbalance between rental supply and
areas named as “High Yield” due to their high return.                                                                                                           demand.

Two business segments: Long term rental apartments and Co-living               Property management through long-term rental (traditional rental) or rooms       The number of homes built in a year decreased 90% from 850k in 2006 to
oriented to students (room accommodation alternative that offers the best      for students (Coliving)                                                          80k in 2017 reducing significantly new stock of residential units, according
of a residence: community, living together, leisure ... with the independent                                                                                    to the Spanish Ministry of Development.
rental of a student housing: privacy, freedom ...)                             Investment in income generating assets or are close to generate avoiding
                                                                               transferring any type of developer risk to the investor while facilitating the   Annual gross returns of 8-10% per rental on the assets targeted for
Unique project, which combines a purchasing capacity at excellent market       obtaining of rents throughout the life of the project.                           investment with respect to traditional product in prime areas with return on
prices with a very important added value in all its operations due to the                                                                                       the levels of inflation.
repositioning of assets, this last factor being our main competitive           Proven management skills and strengthened by the strategic alliance with
advantage, as we are already showing in projects where we have                 a team with vast experience in this type of assets and a top-tier Advisory       Limited impact on Covid-19 at this stage and good performances vs. other
improved 40% your income in 6 months.                                          Board.                                                                           real estate segments

Pipeline portfolio of more than 300 available apartments (target portfolio                                                                                      Liquidity in markets and scarcity of investment opportunities with upward
under Management ≈ 500 homes) in Madrid y Málaga.                                                                                                               annual
                                                                                                                                                                .       remuneration and potential.

With a 3/5 year investment target horizon, the net return target ex
commissions and expenses is 12%-18% with target multiple over capital
invested of 1,6 - 2x, with annual dividends over invested capital of ≈ 5%
after closing investment period
High Yield Residential Socimi - CONFIDENTIAL - Gavari Properties
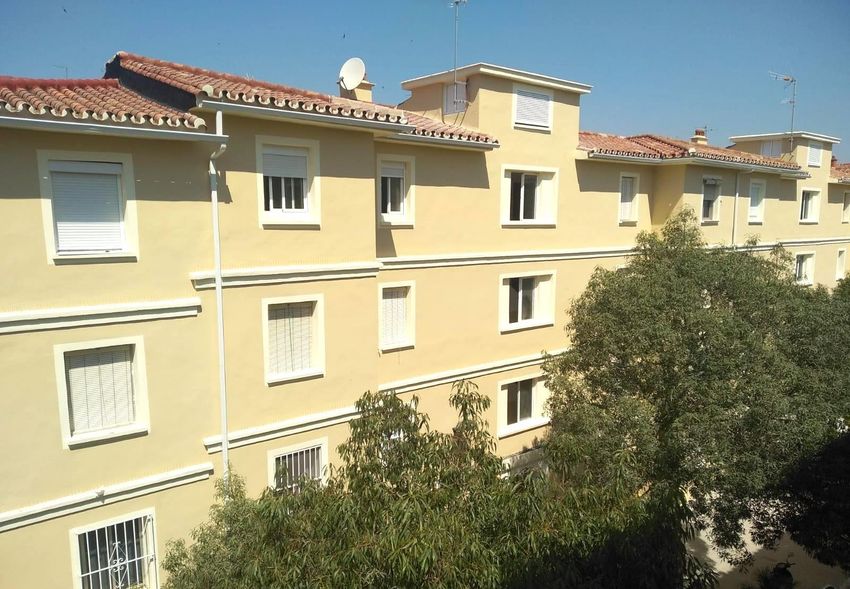
Proposed opportunity

  01                                                                     02                                                                            03

Currently                                                              New investors - Pipeline execution                                            Devestiture
158 units under management                                             500 homes under management                                                    Full Project selling or partially Project by Project

Currently                                                              Years 1 – 3                                                                   Year 3-5

                                                                       Liquidity obtained from investors used to consolidate the vehicle and
Injection of funds in Gavari Properties Socimi S.A. from investors.                                                                                  Acquisition by another Socimi or Investment Fund.
                                                                       execute value-adding activities on assets and optimization of their return.
                                                                                                                                                     Sale of projects in globally or individually.
The Socimi is listed in the Stock Market (MAB) since June 1st, 2020.
Ticker -> YGAV
ISIN -> ES0105482006                                                                                                                                 Note: GavariAM, as Project Manager, has a management contract with
                                                                                                                                                     Gavari Properties and will receive a fee in return for management.
High Yield Residential Socimi - CONFIDENTIAL - Gavari Properties
Gavari Properties at a glance…

                 158 units                                                       >20%                                             < 6-8%
                  Under management                                               Acquisition discount                             Unpaid monthly rents
                  155 apartments + 3 commercial                                  vs. market                                       (target 3% after asset repositioning)
                  units

                 95%*                                                            ≈ 37%                                            > 10.000 m2
                  Asset Occupation                                               Debt / Gross asset value                         Under management

                                                       >8%**                                            ≈ €16M
                                                       Current Gross yield                              Gross asset value (GAV)
                                                       vs. 5% acquisition yield
                                                       (9% reversionary after asset repositioning)

*Excluding long term rental apartments in Carlos III
** September 2020
High Yield Residential Socimi - CONFIDENTIAL - Gavari Properties
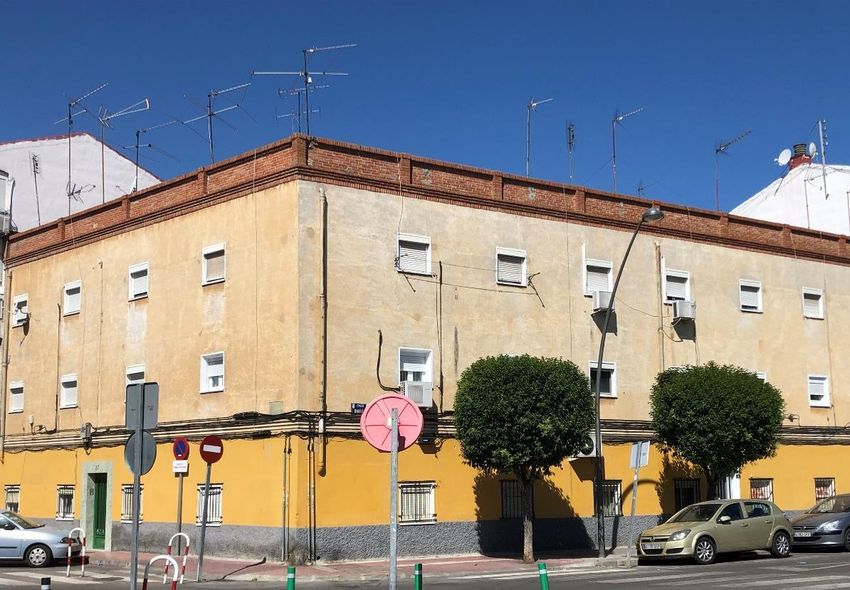
Limited stock does not suit needs and trends

                                                                                                                                                                                                  Restricted supply of
                                  Metropolitan
                                                                                                                Leasing economy                                                                    affordable rental
                                   attraction
                                                                                                                                                                                                       housing(5)

                       ≈ 70% of the world population                                                        Home ownership continues to                                                          Less than 4% of total available
                        will live in urban areas by                                                           decline in Spain (76% in 2018                                                         supply in Madrid is below 700
                        2030(1).                                                                              vs. 81% in 2007) and still far                                                        EUR / month.
                                                                                                              from European levels (69%).
                       Next step “from country side to                                                                                                                                            If we consider apartments with
                        the city” movement –> mid-size                                                       Peak home acquisition age is                                                          2 or more bedroom only 1,5%
                        cities are losing population in                                                       moving from 25 to 45 years old                                                        is below 700 EUR / month
                        favor of large cities(2).                                                             for millennials(3).
                                                                                                                                                                                                   Market cheapest apartment in
                       Limited   budget     to    pay                                                       Credit      restrictions     after                                                    Madrid for rent at 500 EUR /
                        mortgage or monthly rental                                                            financial crisis to be intensified                                                    month.
                                                                                                              due to Covid-19 crisis making
                                                                                                              very difficult house acquisition.                                                                     Key driver

   (1) United Nations (UN DESA) 2018 Revision of World Urbanization / (2) “La metropolización de Madrid vacía las provincias ricas de España” analysis– elconfidencial.com / (3) US millennials, 2015, Goldman Sachs Investment Research / (4) Europe, Eurostat /
    Idealista.com
High Yield Residential Socimi - CONFIDENTIAL - Gavari Properties
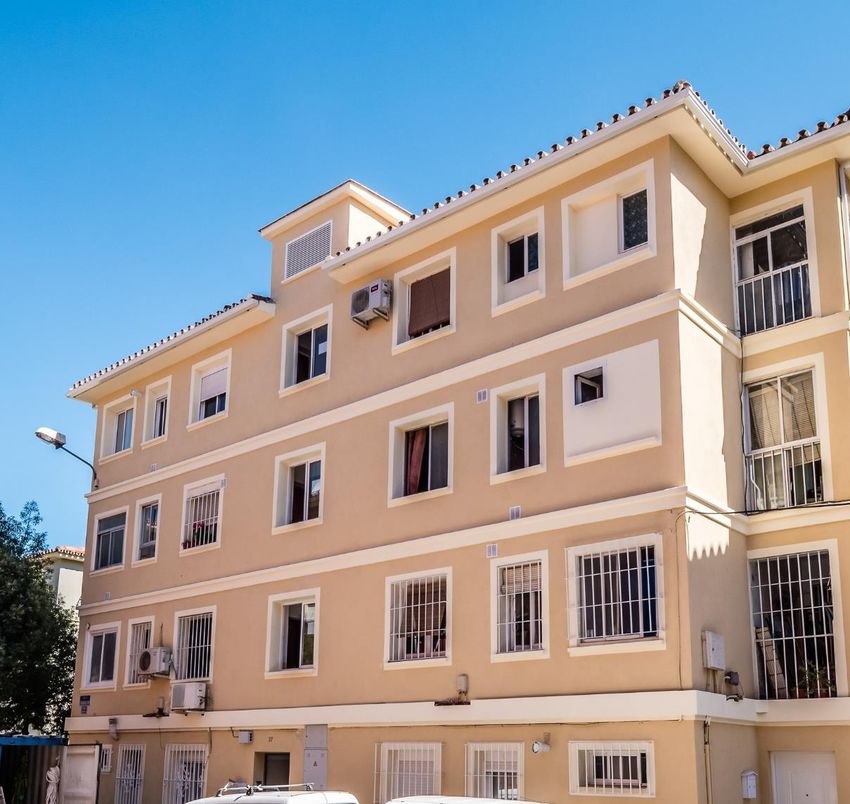
Affordable rental apartments are the opportunity

                                        Yield Evolution (%)                                                                             Rental Price Evolution (%)
                                                                              8,8%      8,6%                                                                                      13,6%
                                                                      7,9%                                                                                                 11,5%11,0%
                                                                                               7,7%   7,6%                                                                            10,6%10,5%
                                                 7,3%                                                        9,5%                                                        9,0%
                                      6,8%                     6,9%
                                                        6,4%                                                  6,5%                                                                                   6,7%
                            5,9%                                                     Opportunity :
        5,4%                                                                                                                                                   3,8%                            2,9%
                  5,4%                                                               2x yield premium                                        2,8%
4,8%                                                                                                                                                                                                1,8%
                                                                                                                                      0,1%                                                   0,5%

                                                 4,1%                 4,1%    4,4%                                   -1,7%
4,0%                                  4,0%              3,9%   4,0%                     4,0%   4,0%   3,9%                                    -2,5%
        3,8%      3,7%      3,7%                                                                                       -3,2%      -3,3%            -3,7%
                                                                                                                                                    -7,2%-7,1%   -6,6%
                                                                                                                           -8,5%
                                                                                                                                                           -9,5%
                                                                                                                             -10,8%

2007    2008      2009      2010      2011       2012   2013   2014   2015    2016      2017   2018   2019   2007 2008 2009 2010 2011 2012 2013 2014 2015 2016 2017 2018 2019
                           Salamanca (Prime)             Puente Vallecas (High Yield)                                           Salamanca (Prime)          Puente Vallecas (High Yield)

                                      Currently, significant better performance of affordable rental apartments (6%-8% GY) vs. prime locations (2,5% - 4,0% GY).

                                      Similar rental price evolution in recent years between High yield and Prime with better yield performance after financial crisis in
                                       High Yield market.

                                      Healthier market stock composition – funds and solvent new owners since 2010 - will avoid a significant price drop in high yield
                                       areas – new stronger owners in financial terms.
  Source: Monthly pricing report Idealista.com
High Yield Residential Socimi - CONFIDENTIAL - Gavari Properties
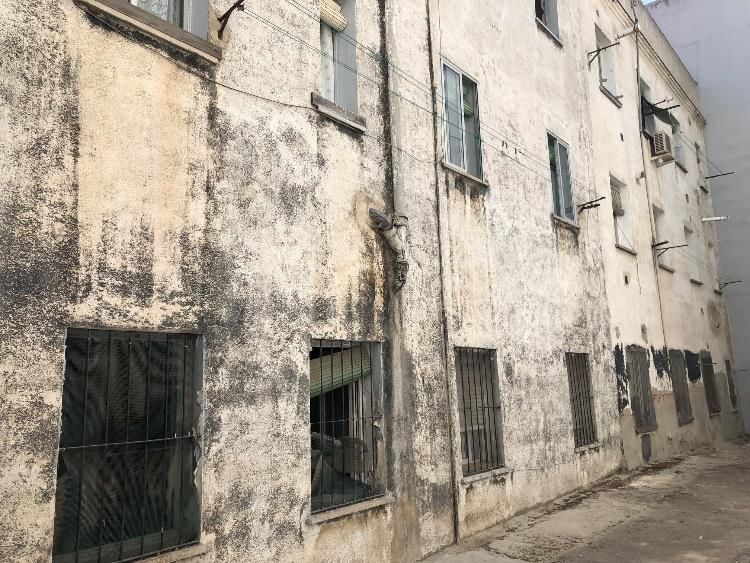
Covid considerations

     Private rented sector                                                           Payment delay
                                               PRS resilience
      (PRS) new trends                                                                (not default)

      Available supply increase due        Home is a basic necessity and        Moderate dilation of average
       to tourists disappearance and         a forced change has a strong          payment times.
       therefore tourism apartments          emotional   and     economic
       converted into long term              impact.                              Increase in non-payment at the
       apartments                                                                  time of receipt of receipts that
                                            Segment has suffered the least        is gradually resolved in time.
      Possible massive departure of         from the pandemic in terms of
       tenants from the city to              non-payment and valuation            Strong commitment of tenants
       municipalities far from the city.     and the one that has best             not to fall into a legal
       The route seems limited by            recovered from its first impact       proceeding. Delay but not
       purchasing power, availability                                              default.
       of supply and infrastructures,       The need for a home in cities is
       real attractiveness.                  not questioned, nor will it be in
                                             the    face      of    complex
      The shortage of affordable            perspectives of commercial
       supply in the family housing          spaces, offices, etc.
       market (+2 rooms) continues.
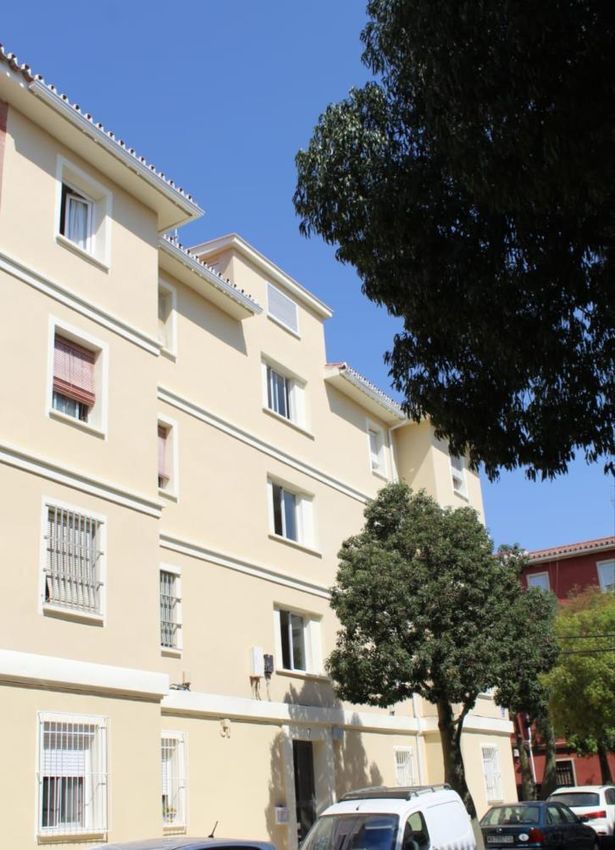
High Yield Residential Socimi - CONFIDENTIAL - Gavari Properties
Portfolio mix

    # units ≈ 158   Gross value ≈ 16 M EUR   Revenues business mix target

     52%                 38%                           30%
                            Málaga                        Coliving
        Málaga

     48%                 62%                           70%
                                                         Long term
        Madrid              Madrid
                                                          rentals
High Yield Residential Socimi - CONFIDENTIAL - Gavari Properties
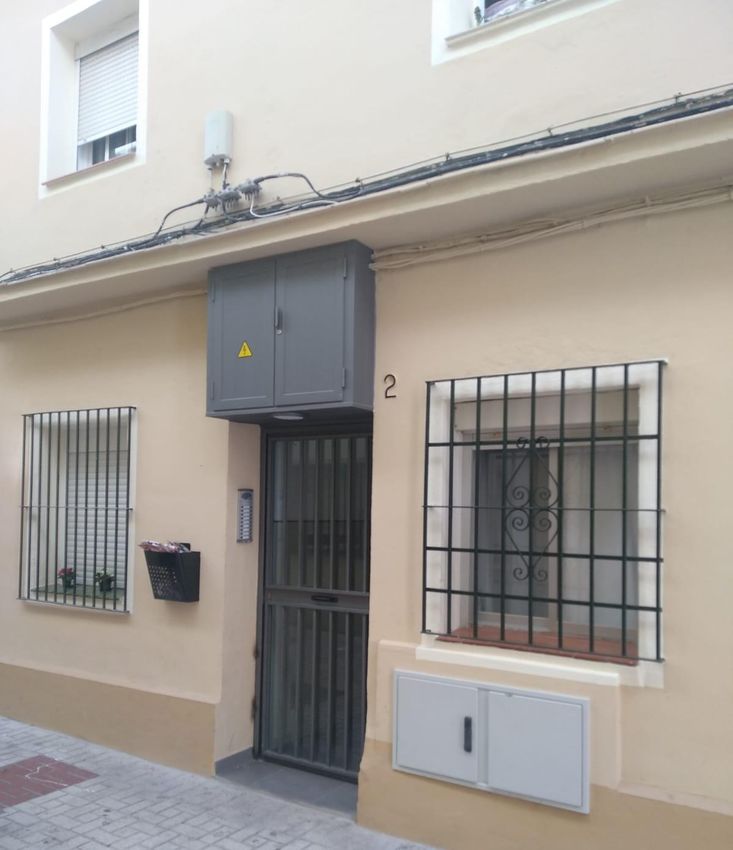
Current portfolio under management

   Project name                   District (Municipality)       Acquisition date   # Units   m2       Yield revisionary

   Cherry                         Cruz Humilladero (Málaga)     31.07.2018         36        2.491    9,5%

                                  Ciudad Lineal
   Aportación                     Puente de Vallecas            15.10.2018         16        784      8,4%
                                  San Blas (Madrid)

   Nadine I                       Cruz Humilladero (Málaga)     30.10.2018         46        2.878    8,8%

   Callejo                        Puente de Vallecas (Madrid)   29.11.2018         12        794      7,3%

   Carlos III                     Getafe (Madrid)               05.06.2019         38        2.499    11,1%

   Marcelino                      Madrid                        15.09.2019         9+3       647      8,0%

   TOTAL                                                                           160       10.093   9,2%

Yield = Unlaveraged Gross Yield
High Yield Residential Socimi - CONFIDENTIAL - Gavari Properties
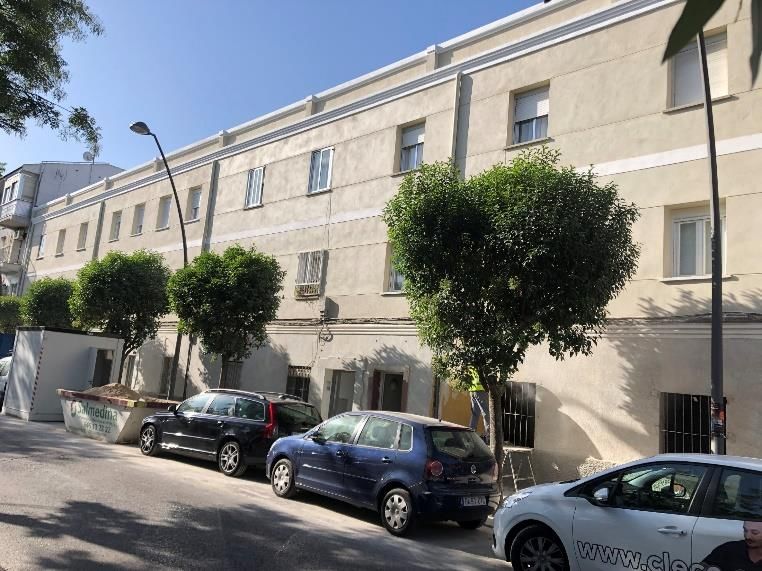
Business Case – Long term
               Description: Six buildings project next to train station in Malaga – Cruz de Humilladero district - with a very poor maintenance situation and low tenant profile paying an average rent of less than
                                                         250 EUR/ month while in Malaga there are no chance to find attractive alternatives to rent below 600 EUR/month

                                                      Previous situation                                                                        Current situation (Project target)
                    •   Vacancy rate: 85% occupied                                                                          • +70% increase of rental average (238 EUR – 438 EUR) in 21 month.
                    •   Deplorable maintenance status                                                                       • Vacancy rate: 100% occupied
                    •   Very low tenant profile                                                                             • Full outdoor installation refurbishment and progressive indoor as contracts expire
                    •   No scoring in place to select tenant                                                                • New strong scoring system focused in solid tenants

                                                                                                                                                               2018 (last
                                                                                                                                             Pre-Acq                      2019        2020             2021      2022      2023
                                                                                                                                                               Q)
           # apartments                   46
           # buildings                    6                                                                                 Revenues         126.228           31.557    225.346      240.000          252.000   264.000   264.000
           m2                             2.684                                                                             Costs            -30.000           -6.250    -35.000      -35.000          -35.000   -30.000   -30.000
           Location                       Calle Carceleras 3, 5, 7 ; Caña 3, 7 and Leandro Martinez 37 Málaga
                                                                                                                            NOI              96.228            25.307    190.346      205.000          217.000   234.000   234.000
           Acquisition Cost (EUR)         2.015.347
           Capex (EUR)                    713.881
           Pending Capex est. (EUR)       250.000                                                                           Gross Yield      4,2%              -         7,6%         8,1%             8,5%      8,9%      8,9%
           Total project (EUR)            2.979.228                                                                         Net Yield        3,2%              -         6,4%         6,9%             7,3%      7,9%      7,9%

           Acq. Cost (EUR/m2 )            751
           Capex (EUR/m2 )                266                                                                               Net exit yield             6,5%                        Leverge 40% LTC
           Total Project (EUR/m2 )        1.110                                                                             IRR                        20,3%                     Interest Cost: 2,5%

(*)   Gross yield (Yield on cost) = Revenues / investment property; Net yield = Revenues – expenses / investment property
Business Case – Coliving
                Description: Long term rental project changed into a student coliving after a strong outdoor and indoor refurbishment located just in front of Carlos III University with a 12.000 people campus.
                                                               There is no residential experience competitor excluding 750 places managed by the University.

                                                      Previous situation                                                                     Current situation (Project target)
                    • Vacancy rate: 15% occupied                                                                            • Turn business model into a coliving for students, renting rooms of the existing
                    • Deplorable maintenance status                                                                           apartments
                    • Long term rental business model oriented                                                              • Vacancy rate (September est.): Fully booked.
                                                                                                                            • Monthly revenues from 1,5k EUR to more than 30k EUR

                                                                                                                                                    Pre- 2019 (half                                                    2024
                                                                                                                                                                         2020         2021       2022      2023
                                                                                                                                             Acquisition     year)                                                    (exit)
           # apartments                   38
           # buildings                    5                                                                                 Revenues             20.400     27.175    250.977     366.080      400.400   400.400    200200
           m2                             2.561                                                                             Costs                -15.000    -17.631   -47.059      -53.965     -56.024   -56.024    -28012
           Location                       Calle Daoiz 38, 40, 42, 46 y Sanchez Morate 27 - Getafe (Madrid)
                                                                                                                            NOI                    5.400     9.545    203.918     312.115      344.376   344.376    172.188
           Acquisition Cost (EUR)         1.983.818
           Capex (EUR)                    1.412.191
           Pending Capex est. (EUR)       150.000                                                                           Gross Yield            0,6%       0,8%       7,1%       10,3%       11,3%     11,3%
           Total project (EUR)            3.546.009                                                                         Net Yield              0,2%       0,3%       5,8%         8,8%       9,7%      9,7%

           Acq. Cost (EUR/m2 )            775
           Capex (EUR/m2 )                551                                                                               Net exit yield         6,0%                  Leverage: 43% LTC
           Total Project (EUR/m2 )        1.385                                                                             IRR                   24,8%                  Interest cost: 2,5%

(*)   Gross yield (Yield on cost) = Revenues / investment property; Net yield = Revenues – expenses / investment property
Main KPI evolution
Main operational KPI
                                                   Current portfolio (# units)                                                                                                                                 Average Price Rent (EUR / housing)*
200
                                                                                                                                                                                                  635                                607 607 607 574 574 577 585 585 591 602 602 602 630
                                                                                                                                                                                                         568 592 592 592 592 598 602
                                                                                                                                                        16
160                                                                                                                                                                              Callejo
                                             49     49    49     49 10 10 10 158 158 158 158 158 158 158 158 158 158 158                                                         project
                                38    38                            148 148 148
                                                                                                                                                                               acquisition
120
                                                                                                                                                                                                                                              Marcelino
                          110 110 110 110 110 110 110                                                                                                                                Nadine                                                     project
                    98                                                                                                                                                                project                                                 acquisition
 80
                                                                                                                                                                                    acquisition                                                                                         430
                                                                                                                                                                                                                                        376 380 391 393 392 397 398 401 407 409 410 420
                                                                                                                                                                                                                        347 350 356 370
                                                                                                                                                                                   317 317 315 293 301 308 317
 40
        36   36                                                                                                                                                                                                                                +43%

  0                                                                                                                                                                                Aug Sep Oct Nov Dec Jan Feb Mar Apr May Jun          Jul Aug Sep Oct Nov Dec Jan Feb Mar Apr May Jun 4Q20
       Aug   Sep    Oct   Nov   Dec   Jan    Feb    Mar   Apr   May    Jun    Jul   Aug    Sep   Oct   Nov   Dec    Jan   Feb   Mar    Apr   May   Jun 4Q20
                   2018                                                 2019                                                          2020                                                        2018                                 2019                                            2020

                                      Under management                        Committed - deposit contract                                                                                                                                                                                      Successful
                                                                                                                                                                                                                              Málaga            Madrid
                                                                                                                                                                                                                                                                                               turn around
                                                                                                                                                   Target             Real                                                                                                                       process
                                      Occupancy rate (% rented housing)**                                                                                                                          Late payment rate – unpaid monthly rent (% revenues)**

                                                                95% 95%              94% 92% 93% 91% 92%                 93% 95%
                                                                                                                                                                                                                                                              - More than 6% come from old tenants
                                                                             89% 88%                     90% 92% 91% 90%
                                                                                                                             96%
                                                                                                                                                              We are already                                                                                  which will leave in 18 month.
      95% 95% 95% 95% 95% 95% 95% 95% 95% 95%
                                                                                                                                                              nearly 100%                                                                                     - Target ratio 2020 YE-> > 5%.
                                                                                                                   83% 85% 84%                                booked in Coliving
                                                                                                                                      77%                                                                                                                     - Estimation 4Q20 7% - 9%
                                                                                          75% 74%
                                                                                                  72% 70%                                    71% 70%
                                                                      64% 66% 65%
                                            Carlos III Coliving
                                            project acquisition
                                                                                                                                                                                                                                                                                             14% 14%
                                                                                                                                                                                        10% 9%                                                10%                                      11%
                                                                                                                                                                                                         8%                                              8%                                            9%
                                                                                                                                                                                   7%                         8%   6%   8%                          7%        7%   7%   6%
                                                                                                                                                                                                   6%                        5%         5%                                   6%   6%
                                                                                                                                                                                                                       3% 2%
      Aug Sep Oct Nov Dec Jan Feb Mar Apr May Jun                            Jul    Aug Sep Oct Nov Dec Jan Feb Mar Apr May Jun 4Q20                                               Aug Sep Oct Nov Dec Jan Feb Mar Apr May Jun           Jul Aug Sep Oct Nov Dec Jan Feb Mar Apr May Jun 4Q20
                   2018                                                2019                                                           2020                                                        2018                                  2019                                  2020
                          Occupancy Rate                                            Occupancy Rate exc. Coliving
* Excluding Carlos III – Coliving project
** Around 2% are commercial spaces which cannot be rented neither be adapted into apartments and 3% of unoccupied rate will turn into contracts in 12 months as proindiviso dissolvent process will come to an end and legalization of commercial
spaces will be approved to turn into apartments
*** Considering pending rents to be paid by Malaga city hall
Main finance KPI                                                                                                       New school
                                                                                                                      year 2020-21
                                                     Revenues (k EUR)                                                                                                                             NAV / Share (EUR)
                                                                                                Second half
 100                                                                                                                                  1.200         35
                                                                                               student arrival
  90
                                                                                                                               90     1.000         30
  80                                                           Coliving kick off                                                                                                                                            29,7                       29,1
  70                                                               activity                           76   74                                       25
                            Callejo project                                                     70                                    800                                                         24,7
  60                                                                                                            67   66
                             acquisition                                             60   59                              59                        20
  50 Adquisición P.                                                        55   57                                                    600                               20,0
        Nadine                                                  49    49
  40                                      44    45   44   46                                                                                        15
                                39   41
                           37                                                                                                         400
  30                  32                                                                                                                            10
  20
                                                                                                                                      200
  10             16                                                                                                                                   5
       10   11
   0                                                                                                                                  0
       Ago Sep Oct Nov Dic Ene Feb Mar Abr May Jun Jul Ago Sep Oct Nov Dic Ene Feb Mar Apr May Jun Sep
                                                                                                                                                      0
                                                                                                                                                                    Gavari launch              2018 - 31.12            2019 - prom. 4Q              2020 - 31.03
              2018                              2019                                  2020
                                               Revenues              Revenues (Run Rate)                                                                       Note:= ECO Asset valuation per project + Capex ; updated every 31.12 RICS standard by CBRE] / # shares

                                                                                                                               Target              Real

                                               Gross Yield (%)                                                                                                                                           LTV (%)
 12%                                                                                                                                                100%
                                                                                                                                     New school
                                                                                                     Students arrival +
 10%                                                                                                                                year 2020-21
                                                                                                      end of Carlos III                               80%
                   Nadine project                                                                      refurbishment
  8%
                    Acquisition                                                                       8,1%
                                                                                                                                                      60%
        7,4%7,3%                      7,3%7,1%                                    7,5%7,2%
  6%                              6,8%        6,9%                            6,9%
                          6,2%6,5%                                                        6,5%6,5%
                                                      6,0%5,9%        6,1%5,9%                                                                                                                                                     50,7%52% 50%
                      5,6%                        5,7%        5,7%5,9%                            5,8%                                                                                                                      48% 49%
                                                                                                                                                      40%
  4%                                                                                                                                                                                                                                              37% 37% 37% 37% 38%
                                                                                                                                                                                              53% 52% 52% 53% 52% 52% 55%
                 3,4%                                                                                                                                                   47% 44% 44% 43% 43%
                                                                                                                                                      20%
  2%

  0%                                                                                                                                                      0%    0% 0%
        Ago Sep Oct Nov Dic Ene Feb Mar Abr May Jun Jul Ago Sept Oct Nov Dic Ene Feb Mar Apr May Jun Sep                                                        Ago Sep Oct Nov Dic Ene Feb Mar Abr May Jun Jul Ago Sep Oct Nov Dic Ene Feb Mar Apr May Jun Sep
               2018                              2019                                   2020                                                                           2018                              2019                                   2020

Gross yield = Revenues / assets (books)                                                                                                                               Valuation as of 31.12.2019              Valuation 2018 + New acquisitions + Capex
                                                                                                                                                               Note:= 4Q is taking CBRE assets valuation as of 31.12.2019
Gavari Properties Team

   José de Cabo          Juan Merino   Lidia Arribas
Associated advisors with vast experience in socimis
(REITs) and real estate

Tax                                 Legal   Legal – Real Estate

Valuation                           Audit   Registered Advisor

Property managament - Operational           Liquidity supplier
Main targert areas
MADRID

Ciudad Lineal
  — Pueblo nuevo
  — Ventas

San Blas
  — Simancas
Puente de Vallecas
  — Numancia
  — Portazgo
  — San Diego
Municipios limítrofes
   — Getafe
   — Leganés
   — Móstoles
   — Etc…
 Nota:
 Investments could be expanded to other areas in exceptional
 circumstances in the case of identifying highly attractive
 opportunities and with the approval of the Advisory Board.
Main target areas
MÁLAGA

Teatinos
 — Teatinos

Cruz de Humilladero
 — Carranque
 — Haza Cuevas
 — Cruz del humilladero
 — Los Tilos
 — Santa Cristina
Pipeline at a glance…

                                                                 Current pipeline ≈ 60 M €
                                                                         by total estimated investment

                                                                                                                                                                                    • Current pipeline mainly focused in
                                                                                                                                                                                      Madrid.
                                                                                                                                  0
                                                                                                                                                                                    • c. 35 M EUR in advanced analysis or
                                                                                                                  20%                                                                 under negotiations and c. 25 M EUR in
                                                                                                                                                                                      preliminary analysis phase.
                                                    25%

                    35%                                                                                                                                                             • Pipeline YoC(6) in the range of 6% to 10%.
                                                                                                                                             40%
                                                                                                                                                                                    • Pipeline of 10 – 15 transactions and 400 –
                                                                                                                                                                                      500 apartments.

                                                                                                                                                                                    • Average acquisition cost of 1.800 EUR/m2
                       Preliminaty analysis (1)                                                                          Value Add (4)
                                                                                                                         Core & Core+ (3)                                           • Great skills to develop new
                       Advanced analysis & under
                       negotiation (2)                                                                                   Others (5)                                                   opportunities

Note: (1) Information regarding the property received but such information is either incomplete or has not yet been fully analyzed; (2) Enough information has been received, analyzed and considered adequate to perform an advanced analysis of the
property, or negotiations are already ongoing with the potential seller; (3) Core: stabilized assets; Core+: assets in which minor refurbishments or changes in tenancy are expected; (4) Value Add: assets where ongoing/planned repositioning/full
refurbishment programs and/or significant capex investment are expected; (5) Other: potential properties to be built in an urbanized plot of land or properties where more than 50% of the existing building is demolished or removed and must be
redeveloped;; (6) YoC: “Yield on Cost”
Some potential transactions / operations (PIPELINE)
                                                                                 m2 valuation       m2 valuation incl.                             Revisionary Yield @
                                                             Acquisition Price
 Project              Location                     # Units                       acquisition        Capex + expenses          Acquisition Yield    Market Price (100%
                                                             (EUR)
                                                                                 (€/m2)             (€/m2)                                         occupancy rate)

 A                   Málaga                        16        672.000             700                919                       2,9%                9,7%

 B                   Madrid                        18        2.2500.000          1.400              1.590                     4,0%                7,6%

 C                   Madrid                        26        3.460.000           1.752              2.211                     0,0%                7,0%

 D                   Madrid                        18        2.500.000           1.213              1.530                     0,0%                7,4%

 E                   Madrid                        18        2.750.000           2.245              2.850                     0,0%                6,8%

 F                   Málaga                        50        4.000.000           1.333              2.241                     0,0%                7,1%

 G                   Getafe                        26        2.500.000           1.613              2.120                     4,2%                7,1%

 H                   Getafe                        1         750.000             519                589                       9,5%                8,4%

 I                   Getafe                        15        1.050.000           1.225              1.755                     4,3%                8,4%

 J                   Getafe                        22        2.652.250           1.612              1.612                     0,0%                8,2%

 K                   Madrid                        49        7.500.000           2.273              2.914                     0,0%                6,7%

Note: the availability of these operations at the time of execution is not guaranteed, nor does it have to be available in the terms and conditions known to the date of this
publication
Yield = Unleveraged gross yield @ 100% occupancy
Current porfolio
Madrid
Getafe
(Universidad Carlos III)

    Full building
Co-living project – Carlos III

Carlos III – Calle Daoiz, 46 y Sanchez Morate, 27 (Getafe-Madrid)   Carlos III – Calle Daoiz 38, 40, 42 (Getafe-Madrid)
Co-living project – Carlos III

          Carlos III project – Calle Daoiz, 46 y Sanchez Morate, 27 (Getafe-Madrid) after full refurbishment
Co-living project – Carlos III

Carlos III project – Interior pilot house de Calle Daoiz, 46   Carlos III project – Interior pilot housede Calle Daoiz, 46
Co-living project – Carlos III

Carlos III – Interior Calle Daoiz, 40 Segundo Izquierda   Carlos III – Interior Calle Daoiz, 40 Segundo Izquierda
Co-living project – Carlos III

Carlos III – Calle Daoiz, 42 Segundo Izquierda   Carlos III – Calle Daoiz, 42 Segundo Izquierda
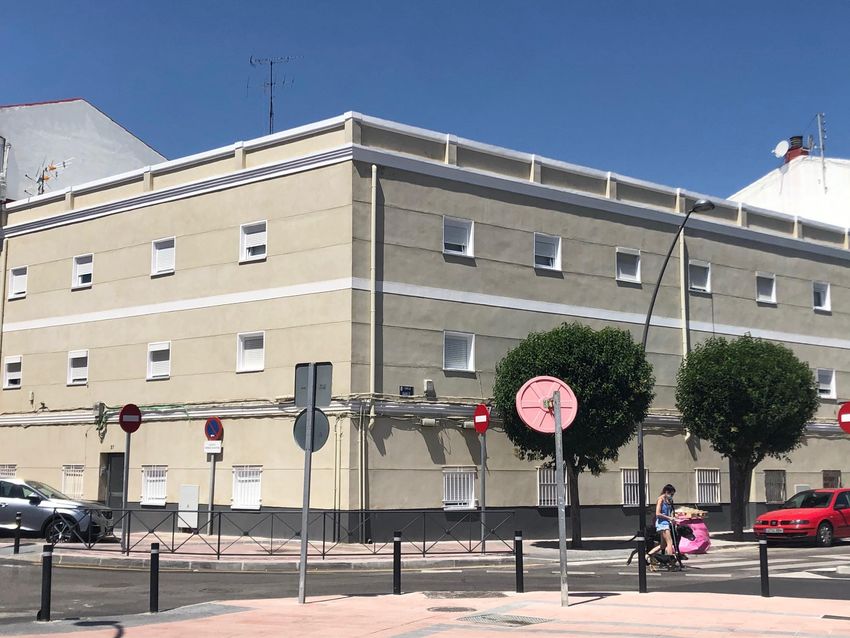
Málaga
C. Humilladero

  Full building
Long term rental projects

Nadine project – Calle Carceleras 3 - 5 – 7 (Málaga)   Nadine project – Calle Carceleras 3 (Málaga)
Long term rental projects

Nadine project – Calle Carceleras 7 (Málaga)   Nadine project – Calle Caña 7 (Málaga)
Long term rental projects

Nadine project – Calle Leandro Martinez 37 & Caña 7 (Málaga)   Nadine project – Calle Leandro Martinez 37 (Málaga)
Long term rental projects

Cherry project – Pasaje Dolores Cerezo 2-4 (Málaga)   Cherry project – Pasaje Dolores Cerezo 2-4 (Málaga)
Long term rental projects

Nadine project – Carceleras 3   Nadine project – Leandro Mtnez. 37
Long term rental projects

Callejo project – Callejo 2   Nadine project – Caña 7
Madrid
Ciudad Lineal

  Full building

  Single apartmets (dispersed)
Madrid
Puente Vallecas

  Full building

  Single apartmets (dispersed)
Long term rental projects

Aportación project – Calle Yecla 7   Aportación project – Lopez Grass 29
Long term rental projects

Callejo project – Calle Callejo 2 (Madrid)   Callejo project – Calle Callejo 2 (Madrid)
Long term rental projects

Callejo project – Calle Callejo 2 (Madrid)   Callejo project – Calle Callejo 2 (Madrid)
Capital increase 4Q20

       Subscription Price       23,5 EUR / share vs. ≈ 29,0 EUR / share NAV as of 31.07.2020 (-18% discount)

     Investment return target   1,6x – 2,0x invested capital – including in this amount a 5% yearly net dividend after asset repositioning

          Tax efficiency
                                Current capital increase -> 700k EUR
           > 5% stake

     Shareholders agreement     There´s any agreement currently and the company is managed according to capital markets Spanish law.

     Management Company         GavariAM (Gavari Assets Management S.L.)

                                Asset Management fees: 0,85% on GAV
       Management Fees          Carry: 25% performance fee / 8% hurdle rate (TIR)

                                Full portfolio selling to Private fund, Insurance Company, Socimi (Reit), etc. at ≈6,5% - 5,5% gross exit yield
            Exit Plan           target
Confidenciality

 The present document has been prepared exclusively for the internal use and benefit of the recipient, with the objective of indicating, in a preliminary manner, the viability of one or several
 transactions. This document is incomplete without reference to, and must be only considered together with, the oral explanation by Gavari Properties Socimi S.A.. Neither the document nor any part
 of its content can be used for any other purpose without previous written consent from Gavari Properties Socimi S.A.. (Gavari from now on).

 The content of this document, in what refers to the current situation, financial projections, opinions and company and business expectations that it carries out, is based on information that is
 considered correct and has been obtained in good faith from the available public information, from Gavari Properties’ own estimations and from other sources. Nevertheless, neither Gavari
 Properties, nor any society from the group, nor their respective managers, executives or employees, guarantees the content’s integrity or exactitude of the Document.

 Gavari has not carried out nor obtained from an expert an external verification on the exactitude and integrity of the information that has been used as the basis for the elaboration of this
 presentation, nor a confirmation of the reasonability of the hypothesis used.

 The financial projections included in this report are founded, as well, in the economic and market conditions prevailing to date, which could experiment variations, which would lead to a revision of
 some of the hypothesis assumed in it.

 Accordingly to the above stated, neither Gavari Properties, nor any other business of its respective groups, nor its respective managers, executives and employees, takes any responsibility for the
 damages that, directly or indirectly, could derive from the decisions adopted on the base of this document or the use that its recipients make of it.

 Neither the information contained in this report, nor any other information that could be provided in the future to its recipient, can be taken as a reference for the formalization of any operation.

 The operation this document refers to can be affected by special normative dispositions, by which said implications should be object of fiscal, legal and regulatory analysis and advice by an
 independent expert.

 The reception of this document by its recipient implies the full acceptance of the content of the present previous note.
Juan Merino
M: +34 619 210 999
T: +34 91 298 61 52
E: jmerino@gavariproperties.com
You can also read