SEALINK TRAVEL GROUP LIMITED - INVESTOR PRESENTATION - YEAR ENDED 30 JUNE 2018 22 AUGUST 2018
←
→
Page content transcription
If your browser does not render page correctly, please read the page content below

SeaLink           Travel        Group        Limited
Investor Presentation – Year Ended 30 June 2018

22 August 2018

CRUISES | TOURS | TRANSPORT | ACCOMMODATION | PACKAGES
Presenting today
Jeff Ellison
Chief Executive Officer and Managing Director

Andrew Muir
Chief Financial Officer

CRUISES | TOURS | TRANSPORT | ACCOMMODATION | PACKAGES

01
Highlights
Business highlights
‘A year of investment for future growth’
Sales of $209.4m up 4% on FY17
Underlying Net Profit After Tax of $22.1m, down $1.7m or 7.0% before one-off transaction costs and new
ferry route start up costs (refer next slide)
Successful acquisition of Kingfisher Bay Resort Group on iconic Fraser Island (two resorts, touring and
ferry operations)
Successfully awarded a 10+10 year contract to operate the Bruny Island ferry in Tasmania
Launch of Manly to Barangaroo service in NSW, September 2017
Launch of Rottnest Island service in WA, November 2017
“One SeaLink” sales and marketing strategy to capitalise on 8.5 million passenger per year
UWAI provides opportunity to grow revenue from the fast growing Chinese market
Further investment in information technology to drive online sales
Final dividend of 8.0 cents per share in line with FY17. Total dividend of 14.5 cents per share up 3.6% from
14.0 cents per share in FY17
PAGE 4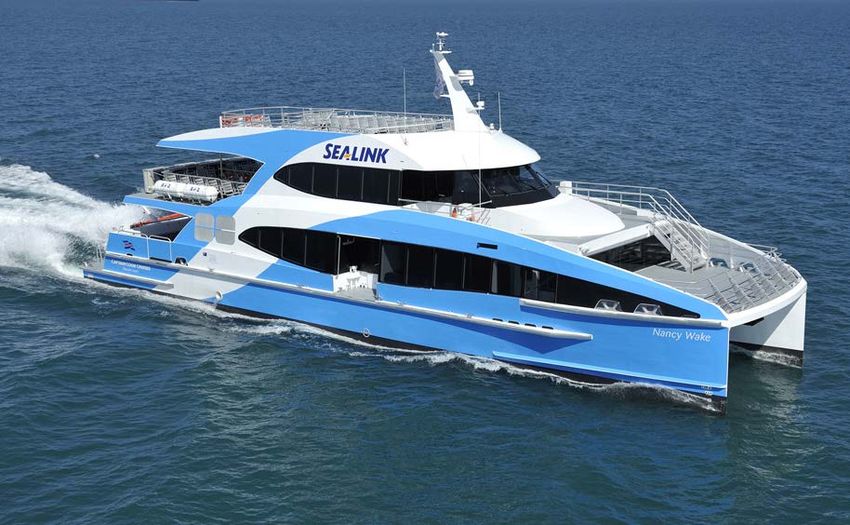
One-off costs from growth initiatives
impacting FY18 result
Normalised adjustments / abnormal costs – excluded from underlying profit
Transaction costs – ($2.6m) Year ending 30 June 2018 $m (EBIT)
Relating to the acquisition of Kingfisher Bay Resort
Transaction costs 2.6
Group which completed 26 March 2018
Start-up costs – new routes 0.4
Start-up costs of new ferry routes ($0.4m) Total 3.0
Launch of Manly to Barangaroo service in NSW,
September 2017
Launch of Rottnest Island service in WA,
November 2017
PAGE 5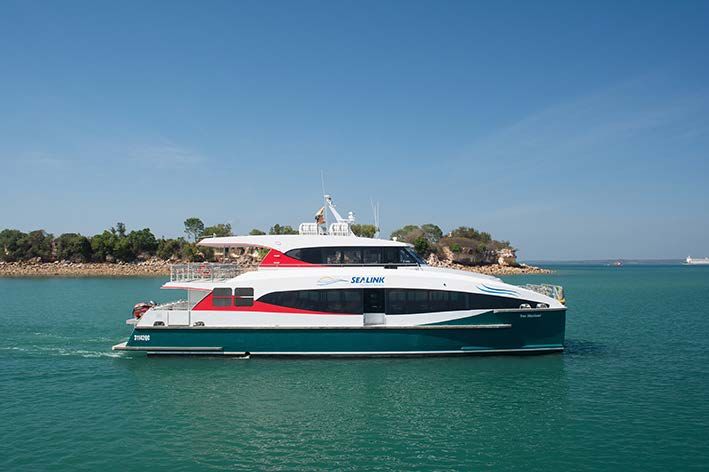
One-off costs from growth initiatives
impacting FY18 result (cont)
Trading losses absorbed in underlying profit
Trading losses on new ferry routes ($1.8m) Year ending 30 June 2018 $m (EBIT)
Slower ramp up to profitability than expected on
Trading loss – new routes 1.8
Manly / Barangaroo service still operating below break
even. Anticipated to make a positive contribution in Trading loss – Fraser Island 1.0
FY19
Rottnest Island route recorded a positive EBITDA Total 2.8
contribution for the period
Trading loss from Fraser Island ($1.0m)
Anticipated three month trading loss for Fraser Island
post acquisition in March 18 during non-peak/
low season
PAGE 6
2019 outlook
SeaLink positioned for strong profit growth
Capitalise on our year of investment with anticipated strong profit growth
Key drivers of profit improvement are:
— anticipated reversal of trading losses from new ferry routes - $1.8m [organic]
— anticipated reversal of trading losses in Western Australia - $0.7m [organic]
— full year EBITDA contribution of the Fraser Island acquisition - $7.9m [acquisition]
— contribution from the service to Bruny Island – September 2018 [new route]
— growth in existing businesses [organic]
— potential upside from future acquisitions [M&A]
— anticipated lower tax rate in FY19 – benefit of industry incentives
We believe SeaLink is positioned to substantially improve upon its FY18 full year underlying NPAT
result, assuming average seasonal and current business conditions remain stable
PAGE 7
Summary profit statement
Year ending 30 June 2018 $m 2017 $m Growth $m Growth % Operating revenue rising to $209.4m, up
Revenue 209.4 201.4 8.0 4.0 4%, driven by new ferry services and
impact of Fraser Island acquisition offset
Operating expenses (before 163.0 152.0 11.0 7.2
by retail travel centre closure (June 17)
interest, acquisition expenses,
depreciation and amortisation) and lower revenue in Gladstone (FY17 still
in construction phase)
Underlying EBITDA 46.5 49.4 (2.9) (5.9)
Operating expenses increase due to
EBITDA margin 22.2% 24.5% (2.3) (9.4)
Fraser Island, higher fuel costs, higher
Depreciation & amortisation 12.9 11.9 1.0 8.0 R&M and increased employee headcount
Underlying EBIT 33.6 37.5 (3.9) (10.4) associated with One SeaLink strategy
Net Interest expense 3.1 3.2 (0.1) 41.0 Underlying EBITDA down 5.9% to $46.5m
– as a result of excluding one off
Transaction costs 2.6 – 2.6 (100.0)
transaction costs ($3.0m) but after
One off start up costs 0.4 – 0.4 (100.0) absorbing losses associated with new
Net profit before tax 30.5 34.3 (3.8) (11.1) ferry start up routes ($1.8m) and Fraser
Island ($1.0m)
Income tax expense 7.9 10.4 (2.5) (24.8)
Higher depreciation, includes amortisation
Reported NPAT 19.6 23.8 (4.3) (17.9)
($1.6m) for customer contracts and impact
Underlying NPAT 22.1 23.8 (1.8) (7.1) of Fraser Island acquisition
Basic EPS – cents per share 21.8 23.6 (1.8) (7.6) Fuel consumption approximately 13
million litres of which 50% now effectively
hedged
PAGE 8
Statement of financial position
Total assets and net assets – $m June June Change
320 160 2018 $m 2017 $m $m
300
280 140 Total assets 300.7 239.5 61.2
260
240 120
220 Total liabilities 148.4 91.8 56.6
200 100
180 Net assets 152.3 147.7 4.6
80
160
140 60 Net Interest Bearing Debt (IBD) 105.3 61.1 44.2
120
100 40
80 Gearing (debt to total tangible assets %) 46% 31%
60 20
40 Debt / EBITDA (times) 2.27 1.25
20 0
FY14 FY15 FY16 FY17 FY18
Total asset (LHS) Net assets (RHS)
Net assets increased by $4.6m
Gearing Total assets increase reflects Fraser Island acquisition
60%
Total liabilities up due to increase in borrowings to fund Fraser Island
50% acquisition
40% Interest bearing debt up from $61.1m to $105.3m
30% Interest cover 15+ times
20% All bank covenants met
10% Gearing within target range
0%
FY14 FY15 FY16 FY17 FY18
PAGE 9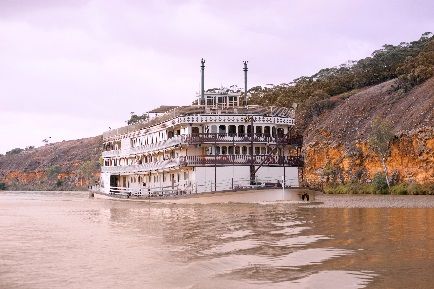
Cash flow
Year ending 30 June 2018 $m 2017 $m Change $m Good earnings quality with continuing strong
Receipts from customers 208.3 206.3 2.0 correlation between EBITDA of $46.5m and gross
operating cash flow of $46.7m
Payments to suppliers (161.6) (154.0) (7.5)
Net operating cash flow up 10.9%
Gross operating cash flow 46.7 52.3 (5.6)
Higher Income Tax paid in FY17 related to the
Net interest (3.1) (3.2) 0.1 Transit Systems acquisition payment (one off)
Income tax paid (15.1) (23.5) 8.3 Net investing cashflow includes:
Net operating cash flow 28.5 25.7 2.8 Item $m
Fraser Island acquisition 44.7
Net investing cash flows 61.0 6.1 54.9 UWAI investment 3.3
Proceeds from share issue N/A N/A – Sub total 48.0
Proceeds from borrowings 47.4 (6.0) 53.4 Marine Fleet 9.7
Dividends paid (14.7) (13.7) (1.0) Coaches & vehicles 1.6
Net financing cash flows 32.7 (19.7) 52.4 Plant & equipment 1.3
Cash at the end of the year 3.2 2.9 0.3 Buildings 0.4
Sub total 13.0
Total 61.0
Anticipated FY19 Capex approximately $18m-$19m
PAGE 1002 Segment performance
Business unit results
SeaLink South Australia
2018 2017 Variance News Retail travel centre closed July 2017
Year ending 30 June $m $m $m
Record passenger & vehicle numbers on KI ferries
Revenue (external) (Ferry, PS 64.2 67.5 (3.3)
Strong demand for PS Murray Princess, with occupancy
Murray Princess, coach tours, retail
increasing to 91% in FY18 from 87% in FY17
travel centre, accommodation)
Good season for farmers on KI – increased freight
Direct expenses 35.9 39.9 (4.0)
New passenger only competitor on KI route delayed
Indirect expenses 7.5 7.5 –
Completion of airport extension on KI – no sales impact
EBITDA (pre corp. allocation) 20.8 20.1 0.7
21 cruise ship visits to Kangaroo Island with island
EBITDA margin 32.4% 29.8% touring. 30 scheduled for FY19
Depreciation & amortisation 2.6 2.3 0.3 SA Government licence extension discussions with new
corporate allocation 3.2 3.1 0.1 Government (post 2024)
EBIT (after corp. allocation) 15.0 14.7 0.3 Additions 1 new Scania coach + 2 Coasters
Sales decrease reflects closure of retail travel centre ($3.2m) and lower accommodation sales ($0.7m) offset by a combination
of higher sales from PS Murray Princess, coach revenue, KI Odyssey and core ferry operations
EBITDA margin growth of 8.7% reflecting trend towards higher margin products and operating leverage of higher passengers
Travel centre sales down $3.2m with little impact on EBITDA, thereby aiding margin growth
R&M increased by $0.5m due to out of water works on Murray Princess
Direct and Indirect expenses well managed
Expected earnings in FY19 broadly in line with FY18 as FY19 has a major 15 year out of water survey for main KI vessel ($1m)
PAGE 12Business unit results
Captain Cook Cruises, NSW & WA
2018 2017 Variance News Negotiation of preferred arrangements with national retail
Year ending 30 June $m $m $m travel agencies
Investment in UWAI to build our direct to market
Revenue (external) 55.2 51.0 4.2
channels in China and Asia
Direct expenses 40.5 34.3 6.2 Manly to Barangaroo ferry service commenced
September 2017 near break even
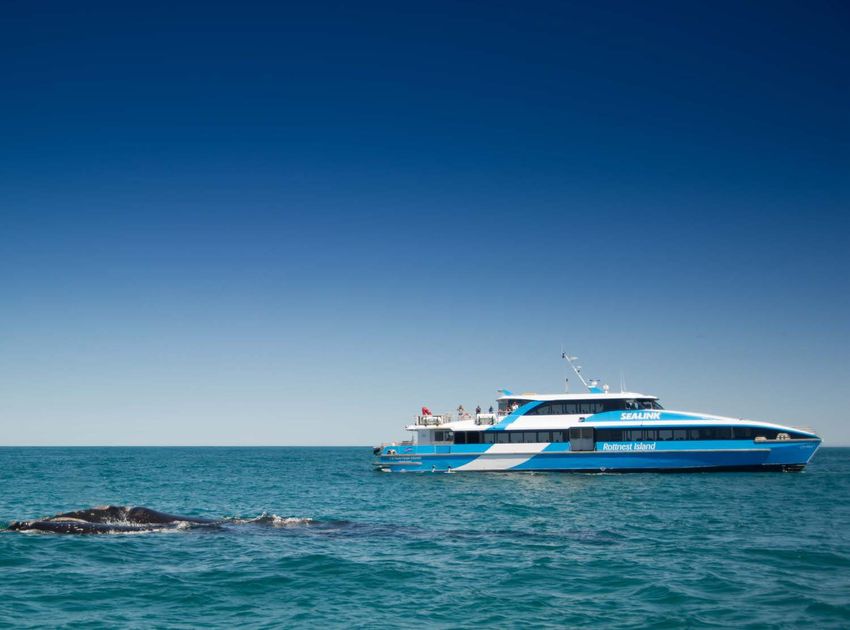
Indirect expenses 11.7 10.6 1.1 Rottnest Island ferry service commenced
November 2017
EBITDA (pre corp. allocation) 3.0 6.1 (3.1) CCC-WA the only commercial operator with access to
Perth’s new Optus Stadium wharf
EBITDA margin 5.4% 12.0%
Additions MV Nancy Wake (Sydney)
Depreciation & amortisation 2.5 2.4 0.1
Two new light ferries under construction to take this fleet
corporate allocation 1.1 1.1 – to four. Due in first quarter of FY19
EBIT (after corp. allocation) (0.6) 2.6 (3.2) Upgrades Refurbishment of Captain Cook III
Executed the plan to organically build new routes rather than acquire and recognise significant goodwill
One off start up costs ($0.4m) and trading losses from new services ($1.8m) – expect a positive net contribution from NSW in FY19
CCC-WA trading loss of ($0.7m) – given initiatives undertaken we expect a positive net contribution in FY19
CCC-NSW sales growth of 3.0% in 2018, with growth coming from dining cruises and Manly/Barangaroo route
Economic conditions in WA showing some signs of improvement
Focus on improving demand and yield in WA and the Manly / Barangaroo service
PAGE 13Business unit results
SeaLink Queensland & NT
2018 2017 Variance News Sales reduction reflects prior year construction phase
Year ending 30 June $m $m $m revenue in Gladstone
North Stradbroke Island continues to grow both
Revenue (external) 78.4 82.9 (4.5) passenger and vehicle numbers
Successful launch of a tourist coach offering to North
Direct expenses 38.4 42.2 (3.8)
Stradbroke Island
Indirect expenses 10.9 11.5 (0.6) MV Quandamooka leased to Weipa
Townsville sales up 8% across core businesses
EBITDA (pre corp. allocation) 29.3 29.2 0.1 Extension and expansion of Groote Eylandt contract
EBITDA margin 37.4% 35.3% Additions Touring coach from South Australia
Upgrades MV Bruce
Depreciation & amortisation 7.2 7.2 –
corporate allocation 1.8 1.8 – Contracts Southern Moreton Bay Islands contract renewal
negotiations are well advanced
EBIT (after corp. allocation) 20.3 20.2 0.1 Expression of interest submitted for the Mandorah and
Tiwi Islands contracts (expire August 2018)
EBITDA margins improvement a result of increased passenger and vehicle numbers
Gladstone and SEQ business performing to expectations
Gladstone revenue in FY17 included four months construction phase revenues ($10.5m)
Sales growth from Townsville and NT operations driven by Magnetic Island backpacker/adventure market and new NT ferry
service (Groote Eylandt)
PAGE 14Business unit results
Fraser Island
2018 2017 Variance News The business and assets of Kingfisher Bay Resort Group
Year ending 30 June $m $m $m acquired on 26 March, 2018
Revenue (external) 11.5 – 11.5 Acquisition includes Kingfisher Bay Resort, Eurong
Beach Resort, Fraser Explorer Tours and Fraser Island
Direct expenses 10.4 – (10.4) Ferry operations
Indirect expenses 1.3 – (1.3) Kingfisher Bay Resort Group accounts for 90% of
accommodation options and the vast majority of touring
EBITDA (pre corp. allocation) (0.3) – (0.3) options on Fraser Island
EBITDA margin (2.6%) – Planning complete for refurbishment and upgrade. An
additional Capex of $4m spread over next two years
Depreciation & amortisation 0.7 – (0.7) July 2018 trading ahead of expectations
EBIT (before corp. allocation) (1.0) – (1.0)
Transaction costs 2.6 – (2.6)
corporate allocation 0.4 (0.4)
EBIT (after corp. allocation) (4.0) – (4.0)
Pleased with acquisition and no adverse matters have been identified post acquisition
EBIT loss of $1.0m for the three months to June 30, 2018, which is in line with our expectations as this is the non-peak /low
season for the business
Capex programme for 2019 has identified key areas to enhance the customer experience, including upgrade to staff
accommodation, room upgrades, public area upgrades and new coaches
Expectation Fraser Island will contribute EBITDA ($7.9m) in line with acquisition metrics
PAGE 15Marine fleet and capital investment
77 vessels in the fleet
Fleet size and mix provides flexibility and opportunities
Delivery of MV Nancy Wake into NSW operating Manly to Barangaroo route
Two new Tubby Class ferries for inner harbour opportunities (ie Sydney Fish Markets) – delivery in
September 2018
Estimated Capital Expenditure in FY19 approximately $18m-$19m including:
— Usual maintenance capex;
— Fraser Island improvements;
— Bruny Island vessel; and
— SEQ Queensland barge replacement.
PAGE 1603 Performance outlook and focus
2019 Outlook and focus
SeaLink positioned for profit growth
Capitalise on our year of investment with strong profit growth
Maintain our Tourism/Transport focus
Seek acquisitions that enhance, leverage and complement our current capabilities and growth strategies
Key drivers of profit improvement are:
— anticipated reversal of trading losses from new ferry routes - $1.8m [organic]
— anticipated reversal of trading losses in Western Australia - $0.7m [organic]
— full year EBITDA contribution of the Fraser Island acquisition - $7.9m [acquisition]
— contribution from the service to Bruny Island – September 2018 [new route]
— growth in existing businesses [organic]
— potential upside from future acquisitions [M&A]
— anticipated lower tax rate in FY19 - benefit of industry incentives
We believe SeaLink is positioned to substantially improve upon its FY18 full year underlying NPAT result,
assuming average seasonal and current business conditions remain stable
PAGE 18Other matters
Retirement of Chief Executive Officer
27 years with SeaLink
21 years as CEO
5 years as CEO of ASX listed company
Jeff Ellison has indicated his intention to retire from
SeaLink on or before the AGM in October 2019
PAGE 19Appendices
Appendix 1
SeaLink Operational Snapshot
Location Services Fleet
South Passenger and freight ferry services between Cape Jervis and Kangaroo Island in South Australia 5 vessels
Australia Accommodation and restaurant facilities at Vivonne Bay Lodge on Kangaroo Island
Murray River cruising aboard the historic PS Murray Princess in South Australia (under the Captain Cook Cruises brand) 39 touring
Coach tours throughout South Australia and Kangaroo Island vehicles
Travel Agency in Adelaide, Australian Holiday Centre
Townsville Passenger ferry services between Townsville and Magnetic Island 4 vessels
Government contracted ferry service to Palm Island
Touring packages to Palm Island, Magnetic Island and around Townsville
Brisbane Contract passenger ferry service for the Queensland Government (Translink) to service four islands around the Southern Moreton Bay 19 vessels
Islands
Contract with Queensland Government to provide a water Ambulance service in the Southern Moreton Bay Islands
Contract with Queensland Department of Transport to operate the Moggill cable ferry crossing the Brisbane River
Barging of mineral sands from North Stradbroke Island to Brisbane
Passenger and vehicular ferry services from Cleveland (mainland) to Dunwich (North Stradbroke Island)
Vehicular barge service around the Southern Moreton Bay Islands, servicing Lamb, Karragarra, Macleay and Russel Islands
Gladstone Provision of barging and ferry services for the three LNG plants in Gladstone 12 vessels
Fraser Kingfisher Bay and Eurong Beach resorts 3 vessels
Island Passenger and vehicle ferry services to Fraser Island 30 touring
4WD touring on Fraser Island vehicles
Darwin Passenger ferry services between Darwin and Mandorah and a contracted ferry service to the Tiwi Islands 4 vessels
Passenger ferry and bus service on behalf of the Groote Eylandt community
Sydney Tourist cruises and other charter cruises on Sydney Harbour, including lunch and dinner cruises 20 vessels
Passenger ferry services between Lane Cove and Circular Quay, between Darling Harbour and Circular Quay and between Wilson’s Bay
and Circular Quay
Charter contracts for the provision of ferries to Harbour City Ferries (Sydney Ferries)
Passenger ferry service between Manly and Barangaroo
Perth Tourist cruises in Perth along the Swan River, including lunch and dinner cruises 10 vessels
Operation, on behalf of Transperth, of the commuter ferry service between the Perth CBD and South Perth
Passenger ferry service to Rottnest Island
Bells Function centre in Western Australia, an event space and catering facility
PAGE 21Appendix 2
Five Year Ratios and Statistics
Year ending 30 June 2014 2015 2016 2017 2018
Performance
Operating revenue $m 103.8 111.7 177.3 201.4 209.4
Underlying EBIT* $m 12.4 14.8 35.3 37.5 33.6
Underlying NPAT* $m 7.9 9.6 23.1 23.8 22.1
Underlying EPS* (basic) cents 11.8 12.6 23.6 23.6 21.8
Dividend per share (100% franked) cents 7.4 7.8 12.0 14.0 14.5
Payout ratio (reported NPAT) % 73.7 64.1 54.3 59.5 74.9
Financial strength
Net assets $m 53.9 61.3 137.0 147.7 152.3
NTA per share cents 61.7 68.9 89.0 100.0 101.0
Gearing % 17 13 33 31 46
* Before acquisition related expenses and ferry route start up costs
PAGE 22Important notice – disclaimer
This document has been prepared by SeaLink Travel Group Limited (ACN 127 894 893) (SeaLink or the Company). No party other than SeaLink
has authorised or caused the issue of this document, or takes responsibility for, or makes any statements, representations or undertakings in this
document.
Presentation of general background: This document contains general background information about SeaLink’s proposed activities current as
at the date of this presentation (Information). It is Information in a summary form only and does not contain all the information necessary to fully
evaluate any transaction or investment.
Not investment advice: The Information provided in this presentation is not intended to be relied upon as advice to investors or potential
investors.
Financial data: All dollar values are in Australian dollars (A$) unless otherwise stated.
Future performance: This presentation contains certain forward-looking statements. The words ‘anticipate’, ‘believe’, ‘expect’, ‘project’,
‘forecast’, ‘estimate’, ‘likely’, ‘intend’, ‘should’, ‘could’, ‘may’, ‘target’, ‘plan’ and other similar expressions are intended to identify forward-looking
statements. Indications of, and guidance on, future earnings and financial position and performance are also forward-looking statements. Such
forward-looking statements are not guarantees of future performance and involve known and unknown risks, uncertainties and other factors,
many of which are beyond the control of SeaLink, and its officers, employees, agents and associates, that may cause actual results to differ
materially from those expressed or implied in such statements. Actual results, performance or outcomes may differ materially from any
projections and forward-looking statements and the assumptions on which those assumptions are based. You should not place undue reliance on
forward-looking statements and neither SeaLink nor any of its directors, employees, servants, advisers or agents assume any obligation to update
such Information.
Confidentiality: This document and the Information contained herein is confidential to SeaLink. It is not intended for and should not be distributed
to any other person other than as permitted herein. By receipt of the document, the recipient agrees that it will not transmit, reproduce or make
available the document (or any Information contained herein) to anyone other than its professional advisers without the prior written consent of
SeaLink. Any such disclosure to the advisers of the recipient must be on a confidential basis, for the purposes only of assessing the Information
contained herein as adviser to the recipient.
For more information please contact: Michael Hughes, Commercial Director, SeaLink Travel Group, 0438 993 898 or
michael.hughes@sealink.com.au
PAGE 23You can also read