Market Update & Investment Briefing - February 18, 2021

Page created by Phillip Nichols
 
CONTINUE READING
Market Update & Investment Briefing - February 18, 2021
Market Update &
Investment Briefing
February 18, 2021
Market Update & Investment Briefing - February 18, 2021
Welcome

Mary Quilici Aumack
CHIEF EXECUTIVE OFFICER
Market Update & Investment Briefing - February 18, 2021
What We Do
Market Update & Investment Briefing - February 18, 2021
What We Do
Market Update & Investment Briefing - February 18, 2021
GROW = Wise, Catholic Investing
Market Update & Investment Briefing - February 18, 2021
Types of Funds

      Institutional and Purpose-         Family Philanthropy Funds
      Specific Endowments
         o Parishes, schools, agencies      o Donor Advised Funds
         o Outreach, vocations, etc.        o Family Endowments & Funds
Market Update & Investment Briefing - February 18, 2021
Endowment Overview

          Permanent support (FOREVER VALUE)               How Endowments Grow
                   o Reliable annual grant                  o Broad diversification
                                                            o Appropriate return over time

This Photo by Unknown Author is licensed under CC BY-NC
Market Update & Investment Briefing - February 18, 2021
Investment Objectives

                o Maximize Returns, Minimize Risk
                   o Diversification through Asset Allocation
                o Focus on Long Term, endowments are in perpetuity
                o Pool assets to capitalize on scale and access to top
                  managers
                o Responsible Investing
                   o Catholic Investing
                   o Impact Investing
                oEffective Partnerships
Market Update & Investment Briefing - February 18, 2021
2020 Foundation Investment
Performance
Sean Finigan
OPERATIONS MANAGER
Market Update & Investment Briefing - February 18, 2021
2020 Time of Transition

                o In February (before Covid-19)
                   o Foundation was focused on long-term health of the funds
                     and opted to switch investment advisors from Colonial
                     Consulting LLC to Jordan Park
                o Volatility
                   o 2020 unusual year of extreme volatility
                o Transition led to unusually large cash positions
                  during the year
Endowment Performance by Quarter

                                                    Five-Year Returns (annualized): Up 8.3%

       Q1                                  Q3                         End Results
       2020                                2020

         Down 18.5%                          Up over 6%               Up 5.4% for the year

                        Up 10.5%
                      Missed market rally due to larger
                      cash position and unable to take
                      advantage of rebalancing plan
                                                            Up 9.7%
                      Q2
                      2020                                Q4
                                                          2020
Investment Objectives

                o Maximize Returns, Minimize Risk
                   o Diversification through Asset Allocation
                o Focus on Long Term, endowments are in perpetuity
                o Pool assets to capitalize on scale and access to top
                  managers
                o Responsible Investing
                   o Catholic Investing
                   o Impact Investing
                oEffective Partnerships
Introduction to Jordan Park

Frank Ghali
FOUNDER, PRESIDENT & CHIEF EXECUTIVE OFFICER
Jordan Park provides investment management
and financial advice to a distinct community of
individuals, families, and institutions.
Our mission is to enhance lives and legacies.

                               Private and confidential   |
ESG/Impact Investing: State of the Industry
                 Driven by investor demand, the sustainable/ESG and impact investing markets
                             have continued to grow exponentially in recent years.

                                                                                                                           US-based AUM using
                                                                                                                           sustainable investing
                                                                                                                           strategies grew from $12
                                                                                                                           trillion in 2018 to $17.1
                                                                                                                           trillion in 2020, an increase
                                                                                                                           of 42%

                                                                                                                           This represents 33%, or one
                                                                                                                           in three dollars, of the
                                                                                                                           $51.4 trillion in total US
                                                                                                                           AUM in 2020

                                                                                                                           Simultaneously, the global
                                                                                                                           impact investing market
                                                                                                                           grew from $502 billion AUM
                                                                                                                           in 2018 to $715 billion as of
                                                                                                                           the end of 2019, a YOY
                                                                                                                           increase of 42.4%

                                                                                                                                  Private and confidential |   0
Source: The Forum for Sustainable and Responsible Investment (US SIF Foundation), Global Impact Investing Network (GIIN)
ESG/Impact Investing: Industry Trends
                                         Areas of greatest industry progress over the past decade,
                                                        also remain top challenges.

       •     Sophistication of impact measurement, management, and reporting practices

       •     High-quality investment opportunities with sufficient data, track record, and exit options

       •     Product proliferation leading to increased risk of or “impact-washing”

       •     Innovative deal structures and financing tools to accommodate investor needs

       •     Appropriate impact-oriented capital allocated across the risk/return spectrum

       •     Investment firms with varying impact capabilities and levels of expertise

       •     Inconsistent government and regulatory support of the market

                                                                                                     Private and confidential |   1
Source: Global Impact Investing Network (GIIN) 2020 Investor Survey
Customized Advice and Services to Enable Impact
 Across the financial spectrum – from philanthropy to investing – we partner with clients
         seeking effective and innovative strategies to promote positive change.

         Education &            Provide insight, support, and educational resources across a wide range of
         Guidance               ESG/impact investing and philanthropy-related topics

         Strategy Development Design tailored strategic plans that help clients explore, formulate, carry out, and
                              evaluate their impact objectives

         Entity Formation &     Assess, identify, and set up optimal impact funding structures based on client
         Funding                priorities (e.g., private foundations, donor-advised funds, LLCs)

          Research & Analysis   Source and conduct due diligence on funding opportunities in line with client
                                interests and preferences (e.g., thematic areas, geographies)

          Portfolio Alignment   Integrate SRI, ESG, and impact investing strategies across client portfolios in line with
                                their impact and financial goals

          Reporting             Track ESG, impact investment, and grant allocations alongside social and environmental
                                metrics of client portfolios

                                                                                                        Private and confidential |   2
2021 Market Update & Long-
Term Investments
Michel Del Buono
SENIOR VICE PRESIDENT, CHIEF INVESTMENT OFFICER
Departure From The Economic ICU In Sight

           •     Global economy will likely continue its recovery albeit at a slower pace than in
                 the second half of the year. U.S. real growth forecasted at -3.5% and +3.9% for
                 2020 and 2021, respectively.
           •     Another fiscal stimulus has occurred (5% of GDP) but will be overshadowed by
                 the significant shift in Federal Reserve policy, keeping interest rates low and
                 allowing inflation to run hotter to support the economy and labor market.
           •     We are positioning portfolios for the continued recovery by shifting some U.S.
                 equity exposure to sectors more sensitive to economic activity.
           •     The typical recovery results in longer-maturity interest rates rising, equity
                 valuation multiples falling, and earnings per share improving. Fed’s new policy
                 may change that narrative, improving the odds of continued equity market
                 strength.
           •     Long term, the economic backdrop will likely remain deflationary, thanks to
                 demographics, leverage, and productivity trends.

1   Source: Bloomberg, Bureau of Labor Statistics. As of 12/31/2020.
                                                                                        Private and confidential   |   1
Rally Driven By Powerful Global Economic Stimulus…

                                                                         Russell 1000 Total Return
  60%                                                                                                                                                                                  60%
                                               Total Return
                                              1-Year 2-Year
                Russell 1000                  21.0% 59.0%
  50%                                                                                                                                                                                  50%
                S&P 500                       18.4% 55.7%
                MSCI EAFE                      8.3% 32.8%
                MSCI EM                       18.5% 40.7%
  40%                                                                                                                                                                                  40%
                Bbg 1-10yr Muni                4.2% 10.1%
                Bbg US Agg                     7.5% 16.9%

  30%                                                                                                                                                                                  30%

                                                                                                                                                          +76%
  20%                                                                                                                                                                                  20%

  10%                                                                                                                                                                                  10%

                                                                                                     -34%

   0%                                                                                                                                                                                  0%

 -10%                                                                                                                                                                                  -10%

Source: Bloomberg, Jordan Park analysis. Past performance is not a guarantee of future results. Data as of 12/31/2020. Returns shown are inclusive of estimated dividends. The
performance of the index does not reflect the impact of fees, applicable taxes or trading costs which, unlike the index, may reduce the returns of a managed portfolio. Investors
cannot invest in an index.
                                                                                                                                                            Private and confidential    |     2
… And Vaccine Optimism
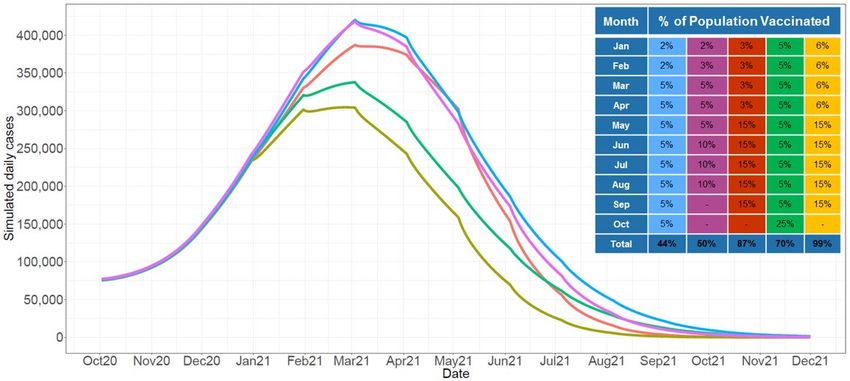
     Key to a rapid return to “normal” is the speed of vaccine rollout. Q4 is a safe bet unless
     mutations get in the way. If things go very well, late summer is a possibility.

                                 Implied “herd immunity”

Source: Morgan Stanley’s North America Biotechnology Research. Data as of 12/07/2020.   Private and confidential   |   3
Economic Outlook

                   Private and confidential   |   4
Swift Recovery After 2nd Quarter Recession
      Economic growth likely back on historic trend by mid-2021 and largely back to trend by
      2022. Growth likely to return to long-term potential of 1-2% thereafter.

            GDP US Chained 2012 Dollars QoQ SAAR                                                                             U.S. Real GDP
  40%                                                                                       21T                                                                              21T
                                                                                                                                           Largely Recovered
                     2020 consensus                               33.1%                                                                    by 2022
                     forecast is -3.5%
  30%                                                                                       20T                       Potential GDP                                          20T
                                                                                                                      Real GDP
  20%
                                                                                            19T                       Consensus Forecast*                                    19T

  10%
                                                                       4.5%                 18T                                                                              18T

    0%
                                                                                            17T                                                                              17T
                                                           -5.0%
 -10%
                                                                                            16T                                                                              16T
 -20%
                                                                                            15T                                                                              15T
 -30%
                                                              -31.4%                        14T                                                                              14T
 -40%
           Dec-2016

           Sep-2017
           Dec-2017

           Sep-2018
           Dec-2018

           Sep-2019
           Dec-2019

           Sep-2020
           Dec-2020

           Sep-2021
           Mar-2017

           Mar-2018

           Mar-2019

           Mar-2020

           Mar-2021
           Jun-2017

           Jun-2018

           Jun-2019

           Jun-2020

           Jun-2021

                                                                                            13T                                                                              13T
                                                                                                   2001
                                                                                                   2002
                                                                                                   2003
                                                                                                   2004
                                                                                                   2005
                                                                                                   2006
                                                                                                   2007
                                                                                                   2008
                                                                                                   2009
                                                                                                   2010
                                                                                                   2011
                                                                                                   2012
                                                                                                   2013
                                                                                                   2014
                                                                                                   2015
                                                                                                   2016
                                                                                                   2017
                                                                                                   2018
                                                                                                   2019
                                                                                                   2020
                                                                                                   2021
                                                                                                   2022
                                                                                                   2023
Source: Bloomberg, Congressional Budget Office. Data as of 12/11/2020. *Red dots represents forecasted results, not actual results. Forecasts are a combination of
official sources aggregated by Bloomberg. Growth rate assumed to be 1.8% long term. Estimates include official sources such as the Federal Reserve and European
Central Bank and unofficial sources such as banks and research providers.
                                                                                                                                                         Private and confidential   |   5
Policymakers Announce Assault On Deflationary Forces

        Aging Demographics                                                                      Increased Leverage
        1)     Developed world facing increasing share of                                       1)      Government, corporate, and household
               inactive population                                                                      sectors increasing borrowing exacerbated
                                                                                                        by COVID-19 crisis
        2)     Lowering consumption intensive phase of
               population lifecycle                                                             2)      Higher interest burden may limit growth
                                                                                                        opportunities
        3)     Outright population decline in some
               countries                                                                        3)      Heightened sensitivity to increased interest
                                                                                                        rates

                                          Potential growth rates across developed world
The Federal Reserve’s New Anti-Deflation Framework

                          Jargon: Targeting symmetrical inflation around 2% over a business cycle
                          Translation: Inflation is likely to average above 2% for an extended period
                          before the Fed considers tightening measures

                          Jargon: Employment is a broad-based and inclusive goal
                          Translation: Regional employment/inflation could run higher than the
                          national average before the Fed considers tightening measures

                          Jargon: May use Yield Curve Control (YCC) if interest rates rise beyond their
                          tolerance
                          Translation: The Fed may change their bond-buying program to target price
                          versus quantity of buying to help stimulate activity

     The Fed is no longer inflation fighters but inflation and labor market supporters.
      These changes reflect a substantial departure from past policies which we think
                                  are underappreciated.
Source: the Federal Reserve’s Statement on Longer-Run Goals, updated August 27, 2020, “In order to anchor longer-term inflation expectations at this level, the Committee seeks to
achieve inflation that averages 2 percent over time, and therefore judges that, following periods when inflation has been running persistently below 2 percent, appropriate monetary
policy will likely aim to achieve inflation moderately above 2 percent for some time.”
Additionally, From Chair Powell’s speech August 27, 2020, “With regard to the employment side of our mandate, our revised statement emphasizes that maximum employment is a
broad-based and inclusive goal. This change reflects our appreciation for the benefits of a strong labor market, particularly for many in low- and moderate-income communities.
                                                                                                                                                           Private and confidential    |   7
Potential Outcomes Of The Fed’s New Policy

                                                                          • Long-yields up, bonds sell off mostly, but                         Life back to normal
                                                Inflation +                 portfolio expected returns look better
                                               Growth >4%                 • Yield curve steepens, housing headwinds                            Portfolio [E]r reverts to long
                                                                          • Revenues up, margins down, valuation                               term averages EM and
                                                                            multiples down                                                     cyclicals lead the market
                                                                          • Dollar weakens, cash underperforms
                                                                          • Cyclical equity sectors outperform                                 70/30 portfolio “still works”
                                                                                                                                               approximating long-term
          Federal                                                                                                                              average returns.1
       Reserve’s New
        Framework

                                                                                                                                               “Japanification”
                                                                          • Bonds rally modestly
                                                Inflation +               • Lower long-term yields feedback into                               Defensive & growth sectors
                                               Growth
Long-Term EPS Trend Is Clear

                                                                S&P 500 Trailing 12m EPS

     180                                                                                                             180

     160                                                                                                             160
                                                                                           R² = 0.95
                                       S&P
                                      S&P  500
                                          500   Trailing
                                              Trailling   12m
                                                        12m EPSEPS
     140                                                                                                             140
                                       Exponential
                                      Expon.        (S&P
                                             (S&P 500     500 12m
                                                      Trailling Trailing
                                                                     EPS)12m EPS)

     120                                                                                                             120

     100                                                                                                             100

      80                                                                                                             80

      60                                                                                                             60

      40                                                                                                             40

      20                                                                                                             20

        0                                                                                                            0
            1981
            1982
            1983
            1984
            1985
            1986
            1987
            1988
            1989
            1990
            1991
            1992
            1993
            1994
            1995
            1996
            1997
            1998
            1999
            2000
            2001
            2002
            2003
            2004
            2005
            2006
            2007
            2008
            2009
            2010
            2011
            2012
            2013
            2014
            2015
            2016
            2017
            2018
            2019
            2020
Source: Bloomberg. Data as of 12/31/2020.
                                                                                                Private and confidential   |   9
Near-Term Trend Implies ~$155 For 2021 Earnings/Share
        We think there is merit in long-term trend reversion (not mean reversion).
        Consensus is more bullish w/ 2021 EPS around $170 per share.
                                                                                                                          S&P 500 Trailing 12m EPS
      170                                                                                                                                                                                                                                                                 Consensus                                   170

      160                                                                                                                                                                                                                                                                                                             160
                                                                                                                                                                                                                                                                                       Trend
      150                                                                                                                                                                                                                                                                                                             150

      140                                                                                                                                                                                                                                                                                                             140

      130                                                                                                                                                                                                                                                                                                             130

      120                                                                                                                                                                                                                                                                                                             120

      110                                                                                                                                                                                                                                                                                                             110

      100                                                                                                                                                                                                                                                                                                             100

        90                                                                                                                                                                                                                                                                                                            90

        80                                                                                                                                                                                                                                                                                                            80
                      Mar-14
                               Jun-14
                                        Sep-14

                                                          Mar-15
                                                                   Jun-15
                                                                            Sep-15

                                                                                              Mar-16
                                                                                                       Jun-16
                                                                                                                Sep-16

                                                                                                                                  Mar-17
                                                                                                                                           Jun-17
                                                                                                                                                    Sep-17

                                                                                                                                                                      Mar-18
                                                                                                                                                                               Jun-18
                                                                                                                                                                                        Sep-18

                                                                                                                                                                                                          Mar-19
                                                                                                                                                                                                                   Jun-19
                                                                                                                                                                                                                            Sep-19

                                                                                                                                                                                                                                              Mar-20
                                                                                                                                                                                                                                                       Jun-20
                                                                                                                                                                                                                                                                Sep-20

                                                                                                                                                                                                                                                                                  Mar-21
                                                                                                                                                                                                                                                                                           Jun-21
                                                                                                                                                                                                                                                                                                    Sep-21
             Dec-13

                                                 Dec-14

                                                                                     Dec-15

                                                                                                                         Dec-16

                                                                                                                                                             Dec-17

                                                                                                                                                                                                 Dec-18

                                                                                                                                                                                                                                     Dec-19

                                                                                                                                                                                                                                                                         Dec-20

                                                                                                                                                                                                                                                                                                             Dec-21
Source: Bloomberg. Data as of 12/31/20. A consensus estimate is a figure based on the combined estimates of analysts covering a public company. Generally, analysts give a
consensus for a company's earnings per share (EPS) and revenue; these figures are most often made for the quarter, fiscal year, and next fiscal year. The size of the company and the
number of analysts covering it will dictate the size of the pool from which the estimate is derived.                                                          Private and confidential                                                                                                                                      |   10
Backdrop Remains Constructive For Equities
      •      A “reasonable” estimate implies U.S. equities may have an above average year.
      •      Market Expects 1.2% 10-Yr Treasury Yield by end of 4Q 2021. the 21x times trailing three-year
             average was realized when 10-yr yield was 2.0%.
      •      If the Fed engages in YCC, it could boost multiples.
      •      In a typical recovery, growth and inflation expectations rise, pushing interest rates up and
             multiples down. Multiples may remain elevated this time if the market considers YCC a possibility.
                                                      Price-to-Earnings Multiple             Trl 3yr P/E Average
                                                        16x     17x     18x     19x   20x      21x       22x    23x   24x    25x    26x      27x    28x     29x    30x    31x
                   S&P 500 Earnings Per Share

                                                110    -53%    -50%    -47%   -44%    -41%    -38%    -35%    -32%    -29%   -26%   -23%     -20%   -17%   -14%    -11%   -9%
                                                115    -51%    -48%    -44%    -41%   -38%    -35%    -32%    -29%    -26%   -23%   -20%     -17%   -14%   -11%    -7%    -4%
                                                120    -48%    -45%    -42%    -39%   -36%    -32%    -29%    -26%    -23%   -20%   -16%     -13%   -10%    -7%    -3%    0%
                                                125    -46%    -43%    -40%    -36%   -33%    -30%    -26%    -23%    -20%   -16%   -13%     -9%     -6%    -3%     1%    4%
                                                130    -44%    -41%    -37%    -34%   -30%    -27%    -23%    -20%    -16%   -13%   -9%      -6% Current
                                                                                                                                                     -2%    1%      5%    8%
                                                135    -42%    -38%    -35%    -31%   -28%    -24%    -20%    -17%    -13%   -9%    -6%      -2%     1%     5%      9%    12%
                                                140    -40%    -36%    -32%    -29%   -25%    -21%    -17%    -14%    -10%   -6%    -2%      1%      5%     9%     13%    16%
                                                145    -38%    -34%    -30%    -26%   -22%    -18%    -14%    -11%    -7%    -3%    1%       5%      9%     13%    17%    21%
                                                                                                        Trend 2021
                                                150    -36%    -32%    -28%    -24%   -20%    -15%    -11%     -7%    -3%    1%     5%       9%     13%     17%    21%    25%
    Trend                                       155    -33%    -29%    -25%    -21%   -17%    -13%     -9%     -4%    0%     4%     8%       12%    16%     21%    25%    29%
    reversion
                                                160    -31%    -27%    -23%    -18%   -14%    -10%     -6%     -1%    3%     7%     12%      16%    20%     25%    29%    33%
                                                                                             Consensus 2021
                                                165    -29%    -25%    -20%    -16%   -11%     -7%     -3%     2%     6%     11%    15%      20%    24%     28%    33%    37%
Consensus                                       170    -27%    -22%    -18%    -13%   -9%      -4%     0%      5%     9%     14%    19%      23%    28%     32%    37%    41%
                                                175    -25%    -20%    -15%    -11%   -6%      -1%     3%      8%     13%    17%    22%      27%    31%     36%    41%    46%
                                                180    -23%    -18%    -13%    -8%    -3%      1%      6%      11%    16%    21%    26%      30%    35%     40%    45%    50%
                                                185    -21%    -16%    -11%    -6%    -1%      4%      9%      14%    19%    24%    29%      34%    39%     44%    49%    54%
                                                190    -18%    -13%    -8%     -3%    2%       7%      12%     17%    22%    27%    33%      38%    43%     48%    53%    58%

                                                                                             Increasing belief Fed will                    Increasing Fed credibility
                                                                                             "cave" in face of inflation
Source: Bloomberg. Data as of 12/31/2020. A consensus estimate is a figure based on the combined estimates of analysts covering a public company. Generally, analysts give a
consensus for a company's earnings per share (EPS) and revenue; these figures are most often made for the quarter, fiscal year, and next fiscal year. The size of the company and the
number of analysts covering it will dictate the size of the pool from which the estimate is derived.                                                          Private and confidential   |   11
Near-Term Catalysts

                      Private and confidential   |   12
Employers Appear Optimistic
        Despite a peak unemployment considerably higher than the Global Financial
        Crisis (GFC), permanent job losses reflect a better outlook.
                                                          US Unemployment Permanent Job Losers SA
                             8.0                                                                                                                  8.0

                             7.0                                                                                                                  7.0

                             6.0                                                                                                                  6.0

                             5.0                                                                                                                  5.0
        Millions of People

                                                                                                                                                        Millions of People
                                                                                                     Permanent job losses only half of GFC
                                                                                                     so far, possibly reflecting less slack in
                             4.0                                                                     the labor market than expected               4.0

                             3.0                                                                                                                  3.0

                             2.0                                                                                                                  2.0

                             1.0                                                                                                                  1.0

                             0.0                                                                                                                  0.0
                                2000 2001 2002 2003 2004 2005 2006 2007 2008 2009 2010 2011 2012 2013 2014 2015 2016 2017 2018 2019 2020

Source: Bloomberg, Bureau of Labor Statistics. Data as of 11/30/2020.
                                                                                                                                  Private and confidential                   |   13
Headline Household Savings Numbers Look Good
                      An enormous stock of savings has accumulated since the onset of the crisis, on
                      the scale of trillions of dollars.

                                  US Personal Savings SA, Quarterly                                         US Personal Saving as a % of Disposable
                     5,000                                                                                             Personal Income
                                                                                              30%
                     4,500

                     4,000                                                                    25%

                     3,500

                                                                                              20%
                     3,000
 Dollars, Billions

                     2,500
                                                                                              15%

                     2,000

                                                                                              10%
                     1,500

                     1,000
                                                                                               5%
                      500

                        0                                                                      0%
                             2011 2012 2013 2014 2015 2016 2017 2018 2019 2020                   2011 2012 2013 2014 2015 2016 2017 2018 2019 2020

Source: Bureau of Economic Analysis, Federal Reserve Bank of St. Louis, Bloomberg. Data as of 12/18/2020.                                Private and confidential   |   14
Stimulus Arriving “Just In Time”
       The value of fiscal stimulus is that it deploys capital to people in lower income
       quartiles who have a 100% propensity to consume.

                                                                                                                                                                              Increasing unemployment
Source JPMorgan Chase Institute. Data as of 12/20/2020. This chart shows year-over-year change in median checking account balances by income quartile. JPMorgan Chase Institute
assigns households into income quartiles based on their total labor income from 2019. Households in quartile 1 earned between $12,000 and $30,367 in labor income; quartile 2
households earned $30,268 to $44,905; quartile 3 households earned $44,906 to $68,795; and quartile 4 households earned more than $68,795.
                                                                                                                                                      Private and confidential                          |   15
Millennials Finally Buying Houses
                                                      US New One Family Houses Sold Annual Total SAAR
      1600
      1400
      1200
      1000
        800
        600
        400
        200
           0
            1963 1966 1969 1972 1975 1978 1981 1984 1987 1990 1993 1996 1999 2002 2005 2008 2011 2014 2017 2020

                                                           US New One Family Houses Sold Not Started
      60

      50

      40

      30

      20

      10

        0
         1963 1966 1969 1972 1975 1978 1981 1984 1987 1990 1993 1996 1999 2002 2005 2008 2011 2014 2017 2020

Source: Federal Reserve Bank of St. Louis, Bloomberg. Data as of 12/18/2020.                            Private and confidential   |   16
Early Thoughts On The Biden Administration
   We expect to see continued action through executive order. Likely to see focus on
   human rights, environmental management, and international cooperation – all areas
   where executive branch can influence outcomes.
   •   Ran on a centrist platform which likely means fewer policy “experiments.”
   •    Orthodox cabinet:
       • Treasury: Janet Yellen. Keynesian, ex Federal Reserve Chair, good cooperation
          expected between Federal Reserve and Treasury because of this.
       • State: Antony Blinken. The longtime Biden confidant served as No. 2 at the State
          Department and as deputy national security adviser in Obama's administration.
       • National Economic Council: Brian Deese. BlackRock executive with traditional
          perspective.
               Policies related to:   Potential Action:
                                      •    Increase income taxes
                                      •    Increase/add transfers
               Income Distribution
                                      •    Automatic/indexed minimum wage increases
                                      •    Increase taxes on unearned income
                                      •    Increase inheritance taxes
                                      •    Eliminate step-ups at death
               Wealth Distribution    •    Reduce charitable “outs”
                                      •    Increase corporate taxes
                                      •    Add wealth taxes
                                      •    Move from “insurance” to redistribution
                                      •    Green regulations for banking and financial sector
               Social Safety Net      •    Pension reform (defined benefit and defined
                                           contribution)
                                      •    Increase basic protections such as food stamps

                                                                                           Private and confidential   |   17
Negative Sentiment Towards China A Global Phenomenon

Source: Pew Research Center, Global Attitudes Survey 2020, Q8b. Data as of 10/06/2020. Belgium and Denmark not surveyed prior to 2020. in Italy, 2020 data from telephone surveys;
prior data from face-to-face surveys. Those who did not answer are not shown. “Unfavorable Views of China Reach Historic Highs In Many Countries”
                                                                                                                                                       Private and confidential      |   18
2021 Investment Themes

   •   Private assets

   •   Real assets

   •   Credit strategies and credit allocation in lower-risk portfolios

   •   Internationalization of portfolios

   •   Cyclical equity sectors

   •   Dollar strength/weakness

                                                                          Private and confidential   |   19
Growing Our Impact

Mary Quilici Aumack
CHIEF EXECUTIVE OFFICER
Types of Funds

      Institutional and Purpose-         Family Philanthropy Funds
      Specific Endowments
         o Parishes, schools, agencies      o Donor Advised Funds
         o Outreach, vocations, etc.        o Family Endowments & Funds
We GROW Impact

                 Investments                                           Connections/Funds                                                 Grant Making

Image Credits: investment by Creative Stall from the Noun Project; investment by IconPai from the Noun Project; connection by Edwin PM from the Noun Project
Impact of our Investments

                o Not just screening out the “bad stuff”

                o Investing in change

                o Participating in a change making investment
                  community

                o Providing tangible benefit to donors
o Connecting donors to
  effective programs

o New funds for
  institutions and
  purposes

o Collaboration between
  grantmakers

                          Impact of our Connections
Our Ultimate Impact – Grant Making

  Response in Times of Great Need   Strengthening Services
Thank you for Joining Us!
Questions? Want a copy of today’s slides?

Visit www.catholiccf.org/2021-investment-briefing
You can also read