Flying out of the Thunderstorm - SAA Presentation Standing Committee on Appropriations - Parliamentary Monitoring Group
←
→
Page content transcription
If your browser does not render page correctly, please read the page content below

Flying out of the Thunderstorm

SAA Presentation
Standing Committee on Appropriations
21 November 2018
                          1    CONFIDENTIAL – FOR DISCUSSION
Agenda

         1. SAA Corporate Plan FY 2019-23

         2. Strategy Implementation Monitoring

         3. Half Year Performance Results

         4. Key Risks

                                                 2   CONFIDENTIAL – FOR DISCUSSION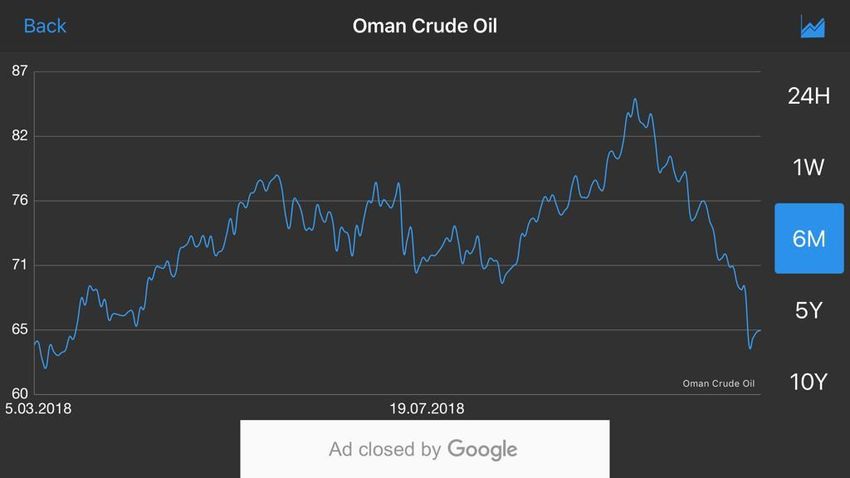
2

1. SAA Corporate Plan FY
        2019-23
Summary – FY2019/23 Corporate Plan (Approved Corporate Plan)

SAA developed its Long Term Turnaround Strategy (LTTS) in 2013, which has been met with limited success due to a failure to
implement
-   SAA validated the LTTS Plan in 2017 and highlighted significant gaps, such as oil price projected not higher than $45 a barrel till 2022

SAA has since revised its strategy and turnaround plan to build a commercially focused airline with customer experience as its
cornerstone

Approved FY2019/23 Corporate Plan forecasts breakeven by FY2021 based on key assumptions holding true
- The group will incur financial losses of R5.2 billion and R1.9 billion for the financial years 2018/19 and 2019/20, respectively.
- Thereafter the group expects to be profitable for the remainder of the five-year period

The SAA Corporate Plan is exposed to significant environmental and execution risk, driven by lack of critical skills, weak
balance sheet, liquidity challenges and escalating oil prices among others
- As a result SAA reported a net loss of R5.7 billion for 2017/18
- However, YTD performance has been strong, as reflected in the financial results which have been above budget both for
    revenue and net loss

                                                                               4             CONFIDENTIAL – FOR DISCUSSION
SAA has since revised its strategy and turnaround plan to build a commercially focused airline
with customer experience as its cornerstone

            Customer Experience    Win the battle for      Focused Player in      Player of substance            Commercially Focused
                Leadership         domestic market           International        in Regional Market                Organisation
                                                                Market

                                                           Enabled by

             Efficient Operating    Deep Aviation Skills    Fit For the Future        Enabling Policy                Appropriate
                   Platform               Base              Operating Model            Environment                  Balance Sheet

                                                                   5             CONFIDENTIAL – FOR DISCUSSION
Approved Corporate Plan forecasts break-even by FY2021 based on key assumptions holding true
                                                                                     1. Exogenous factors such as oil price and exchange rate
                                                  Key assumption underpinning        2. Competitive environment remains stable
                                                  the strategy                       3. Access to the requisite funding and appropriate capital structure
                                                                                     4. Securing relevant resources to implement the strategy
          SAA Group Net Profit/Loss

         2
                                              Actual                                                          Forecast
         1
                                                                                                                                              1 459
                                                                                                                         954          1 012
          -
                                                       (1 578)
        (1)                                                                                         (1 924)
                (2 640)
        (2)
ZARbn

                                                                 (5 561)   (5 447)       (5 170)
        (3)                    (5 735)

        (4)

        (5)

        (6)

        (7)
                FY14           FY15                    FY16      FY17      FY18          FY19       FY20             FY21             FY22    FY23
                                                                             SAA Group

                          Source: Management reports

                                                                                                6          CONFIDENTIAL – FOR DISCUSSION
Approved Corporate Plan indicates that break-even is achievable in 2021 with a Brent price of $75/bbl
SAA Group Net Profit Sensitivity for Fuel
6 000
4 000 USD45/bbl*
USD55/bbl
2 000
USD65/bbl (base case)
- USD75/bbl
USD85/bbl
ZARm
(2 000)
(4 000)
(6 000)
(8 000)
FY18 FY19 FY20 FY21 FY22 FY23
$1/bbl Brent change translates into c.R110m in fuel cost to the Group
* Gradual increase of $4 over the period taken into consideration across all scenarios
7 CONFIDENTIAL – FOR DISCUSSIONA new commercially focused operating model design underpins the transformation programme
The Company went out on an RFQ for a service Provider to assist with the Organisation Design programme
8 CONFIDENTIAL – FOR DISCUSSIONPotential risks to strategy implementation (1/2)
Potential risk (identified as potential events or Potential impact Mitigation
actions that might increase risk if they were to
occur)
SAA not able to get credit line for working SAA won’t be able to pay suppliers, creditors and Loan Refinance
capital funding employees Repatriate Angola & Zimbabwe funds
Engage the banks on new strategy
Engage National Treasury for capitalisation
Significant increase in oil price SAA cost to operate will increase significantly and Ideally hedge some of the negative position on Fuel
performance covenants could be missed triggering default Pass through the fuel price increase to the customers
conditions leading to banks calling their loans
The shareholder shifting focus from building a SAA would remain unprofitable and ultimately closes Agree on funding of the developmental mandate
financially sustainable airline to developmental unless such mandates are backed by financial injection
airline without requisite funding
Lack of agreement on the change programme Strike action would disrupt business performance leading Management – union bilateral sessions
leading to labour unrest to penalties and missed revenue with debilitating effect Labour Forum to be part of change programme
on SAA Management – union bilateral sessions
Labour Forum to be part of change programme
Lack of management capacity to execute on the Management lacking capacity and capability to execute on Recruiting top skills to support change agenda
strategy the strategy.
International flights bypass JNB Hub JNB hub strategy would be severely undermined and Strengthen government relations team, strengthen aviation
compromised with the effect of SAA’s domestic and policy teams
international market share would shrink.
9 CONFIDENTIAL – FOR DISCUSSIONPotential risks to strategy implementation(2/2)
Potential risk (identified as potential Potential impact Mitigation
events or actions that might increase risk
if they were to occur)
Failure to refinance SAA’s long-term loans SAA loans would fall due and payable Secure loan extension on the back of strategy
Shareholder to recapitalise SAA
Increased market competition on regional Reduce SAA market share to a point in which SAA Tighten cost to operate to create headroom to compete
and international markets loses market relevance Enter into value creating partnerships
Financial uncertainty making it impossible SAA would resort to leasing aircraft from lessors Secure loan extension on the back of strategy
for SAA to execute its fleet strategy at significant rates compared to buying own Shareholder to recapitalise SAA
aircraft.
SAA would carry higher cost to operate than its
peers thus leaving very little room to compete
and win.
Bureaucratic Supply Chain management Sourcing of key capabilities takes longer thus Review SCM policy
policy undermining the delivery timelines of the Revamp practices and bring innovation
strategy Simplify the key processes
Slow decision making at Board and Board and Shareholder withholding key decisions Simplify processes
Shareholder level resulting in missed revenue and cost savings Build trust through competence and character
benefit realisation. Negotiate a pro-turnaround DOA and SMF
10 CONFIDENTIAL – FOR DISCUSSION3
2. Strategy Implementation
MonitoringThe Long Term Turnaround Strategy leverages a structured approach consisting of 4 phases; initial
phase focuses on addressing immediate remedial actions, ultimately followed by growth
In Progress Maximise Shareholder
+ve Value
Exercise Internal and External Grow
Q1/2 Q3/4 Options
1. Guardians of the African
Optimise Revenue and
Stabilise Experience
Customer Service
Shareholder Value
2. Network Growth
Take control, reduce costs and 1. Market & Customer focussed 3. Revenue Growth
Change Strategy
deliver service
1. Revenue Management 2. Fleet alignment
2. Cost Management 3. SAAT / Air Chefs / Cargo
Arrest 3. Brand / Marketing 4. Voyager
4. Profit Centres 5. Mango
5. Digital 6. Alliances / Code shares
1. Cost/contract management 6. Recover Market share 7. Strategic partners
Before
Today
2. Focus on core activities
3. Network & Route Profitability
1. Sustained Losses
4. Customer Engagement
2. De-motivated Workforce
-ve 5. Management and organisation
3. Lack of decision making
Accountability
4. Lack of implementation
Source: SAA Board Strategy pack 20180117v15
12 CONFIDENTIAL – FOR DISCUSSIONThe initial phase is focused on four major areas of intervention
Revenue SAAT
Stimulation Supply Chain Business
Organisational
Network Transformation Process
Design
Optimisation Transformation
1. Route Optimisation 1. Ratios Driven 1. Review policy 1. Shift work for Labour
2. Network Development Headcount 2. No-Sacrifice BBBEE 2. Logistics review
3. Aircraft Utilisation Rationalisation strategy 3. Business process
2. OD Spans and layers 3. Aggressive SCM strategy 4. Aircraft Repair Turnaround
to drive costs down.
Broader Transformation program
13 CONFIDENTIAL – FOR DISCUSSIONLTTS: Progress to date
Achievements Next steps
1. Route optimisation initiatives implemented with domestic capacity reduced to 1. Increased aircraft utilisation under review for implementation will lead to additional
focus on profitable routes and Full Service Carrier (FSC) market. 3 of 4 domestic capacity and opportunity for increase in Charters.
Revenue routes profitable at route level 2. Alternate routes under review to optimise asset use. West Africa and North America
Stimulation and 2. London frequency reduced leading to C4 profit in Q2 for first time in a decade present attractive opportunities
Network
3. Central Africa route ceased to arrest losses 3. Mediation plan for the loss making Hong Kong route
Optimisation
4. 4 narrow body aircraft moved to Mango to address growing Low Cost Carrier (LCC) 4. Current Fleet review concluded and leases re-negotiated
market with positive overall results. Exited 5 wide-body aircraft
1. New Procurement Policy implemented to ensure tighter control of company spend. 1. Full contract review completed and established a contract database to highlight
spend categories
Supply Chain 2. Supply Chain organisation cleaned up with number of suspensions
2. Cross functional teams established to focus on cost reduction and revenue leakages.
Transformation 3. Total cost savings to date through specific procurement interventions R400m of
R1.6bn target. Key categories: energy, passenger revenue cost, MRO cost and aircraft 3. Revenue leakage and cost containment centre of excellence
leases
1. 294 excess Cabin Crew: VSP’s, early retirements and sabbaticals options offered (total 1. Definition of new operating model completed
71 exits). Section 189 process started on 1 November to address remaining. 2. OD process kicked off and final project plan being drafted
Organisational 2. 122 excess Flight Deck Crew: Pilots released on contract, took early retirement and 3. Engagement with Labor Workgroups ongoing
Design sabbaticals.
3. Section 189 process has been concluded at subsidiary Airchefs
SAA Technical Business Transformation
• SAA T turn–around times to return aircraft • SAAT transformation plan has been co-developed with Airbus • Further wide-body maintenance outsource to make room for narrow-body
to operation remains one of our biggest • Four A340-300’s outsourced abroad for heavy checks and nine capacity
internal challenge and threat to achieving (9) more are being for maintenance outsourcing • Assessment of introducing shift work to open up capacity
our performance objectives • Procurement issues addressed: Empty bins reduced • Various key positions in logistics, engineering and others being filled
• SAAT is constrained by serious
organisational and operational challenges
and inefficiencies
14 CONFIDENTIAL – FOR DISCUSSIONOVERALL NETWORK Improvements
Total - SAA Routes
Oct Nov Dec Jan Feb Mar Apr May Jun Jul Aug Sep Oct Nov Dec Jan Feb Mar Apr May Jun Jul Aug Sep
C4-103 +196 RASK 109
-32 98 102 103
-73 +63 96 92 97
-16 89 87 88 89 85
154
41 23
77 79 33
Trending below
-34 -38
-181
-122 -129
+33 -171
last year
-180 +59 -20 +153
+156 4% 5% 7% 6% 8% 2% 5% 6% 21% 10% 17% 17%
C4 MARGIN 9% CASK
4% 9% 15% 11% 4% 0% -9% 4% 9% 11% 12% 13% 18% Trending above
-2% -2% 4% last year
2% 1% 2%
-7%
-8% -80
-9%
-11% -95 -95 -94 -91 -94
-101 -97 -99 -98 -99
-108
LF% 78% 78% ASK - Available Seat
76% 76%
69%
75% 2 261
Kilometers (ASK) and
72% 72% 73% 71%
Passenger numbers
68% 2 066 2 142 2 034
65% 1 994
1 807 1 857 1 782 1 850 1 857 1 794
1 725
(PAX) reduced by 20%
and 26% respectively
-3% -2% -2% -2% -3% -3% -8% -6% 1% -1% 5% 3% -5% -11% -11% -15% -16% -16% -19% -22% -21% -20% -20% -19%
AVG Fare 4 888 PAX - Hence Cost per ASK
4 727 4 732 4 621
3 744 3 804 3 906 4 036 4 182 4 160 4 252 4 209 (CASK) has oncreased
(worsened) from last
581 935
537 412
500 831
449 251
376 761
420 028 389 227
359 409 352 365
398 447 415 278 401 699 year
6% 7% 10% 10% 25% 22% 29% 28% 38% 30% 31% 34% -7% -12% -13% -18% -28% -29% -34% -35% -31% -32% -28% -29%
Source: RCE
Focus going forward is to reduce CASK, whilst continuing to improve RASK
Source: Management reports
15 CONFIDENTIAL – FOR DISCUSSIONROUTE PERFORMANCE (by market)
Positive signs of turnaround in the Domestic market -3 of the 4 routes yielding profitability at route level
Strong performance in Regions - Despite reduction in capacity relative to budget, strong performance at C4 level
Extremely tough environment in International market - Competition and high fuel costs are major challenges
Domestic Regional International
Total income R1.9 billion R3.3 billion R5.9 billion
Operating profit (C4) R133 million R570 million (R649 million)
Other costs (R421 million) (R417 million) (R734 million)
Net profit (C5) (R288 million) R153 million (R1.4 billion)
16 CONFIDENTIAL – FOR DISCUSSIONROUTE PERFORMANCE at C4 level
Trending below
last year
Trending above
last year
*See UK monthly performance
below
Source: Management reports
17 CONFIDENTIAL – FOR DISCUSSIONROUTE PERFORMANCE at C4 level
1. London Heathrow route optimisation has
resulted in positive GP at route level
for the first time in 10 years
2. International routes have suffered from:
• High crude oil prices
• Increased competition, and
• Negative publicity relating to SAA
Source: Management reports
18 CONFIDENTIAL – FOR DISCUSSIONCapacity shift to Mango has resulted in a reduction in total domestic pax of 11% YTD but in a contribution
improvement in domestic operations of R186m from -R143m to +R43m
Change in Domestic Passengers Change in Domestic Contribution
H1 FY19 vs H1 FY18 H1 FY19 vs H1 FY18 SAA Domestic Mango
3 500 -11% 400
3 000 300
(774)
2 500 453 200
1501 309
Pax (000’s)
+R43m
2 000 100
ZARm
1954 85 81
1 500 0 (38)
2256 2256 (123)
1 000 -100 (228)
1529
500 -200
755
-R143m
0 -300
H1 FY18 SAA Mango H1 FY19 H1 FY18 SAA Mango H1 FY19
Capacity Capacity Capacity Capacity
Change Change Change Change
While overall domestic passengers have declined by 11% between H1 FY19 and H1 FY18, there has been a
marked improvement in contribution as a result of the shift from –R143m to +R43m
Note: Mango contribution assumed as EBIT – Other costs
19 CONFIDENTIAL – FOR DISCUSSION3. Half Year Performance
Results
20 CONFIDENTIAL – FOR DISCUSSIONBusiness performance against Corporate Plan – September 2018
Quarter 2 delivered strong network Operating cost 2% ahead of plan
performance for SAA Airline
Revenue passengers 4% ahead of plan due to Cost average seat kilometer is 5% lower than plan
network changes; as result of forex;
Revenue average seat kilometer 6% ahead of plan Energy cost is 12% more that plan due to oil
due to price increases; prices;
Average load factor 1% ahead of plan; Labour cost 3% below plan – only filling critical
Average seat kilometer -3%; and vacancies; and
Average fares 10% ahead of plan. Aircraft maintenance cost is 30% lower than plan
due to lower activity and challenges at SAAT.
21SAA current performance September 2018
R’mil Budget Actual Var
Revenues 12 392 13 589 5%
Operating cost 15 405 15 136 2%
Operating loss (2 903) (1 738) 40%
Free cash available ( 31 October) 456
Add: Restricted funds ( 31 October) 1 808
Less: Short term overdraft facilities used (275)
Cash and cash equivalents ( 31 October) 1 989
22Immediate impact and consequences of news about SAA future
Defaulting on any one loan to SAA
would trigger legal terms for
Low staff morale
immediate repayment on the rest of
its debt.
Not an employer of choice – can’t Creditors want to reduce payment
attract the required skills terms, guarantees and prepayments
Organisation loses it’s power to Pressure place on our already
negotiated better terms stressed cash flows
Doing business with SAA becomes Banks don’t want to finance SAA
high risk
234
4. Key risks to Corporate
PlanA number of significant risks underline the Corporate Plan
SAA Technical Organisation Design
Funding and liquidity Supply Chain
Oil price volatility organizational and (OD), skills and
constraints
operational issues capacity
25 CONFIDENTIAL – FOR DISCUSSION1. Uncertainty about SAA’s future exacerbates its liquidity challenges…
Supplier payment terms have adverse impact on
Cash Flows.
Threats of Business Rescue prompts
60 Prepayment leading to
negative impact on SAA
IATA to compel SAA to pay upfront
deposit as part of the BSP system thus
impacting Cashflow negatively
Days cash flows
1. Travel agents stop forward bookings on SAA due to
material uncertainty about its future. Lenders are reluctant to provide credit
2. Forward bookings are made 6 to 9 months ahead of lines to SAA due to material uncertainty
the date of travel. about SAA’s future
3. This materially undermines the business plan
26 CONFIDENTIAL – FOR DISCUSSION2. Oil price remains one of the major risks to the turn around plan
Six Month Oil Price
Movement
SAA Budgeted Oil Price
$69 Per Barrel SAA Fuel Recovery Profile Fuel expenditure profile
SAA fuel hedged position 9%
4.5% Oil price cover of exposure
4.0% Forex cover of exposure 100% 100% 20%
45%
Materiality of Fuel in SAA cost base 71%
Domestic Regional International
24% of Total Expenditure
27% of Total Revenue Domestic Regional International3. Systemic performance challenges at SAAT have led to major bottleneck resulting in deteriorating financial
performance
Inefficiencies negatively impact SAA profitability Loss of third party business will results in
overdependence on SAA
1. Aircraft Maintenance costs makeup to 21% of SAA’s total 1. 15% of SAAT revenues come from 3rd Party business.
expenditure
2. Due to history of underperformance, SAAT is beginning to
2. SAAT charges SAA 25% more than global benchmarks lose clients that threatening its long-term sustainability.
(IATA Data) to repair aircraft.
Poor delivery impacts SAAT & SAA profitability Poor performance is opening up opportunities for
competitors to take spaces adjacent to SAAT
1. The approved corporate plan 2019-2023 assumes a 1. Lufthansa Technic (LHT) has started local line
SAAT which is at breakeven performance. maintenance operations in South Africa.
2. Unforeseen bottlenecks in aircraft maintenance impact 2. If LHT is successful and SAAT fails to transform itself on
revenue performance thus presenting material risks to urgent basis, the MRO may struggle to survive.
SAA’s overall turnaround plan.
28 CONFIDENTIAL – FOR DISCUSSION4. Organisation Design (OD), skills and capacity
Organisational Design Implications
• Labour costs 9% of total expenditure • Lack of implementation and delays
• Corporate Plan projects labour cost savings • Constrained implementation delivery capacity
of R1.6bn to 2023
• Delays in implementing the LTTS plan
• SAA has been successful in dealing with
immediate excess flight deck and cabin
• SAA needs:
crew (~R400M annualized savings)
• To embark on a wider re-organisation exercise to develop
• SAA lacks skills and capacity in a number of
the optimal structure and operating model and reduce
critical areas
headcount
• SAA is not able to attract top talent locally
• To contract skills from reputable firms
• Some key EXCO roles have been filled but
• Short-term assignments from highly skilled individuals e.g.
critical capacity constraints remain
retired personnel
29 CONFIDENTIAL – FOR DISCUSSION5. Supply Chain Management constraints
SAA procures goods, services and works to the value Grant SAA exemptions to some of the PFMA provisions
of R25 billion per annum and Treasury Instruction notes
1. Ensure that the turnaround timelines are achieved
2. Rapidly reduce the cash burn and improve Cash-flow
positions
R2.8 billion savings target within 3 years 3. Focus management efforts on the major cultural issues
impacting the airline’s service and competitiveness.
Threat to the savings Breakeven point
Unless special SCM exemptions and concessions
are granted it will be difficult to deliver benefits on
Tender process: 6 time for the 2021 break even point.
months
Transition period : 12 -18
months FY21 FY22
• Most savings realisable within a time frame
of 18 – 24 months
• Significant risk on the potential savings if
the above timelines are missed
30 CONFIDENTIAL – FOR DISCUSSIONEnd 31 CONFIDENTIAL – FOR DISCUSSION
You can also read