THE WEEKLY UPDATE 2020 SUMMARY - Squarespace
←
→
Page content transcription
If your browser does not render page correctly, please read the page content below

THE WEEKLY UPDATE
    2020 SUMMARY    Want to sponsor our weekly report?
                               Click here
Click here to sign up
                                                                                                                                                                            to our weekly report

The year of the institutions
In 2020, bitcoin finally got the attention of institutional investors. The broad financial markets have been volatile amid the COVID-pandemic, but the central banks have
intervened pushing monetary stimulus and governments have launched large fiscal stimulus packages. The backdrop of the intervention has been a sharp increase in
M2 (+25%) and looming fears of inflation. This in turn brought institutional attention to Bitcoin, due to its store of value properties.

The increased institutional presence is clear. Both in terms of esteemed investors publicly commenting on bitcoin allocations to hedge against inflation, but also in
terms of market data, most notably the rise of CME’s Bitcoin futures. As of December 29th, CME is now the largest contributor to the open interest in the BTC futures
market.

However, 2020 has been volatile including for bitcoin. The broad financial market crash had a heavy impact on bitcoin in March, as bitcoin fell 50% over the span of two
days during one of the heaviest sell-offs ever seen in bitcoin. The sell-off was followed by a sustained period of unusually high correlation with the stock markets, but
at last, the correlation returned to normal levels, bitcoin decoupled and started its path towards and beyond its former ATH.

                                                                  BTC vs Nasdaq & S&P 500 (YTD)
                     300%
                                                                                                                                                                    274%
                     250%

                     200%
 Percentage change

                     150%

                     100%

                     50%                                                                                                                                            46%

                                                                                                                                                                    15%
                      0%

                     -50%                                                                                                      BTC          Nasdaq      S&P 500
                        Jan 20   Feb 20   Mar 20   Apr 20   May 20      Jun 20      Jul 20       Aug 20       Sep 20      Oct 20       Nov 20    Dec 20
Institutional investors have been making headlines this year
               Gradually, then suddenly
                                                                                                                                     Gradually
                                                           May 7th:
                                         Paul Tudor Jones allocates 1-2% of his fund to
                                                     CME's bitcoin futures

                                                                            “I also made the case for owning Bitcoin, the quintessence of
                                                                            scarcity premium. It is literally the only large tradeable asset
                           March 30th:                                     in the world that has a known fixed maximum supply.[…] This                                                                           September 15th:
                     RenTech’s Medallion Fund                                brilliant feature of Bitcoin was designed by the anonymous                                                             MicroStrategy buys $175m more in bitcoin.
                       permitted to invest in                                    creator of Bitcoin to protect its integrity by making it                                                              Upping its BTC holdings to $425m.
                      CME's cash-settled BTC                                  increasingly near and dear, a concept alien to the current                              August 11th:
                              futures                                                thinking of central banks and governments.”                     MicroStrategy adopts bitcoin as its primary
                                                                                                  - Paul Tudor Jones                                 reserve asset and buys $250m worth of BTC
                                                                                                                                                                     (21,454 BTC)

               Apr                                 May                                        Jun                                          Jul            Aug                                       Sep                                    Oct

                                                                                                                                                                          August 14th:
                          April 12th:                                                                                                                         Ex-prudential CEO George Ball says
                Wyoming passes law to allow                                                                                                                    “Bitcoin or other cryptocurrencies
                domestic insurance companies                                                                                                                   could become a sought after safe-
                  to invest in digital assets                                                                                                                             haven asset.”

Dec 29, 2020                                                                                                                                     3
Then suddenly
November 30th:
AllianceBernstein ($631b AUM) -
Bernstein Research recommends that
November 18 : th bitcoin can comprise from 1.5% to 10%
Ricardo Salinas (Mexico's second- of portfolios
December 10th:
richest man) announces that he's
MicroStrategy offers $550 million
allocated 10% of his liquid net worth
worth of five-year senior
to bitcoin
convertible unsecured notes to
November 7th:
investors and plans to use the
Bill Miller, Miller Value Partners: November 16th: offering’s proceeds to buy more
"I think every major bank, every major Scaramuccis SkyBridge
October 13th: Bitcoin.
investment bank, every major high net ($9.2b AUM) may seek November 24th:
Stone Ridge Holdings announced that it has
worth firm is going to eventually have some exposure to digital assets Pendal Group ($73.6b AUM) December 21st:
purchased more than 10,000 BTC as part of its
exposure to bitcoin or what's like it, which is starts investing in bitcoin December 4th: MicroStrategy purchases an
strategy of making bitcoin its primary treasury futures MicroStrategy buys additional
gold or some kind of commodities” additional 29,646 BTC for $650m
reserve asset $50m in bitcoin at an average price of $21,925 per BTC
Oct Nov Dec
November 20th: December 10th:
October 8th: November 9th:
BlackRock CIO of Fixed Income Rick Rieder: MassMutual purchases
Square invests $50 million in Stan Druckenmiller invests in bitcoin: $100m worth of bitcoin
Bitcoin. Purchases 4709 BTC. "Do I think it's a durable mechanism that ...
"Bitcoin is better than gold" December 2nd:
could take the place of gold to a large extent?
BlackRock CEO Larry Fink:
Yeah, I do, because it's so much more December 15th:
“Bitcoin can possibly ‘evolve’
functional than passing a bar of gold Ruffer Investment Management
October 21st: into a global market asset”
around," confirms a bitcoin exposure of
PayPal announces that they will allow customers to around $740 million, around 2.7%
hold bitcoin and other virtual coins in its online of the firm's assets under
wallet and shop using cryptocurrencies at the 26 November 29th:
management.
million merchants on its network. Guggenheim's Macro Opportunities Fund
($5.3b AUM) reserves the right to put up
to 10% in Bitcoin Trust
Dec 29, 2020 4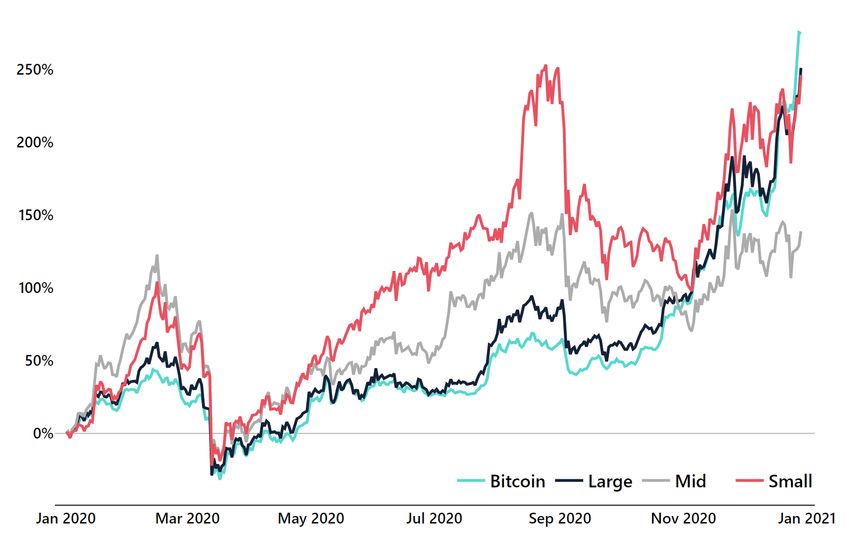
Bitcoin crushed the stock markets this year
                                                                                                       BTC vs. Nasdaq & S&P 500 (YTD)

                                                                                                                                        269%
               Without a doubt a volatile year across all
               financial markets, but bitcoin ends up as the big
               winner of 2020.

               ▪   After a rough start to the year with the
                   massive sell-off in March, bitcoin struggled
                   with outperforming the stock market.

               ▪   However, after some impressive months
                   ahead of the halving in May, bitcoin never
                   looked back.

               ▪   It’s been a great year in the stock market as
                   well, with Nasdaq gaining over 45%. But with
                   bitcoin’s recent bull run, these gains look
                   insignificant compared to bitcoin’s increase of
                   269%.
                                                                                                                                        45%

                                                                                                                                        15%

           2021 prediction: Bitcoin’s gains will make
           the stock market look insignificant next
           year too

                                                                     Source: Digital Assets Data

Dec 29, 2020                                                                                       5
Ether (ETH) the winner of 2020
With the publicity and hype around bitcoin this year, it is easy to forget the rest of the crypto market. Ether (ETH) has quietly outperformed bitcoin, gaining almost 450% in
2020. XRP has experienced terrible volatility lately with the SEC charges against Ripple, leaving late investors with big losses. XRP is about the erase all gains of 2020.
Top 3: Percentage Change in Price (YTD) 448% $711.3
269% $26,522
19% $0.227
Source: Digital Assets Data
2021 prediction: ETH will reach a new ATH next year and XRP will drop out of the top 10.
Dec 29, 2020 6A great year in the crypto market
YTD Performance of Market Capitalization Weighted Indexes
269%
251%
246%
It’s been a great year for most
cryptocurrency investors. A bumpy ride,
but strong hands have been rewarded.
However, a fairly disappointing second
half of 2020 for many altcoins, as both 139%
Mid Caps and Small Caps are ending the
year lower than the peak of this
summer.
2021 prediction: Small Caps will
be the winner of 2021
Source: Digital Assets Data, Bletchleyindexes.com (Dec 28)
Dec 29, 2020 7Market sentiment ends 2020 at historical highs
A year full of emotions. From extreme fear in March to extreme greed in December. The current market sentiment at historically high levels screams “sell”, but the last month has shown that
these kinds of metrics can’t be used as trading signals alone. Since the Fear and Greed Index touched 90 on Nov 6 th and signaled an overly confident market, BTC has gained almost 70%. This
metric has worked better in signaling bottoms than tops historically.
Fear & Greed Index
2021 prediction: The Extreme Greed
Index will give investors
92
some great “buy the dip”
opportunities next year.
Extreme Fear
Source: Alternative.me, Digital Assets Data (Dec 28)
Dec 29, 2020 8Bitcoin volume has increased more than 1,000% this year
The 7-day average real bitcoin volume* is about to end 2020 around $5 billion, which is
more than 1000% higher than where the year started. Retail traders are certainly back
in the market after bitcoin pushed towards its ATH from December 2017.
6,000 Real BTC Daily Volume (7-day average)
5,000
Trading Volume ($ million)
4,000
3,000
2,000
1,000
0
Jan 20 Feb 20 Mar 20 Apr 20 May 20 Jun 20 Jul 20 Aug 20 Sep 20 Oct 20 Nov 20 Dec 20
Source: Messari, Skew (Dec 28) *as defined by Arcane Research. Read more here.
Dec 29, 2020 9THE FUTURES MARKET
A growing futures market
           2020 has been eventful in the BTC futures market, to put it mildly. The year started with a total open interest of $2.65b, and will end the year with around $9b in open
           interest. For a while, the open interest steadily fluctuated between $3 billion and $5 billion, but as bitcoin’s rally up and towards its former ATH started in October, the open
           interest has reached levels never before seen.

                                                                                                        BTC futures market: Open interest

                                                                                                                                                                                                       December 28th: OI: $9.4b
    $10b
                                                     Black Thursday - March 12-13th: OI: $1.8b
     $9b
                                                  Bitcoin price falls from $7900 to $4350. A cascade
                                                  of liquidations on BitMEX sees $897m worth of
     $8b                                          bitcoin positions getting liquidated in one day.
                                                  49.5% decline in OI from Mar 11th to Mar 13th.
     $7b

                      January 1st: OI: $2.65b
     $6b                                                                                                                                                             October 1st: OI: $3.6b

     $5b
                                                                                                                      July 1st: OI: $3.4b

     $4b

     $3b

     $2b

     $1b

     $0b
       Jan 20                  Feb 20           Mar 20                Apr 20                May 20       Jun 20          Jul 20             Aug 20     Sep 20             Oct 20              Nov 20      Dec 20
       Source: Skew
                                                                                   2021 prediction: Cash-settled futures will dominate the futures market in 2021.

Dec 29, 2020                                                                                                                11
BitMEX has abdicated while the regulated futures market has grown
This year has seen great developments in the bitcoin futures market. BitMEX has lost its reign as the leading platform in the market following the liquidation loop of March,
with the final nail in the coffin being the CFTC charge in October. Meanwhile, Binance and CME have seen substantial growth throughout the year. Lurking in the shadows
below are platforms such as Bybit, Deribit, and FTX, also seeing noteworthy growth within their niches.
Bitcoin Futures Market: Distribution of Open Interest
40% October 1st:
Black Thursday - March 12-13th
CFTC charges BitMEX owners with
illegally operating a cryptocurrency
35% derivatives trading platform and
anti-money laundering violations
30%
25%
20%
CME: 17.64%
OKEx: 17.05%
15%
Binance: 15.39%
10%
BitMEX: 8.17%
5%
0%
Jan 20 Feb 20 Mar 20 Apr 20 May 20 Jun 20 Jul 20 Aug 20 Sep 20 Oct 20 Nov 20 Dec 20
Source: Skew
2021 prediction: A further growth of the regulated BTC futures (CME), accompanied by more regulatory scrutiny of
unregulated exchanges. This will eventually lead to the acceptance of a bitcoin ETF by the SEC.
Dec 29, 2020 12INSTITUTIONAL DEMAND
Grayscale has absorbed 1.5% of the circulating BTC supply this year

                                                                                                                            Bitcoin held in the Grayscale Bitcoin Trust*
                                                                        650,000

                                                                                                                                                                                        600k BTC
                                                                        600,000

                                                                        550,000

           Grayscale’s Bitcoin Trust is a good proxy of the increased   500,000
           institutional demand for bitcoin, as accredited investors
           are the only ones that are allowed to buy into the trusts    450,000
           in the primary market. The company is currently
           absorbing more BTC than what’s being issued and has
           more than doubled their BTC holdings this year.              400,000

                                                                        350,000

                                                                        300,000
                                                                                  261k BTC
                                                                        250,000
          2021 prediction: Grayscale will hold 1 million BTC by
          the end of next year.
                                                                        200,000
                                                                                    Jan          Feb         Mar            Apr     May      Jun      Jul     Aug     Sep   Oct   Nov     Dec

                                                                                   Source: Grayscale, Digital Assets Data

Dec 29, 2020                                                                                14
The year bitcoin went institutional
It is easy to see why 2020 will be remembered as the year of the institutional investors. CME is currently the largest BTC futures market in terms of open interest. Both the OI
and the daily volume climbed to new all-time highs this Christmas.
CME Bitcoin Futures
4000 2000
1800
3500
1600
3000
1400
2500
Open Interest ($)
Daily Volume ($)
1200
2000 1000
800
1500
600
1000
400
500
200
0 0
Jan 20 Feb 20 Mar 20 Apr 20 May 20 Jun 20 Jul 20 Aug 20 Sep 20 Oct 20 Nov 20 Dec 20
Source: Skew Open Interest ($) Volume ($)
2021 prediction: CME’s bitcoin futures will outpace all other BTC futures in 2021 and end the year as
the dominant market
Dec 29, 2020 15Increased activity at Bakkt this year
The fairly new Bakkt platform that launched last year has not been hit by the same institutional wave as the CME. It seems like these investors are more interested in trading
“paper” bitcoin, and not Bakkt’s physically-settled futures contracts. However, the activity on the platform has increased, with a clear trend shift in daily volume in August.
Bakkt Bitcoin Futures
300 30
250 25
200 20
Open Interest ($)
Daily Volume ($)
150 15
100 10
50 5
0 0
Jan 20 Feb 20 Mar 20 Apr 20 May 20 Jun 20 Jul 20 Aug 20 Sep 20 Oct 20 Nov 20 Dec 20
Source: Skew Open Interest Volume
2021 prediction: Institutional investors will seek the most liquid market and Bakkt’s market share will stay low as institutional
investors prioritize CME.
Dec 29, 2020 16BLOCKCHAIN ACTIVITY
The halving and the hashrate that persisted
          Bitcoin went through its third halving this year, as the block
          subsidy fell from 12.5 BTC to 6.25 BTC per block on May
          11th.
                                                                                                                                                     Bitcoin Circulating Supply vs Hashrate
          ▪ As the miner rewards halved, many feared the impact of a                                      18.7m                                                                                                                  180
            potential decline in hashrate, leading to slow block                                                                      Pre halving                                            Post halving
            generation, and reduced overall security on the bitcoin                                                                                                                                                              160
            blockchain.                                                                                   18.6m

          ▪ We did in fact see a short decline in bitcoin’s hashrate, leading                                                                                                                                                    140
            to a 6% decline in mining difficulty. However, the hashrate                                   18.5m
            quickly returned to – and surpassed – its former highs                                                                                                                                                               120

                                                                                BTC: Circulating Supply
            throughout the summer.

                                                                                                                                                                                                                                       Hashrate Eh/S
                                                                                                          18.4m                                                                                                                  100
          ▪ The mining industry is complex, but miners will mine as long
            as it’s deemed profitable. The initial rebound of the hashrate
            was likely driven by miners offloading their bitcoin holdings to                              18.3m                                                                                                                  80
            remain competitive in the mining scene, in addition to low
            energy costs due to a particularly rainy wet season in China.                                                                                                                                                        60
                                                                                                          18.2m
          ▪ The increasing value of BTC post halving has later contributed
            to offset the revenue impact of the halving.                                                                                                                                                                         40

                                                                                                           18.1m
          ▪ In addition, miners seem to have become more dependent on                                                                                                                                                            20
            fees, as the average fee contribution to the miner revenue has
            risen from 1.8% before the halving to 9.4% post halving.                                      18.0m                                                                                                                  0
                                                                                                               Jan 20         Feb 20 Mar 20    Apr 20 May 20    Jun 20   Jul 20     Aug 20     Sep 20   Oct 20   Nov 20 Dec 20

           2021 prediction: The hashrate will surpass 200 EH/S                                                                                                 Circulating Supply        EH/S
           in 2021.                                                                                       Source: Glassnode

Dec 29, 2020                                                                                                                     18
Rising transaction fees on Bitcoin and Ethereum
Average Transaction Fees
$16
Growing activity in Bitcoin and Ethereum has led the $14
transaction fees to rise substantially in 2020.
▪ The average transaction fee on Bitcoin have risen $12
substantially since the halving, and the fees have been
exaggerated further by the recent bull market in bitcoin.
$10
▪ The average transaction fee on Ethereum on the other hand
has fluctuated more and reached its highs amid the peak of $8
the DeFi craze of mid-September.
▪ With rising fees, small transactions become less attractive. $6
$4
$2
2021 prediction: Scaling debates will again be a
hot topic in bitcoin, leading to increased adoption of $0
the Lightning Network and other sidechain Jan 20 Feb 20 Mar 20 Apr 20 May 20 Jun 20 Jul 20 Aug 20 Sep 20 Oct 20 Nov 20 Dec 20
alternatives.
Source: Coinmetrics Bitcoin Ethereum
Dec 29, 2020 19Bitcoin deposits on exchanges in freefall
BTC on exchanges
The aggregated exchange balance has fallen throughout the 3.0m
year, and net more than 0.5 million BTC has been withdrawn
from the major exchanges.
2.9m
▪ It’s likely that a significant sum of the withdrawn BTC has been
moved to cold-storage wallets, evident by the increase of
10.5% in addresses holding more than 0.1 BTC. 2.8m
▪ However, it is also fair to assume that these bitcoins have
moved elsewhere to other custodians in the space. 2.7m
BTC on exchanges
▪ The most notable likely destination for the withdrawn BTC is
found on the Ethereum blockchain, as there currently are 2.6m
139,725 BTC on Ethereum with the Wrapped Bitcoin protocol
alone holding 113,235 BTC.
2.5m
▪ Another likely destination for BTC moved of exchanges are
centralized lending providers such as BlockFi, Genesis, and
Nexo – allowing holders of bitcoin to deposit funds and 2.4m
receive a yield while doing so.
2.3m
2021 prediction: The aggregated BTC exchange 2.2m
balance will rise as more holders seek to realize Jan 20 Feb 20 Mar 20 Apr 20 May 20 Jun 20 Jul 20 Aug 20 Sep 20 Oct 20 Nov 20 Dec 20
profits or to trade other cryptocurrencies. Source: Glassnode
Dec 29, 2020 202020 - The breakthrough year for DeFi
The DeFi sector saw a moderate adoption during the first half of the year, with lending protocols dominating the space. At the time, the total value locked in DeFi was
relatively stable, for the most part ranging between $700m and $1 billion. Then, on June 16 th, Compound launched its governance token. The interest in the sector then
exploded (quite literally), as yield farming attracted many new participants into the space.
▪ The total value locked in DeFi has risen from $670m to $14.5b in 2020, a growth of 2100%.
▪ By December, 1 million unique addresses were affiliated with DeFi, a 10x growth from January 1 st. Both lending protocols and decentralized exchanges (dexes) have seen particularly
strong growth this year, while the derivative protocols have seen a more moderate (albeit strong) growth.
2021 prediction: DeFi derivative protocols will see a more substantial growth, with stricter regulations on the centralized derivative market leading traders to alternative markets.
Total Value Locked in DeFi
1 - February 7th 2- March 17th 3 - June 16th 4 - September 13th 5 - December 29th
The TVL in DeFi surpasses $1 billion. The total value locked in DeFi TVL in DeFi is back at $1 billion. TVL surpasses $10 billion as yield TVL in DeFi reaches ATH at $14.5 billion.
reaches a yearly low of $531m in farming reaches new branches of
The growth in the sector is heavily the aftermath of the black Thursday Compound releases its governance the DeFi ecosystem. Dexes attracts The lending sector now accounts for 49% of
driven by lending platforms, accounting crash. token, igniting the growth in DeFi liquidity with the launch of the TVL while dexes account for 32%.
for 74% of the total TVL in DeFi. Maker as yield farming attracts more users SushiSwap leading the way, soon to 139 725 BTC has found its way into the
alone accounts for 57% of the TVL in into the ecosystem. be followed by the launch of UNI. Ethereum protocol to be used in DeFi.
DeFi. Dexes now contribute to 45% of the 5
$16b TVL in DeFi.
$14b
Total value locked in DeFi ($)
$12b 4
$10b
$8b
$6b
$4b 1 3
2
$2b
$0b
Jan 20 Feb 20 Mar 20 Apr 20 May 20 Jun 20 Jul 20 Aug 20 Sep 20 Oct 20 Nov 20 Dec 20
Source: DeFi Pulse
Dec 29, 2020 212021
Price path in 2021
          Will the history of the former halving cycles repeat itself?
        In May 2020, Bitcoin went through its third halving. The price action following
        the former halvings has been remarkably similar to the price action following
        this halving, and if history is anything to go by, we can do some simple back of                                                                   Bitcoin return: Third halving vs Second halving
        the envelope calculations to estimate the path onwards for bitcoin in 2021.
                                                                                                                                  3000%

        ▪ The first halving occurred on November 28th, 2012. Following the halving, the
          bitcoin price soared and reached its peak 366 days later with a return since
          halving of 9164%.                                                                                                       2500%

        ▪ The second halving occurred on July 9th, 2016. Bitcoin once again showed
          strength in the aftermath of the second halving, reaching its peak 525 days after
          the halving, with a return of 2862% since the halving.                                                                  2000%

                                                                                                           Return since halving
                ▪   This is approximately 1/3 of the peak return of bitcoin following the first halving.

        ▪ Currently, the bitcoin returns since halving are higher than those following the                                        1500%
          second halving. Suggesting that a peak might come earlier, rather than later, than
          the peak of the second halving in terms of days.

        ▪ Given the already large market cap of bitcoin, the peak return following the                                            1000%
          halving will likely be lower than the peak of the 2016 halving. But how much
          lower?
                                                                                                                                  500%

          2021 prediction: Assuming the maximum return peak follows the                                                                                                                                                Second Halving
          trajectory of the former halving (1/3 of the previous peak), the peak                                                                                                                                        Third Halving
                                                                                                                                       0%
          return could end up at around 900% since the day of halving – in                                                                  0   100   200    300   400   500   600    700     800    900   1000 1100 1200 1300 1400
          other words with a bitcoin price around $77,000.                                                                                                                      Days since halving
                                                                                                                           Source: Bitstamp, Tradingview

Dec 29, 2020                                                                                                                      23
Time in the market > timing the market
At least 50% of the bull market of 2017 was sideways. Bitcoin’s explosive moves to the upside normally happen over a short period of time, like we have seen these last
months of 2020. If 2021 will end up similar to 2017, there is one important rule to remember for long-term investors:
Time in the market is more important than timing the market
BTC Price 2017 (Daily Candles)
$16,000
$8,000
$4,000
$2,000
$1,000
$500
Jan 17 Feb 17 Mar 17 Apr 17 May 17 Jun 17 Jul 17 Aug 17 Sep 17 Oct 17 Nov 17 Dec 17
Source: Tradingview, Coinbase
2021 advice: HODL
Dec 29, 2020 24Are you looking for exclusive research or analysis?
Visit us at research.arcane.no
Dec 29, 2020 25Disclaimer
• The Weekly Update (the “Report”) by Arcane Research is a report focusing on cryptocurrencies, open blockchains and fintech. Information published in the Report aims to spread knowledge and summarise developments in
the cryptocurrency market.
• The information contained in this Report, and any information linked through the items contained herein, is for informational purposes only and is not intended to provide sufficient information to form the basis for an
investment decision nor the formation of an investment strategy.
• This Report shall not constitute and should not be construed as financial advice, a recommendation for entering into financial transactions/investments, or investment advice, or as a recommendation to engage in investment
transactions. You should seek additional information regarding the merits and risks of investing in any cryptocurrency or digital asset before deciding to purchase or sell any such instruments.
• Cryptocurrencies and digital assets are speculative and highly volatile, can become illiquid at any time, and are for investors with a high risk tolerance. Investors in digital assets could lose the entire value of their investment.
• Information contained within the Report is based on sources considered to be reliable, but is not guaranteed to be accurate or complete. Any opinions or estimates expressed herein reflect a judgment made as of the date of
publication and are subject to change without notice.
• The information contained in this Report may include or incorporate by reference forward-looking statements, which would include any statements that are not statements of historical fact. No representations or warranties
are made as to the accuracy of these forward-looking statements. Any data, charts or analysis herein should not be taken as an indication or guarantee of any future performance.
• Neither Arcane Research nor Arcane Crypto AS provides tax, legal, investment, or accounting advice and this report should not be considered as such. This Report is not intended to provide, and should not be relied on for,
tax, legal, investment or accounting advice. Tax laws and regulations are complex and subject to change. To understand the risks you are exposed to, we recommend that you perform your own analysis and seek advice from
an independent and approved financial advisor, accountant and lawyer before deciding to take action.
• Neither Arcane Research nor Arcane Crypto AS will have any liability whatsoever for any expenses, losses (both direct and indirect) or damages arising from, or in connection with, the use of information in this Report.
• The contents of this Report unless otherwise stated are the property of (and all copyright shall belong to) Arcane Research and Arcane Crypto AS. You are prohibited from duplicating, abbreviating, distributing, replicating or
circulating this Report or any part of it (including the text, any graphs, data or pictures contained within it) in any form without the prior written consent of Arcane Research or Arcane Crypto.
• By accessing this Report you confirm you understand and are bound by the terms above.
• Arcane Research is a department within Arcane Crypto AS, org. 994 608 673, and can be contacted at research@arcane.no or tbj@arcane.no
Dec 29, 2020 26Subscribe to The Weekly Update Contact: research@arcane.no
You can also read