JOBS KILL ZONE REPORT 2021 - Felim O'Rourke - ISME
←
→
Page content transcription
If your browser does not render page correctly, please read the page content below
JOBS KILL ZONE
REPORT 2021

Felim O’Rourke
Contents
Introduction and Bio: Felim O’Rourke ....................................... 2
Executive Summary .................................................................... 3
Low paid workers without dependents..................................... 4
Low paid workers with families ................................................. 9
Housing ..................................................................................... 13
Explaining the Policy Mismatches ........................................... 14
Recommendations ................................................................... 16
Appendix I: Social Housing Income Thresholds....................... 18
Appendix II: Mean Vs Median Income .................................... 20

                                               1
Introduction and Bio: Felim O’Rourke
There is compelling evidence that policymakers, senior civil servants, politicians and policy
advisors lack understanding of the situation of low-income workers and have allowed the
complex interaction of state policies to develop in a way that has created a Jobs Kill Zone
affecting low-income workers. We have all come to realise, during the COVID-19 crisis, that
low-income workers play vital roles in our community and it behoves policymakers to address
this issue.
The 2020 Exchequer Returns1 show that the major job losses and temporary layoffs caused by
COVID-19, affecting over 20% of all workers, did not have a major impact on income tax
receipts. Income tax receipts for 2020 only fell by 1% in 2019 and “PAYE and self-employed
receipts significantly exceeded initial expectations”2 of the Department of Finance. This
indicates that most of the workers affected by COVID-19 did not pay very much income tax.
This ISME research document examines the interaction of policies on tax and other deductions,
social welfare, health and housing for workers in the income range from €18k to €30k per
annum. We have made working so unattractive for many persons in this income zone that we
can call it the Jobs Kill Zone. We have done this through the deduction of USC, PRSI and income
tax and benefit loss, such as losing the medical card for working at less than “dole” entitlement
and the child element of unemployment assistance.
We will illustrate this by looking at the situation of a single person working at, or just above the
minimum wage and a worker with an adult dependent and 3 children, again working at, or just
above the minimum wage. All figures are for the year 2020.
Felim O'Rourke is a Sligo based economist. He has worked in business and education in Ireland
and the Gulf region. He has a particular interest in the position of low-income workers, the
interaction of taxation and welfare and the position of marginalised communities.
1
2020 Exchequer Returns, 5th Jan 2021
2
2020 Exchequer Returns, 5th Jan 2021
2Executive Summary
There is strong evidence to suggest that the interaction of our tax and welfare policies
penalises low-income workers with earnings between €18k and €30k per annum so severely
that it undermines their economic rationale for working. We call this income region the Jobs
Kill Zone.
Persons with low market skills and therefore low earning potential, such as early school leavers,
could be expected to react to this Jobs Kill Zone by either dropping out of the labour market or
adjusting their work practices to minimise taxation. Both appear to be occurring.
The policy failure that has allowed the Jobs Kill Zone to develop can be explained by a lack of
understanding of the private sector labour market by policy-makers. Particularly misleading is
the focus on average earnings of all workers. The 2018 figure for average (mean) earnings of
all workers is 41.5% higher than the earnings of typical (median) private sector workers.3
We suggest policy changes in four areas.
1 Adjusting PRSI to eliminate the very high marginal PRSI rate on additional income in the
PRSI Transition Zone from €18,304 to €22,048 per annum.
2 Set the basic rate for qualifying for the medical card at more than 30% above the
comparable Jobseekers assistance rate.
3 Replace the child element in Jobseekers payments and all other welfare schemes by
substantially increasing Child Benefit, phasing out Working Family Benefit, and at the
same time making the Child Benefit taxable.
4 Significantly increase the income thresholds for access to social housing. Reform or
remove the link between income and local authority rent.
These four policy changes taken together would eliminate the Jobs Kill Zone and significantly
improve the incentive to work among low-skill workers. We believe that there are strong
economic, social and moral arguments in favour of changing the policies which have created
the Jobs Kill Zone. We believe that our conclusions and recommendations are evidence-based
and that the benefits from these changes outweigh the costs involved.
3
Earnings Analysis using Administrative Data Sources 2018 (tables 4.2/4.3)
3Low paid workers without dependents
A person working at the 2020 national minimum wage4 of €10.10 per hour for 39 hours per
week had gross earnings €393.90 per week or €20,483 per annum for year 2020. This person,
if single, paid €558 in PRSI, €229 in USC and €797 in income tax leaving a net income of €18,899
as explained below.
The calculation of PRSI for low-income workers is extraordinarily complex.5 This is calculated
on a weekly basis. There is no PRSI for ordinary workers (Class A) on earnings below €352 per
week. PRSI is charged at 4% on earnings above €352.01 per week but there is a tapering PRSI
credit on earnings between €352.01 and €424 which reduces the amount of PRSI charged.
This means that there are effectively three PRSI zones. There is an income zone below €352
per week where no PRSI is charged, a zone between €352.01 and €424 per week which we will
call the Transition Zone and above €424 per week where PRSI is charged at 4% on all earnings.
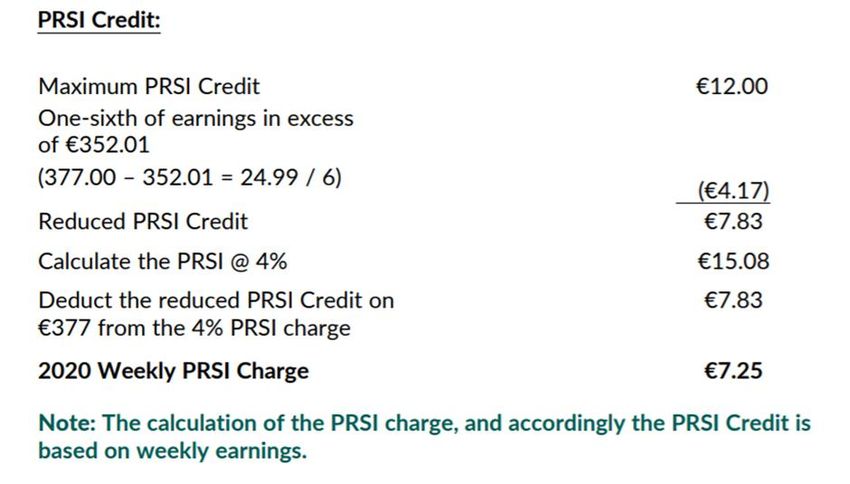
The PRSI algorithm in the Transition Zone is extremely complex. In the Transition Zone PRSI is
charged at 4% on earnings but this is offset by a PRSI credit. The maximum PRSI credit of €12
is reduced by one-sixth of earnings in excess of €352.01 per week. The algorithm for calculating
the weekly PRSI charge in the Transition Zone can be expressed in the below formula:
PRSI = Earnings * 0.04 - 12 + (Earnings - 352.01)/6.
The PRSI Guide provides a worked example of the calculation of the PRSI credit and PRSI charge
for weekly earnings of €377. This worked example is shown in Figure 1 below.
We have made all our calculations in this document, including PRSI, on an annual basis. There
is no PRSI on gross income below €18,304 per annum (€352 per week) and PRSI is charged at
4% on all gross income above €22,048 per annum (€424 per week). Between €18,305 and
€22,048 there is what we call the PRSI Transition Zone. The formula for annual PRSI in the
Transition Zone is:
PRSI = Gross Income * 0.04 – 624 + (Gross Income - 18,305)/6.
4
National Minimum Wage 2020
5
PRSI contribution rates and user guide from 1 January 2020
4Figure 1
The below table is from page 2 of the PRSI contribution rates and user guide 20206
The formula for calculating the PRSI charge means that the PRSI charge for persons who
increase their earnings by a small amount above the PRSI threshold pay a very high rate of PRSI
on their marginal earnings. In the worked example from the PRSI guide, in figure 1 above, the
worker has earned €377 per week or €25 per week above the €352 PRSI threshold. On this €25
per week the worker pays €7.25 or 29% of the additional earnings.
In simple terms a worker pays nothing in PRSI if s/he only earns €18,304 but pays €882 in PRSI
if s/he earns €22,048. Earning the additional €3,744 (€22,048 - €18,304) is penalized by having
to pay €882 in PRSI. This means that the marginal rate of PRSI over the Transition Zone is 23.6%
(€882/€3,744) and we have used this figure in Table 1.
USC is simple compared with PRSI. In 2020 USC was deducted at 0.5% on income up to €12,012,
at 2% then on additional income to €20,484 and at 4.5% on additional above €20,485.7 The
minimum wage full-time worker with gross earnings of €20,483 paid €229 in USC.
This single worker had a 20% tax band of €35,300 and a tax credit of €3,300 (single person tax
credit and PAYE tax credit). This worker paid no income tax on earnings up to €16,500 per
annum and paid tax at 20% on earnings from €16,500 to €35,300 per annum. This means that
6
PRSI contribution rates and user guide from 1 January 2020
7
Revenue, Universal Social Charge (USC)
5the full-time single minimum-wage worker, earning €20,483 in 2020, paid income tax at 20%
on €3,988 or €797.8
This means that the State took €1,584 in tax-type deductions (over €30 per week) from the
single minimum-wage worker doing a 39-hour week for 52 weeks.
What is even more amazing is that the single low-income worker, working full-time at the
minimum wage, suffered tax-type deductions of 48.1% on marginal income that they earned
because in addition to paying USC at 4.5% and income tax at 20%, they were paying PRSI at the
Transition Zone marginal rate of 23.6%9 (Local Authority (LA) rent can be an additional State
deduction from income if the person is getting LA housing support).
The income limit (qualifying financial threshold) for the medical card is composed of a basic
rate and allowable expenses.10 Allowable expenses include rent and travel-to-work costs
(discussed below). The basic rate for a single worker living alone is €9,568 per annum. The
medical card acts as an entitlement gateway to a range of other benefits such as free school
transport, reduced rate of USC, free state exam entry, etc.11 Up until 2006 the basic rate was
set by the government at budget time and was kept at substantially above the relevant
Jobseeker’s Allowance (JSA) rate. The basic rate has been set by the HSE since 2006 and has
not been increased since then. The JSA rate has risen substantially since 2006. For example,
the JSA rate for a family with 3 children rose by 36% and is now substantially above the medical
card basic rate. All persons claiming JSA automatically qualify for the medical card but persons
earning from work even less than the “dole” may not qualify for the medical card.
There is constant reference in discussion of health policy to our two-tier health system of
private health insurance and the medical card.12 There is a third category that the State does
not acknowledge and has never counted that seems to be largely ignored in public discussion
of health policy. There were 1.097 million persons or 22.3% of the population without either
private health or the medical card at the end of 2020.13, 14 Most high-income persons have
private health and all persons depending on social welfare automatically qualify for the medical
card. We can assume that the vast majority of the 1.1 million with no health cover are low-
income workers and their dependents. Many of these workers with no health cover are only
8
Revenue, Tax rates, bands and reliefs
9
PRSI contribution rates and user guide from 1 January 2020
10
HSE, Medical Card Application Process
11
Other Benefits for which the Medical Card acts as an “Entitlement Gateway”
12
Irish Times Editorial
13
This is our Estimate based on subtracting the Number of Persons covered by Private Health
Insurance (Health Insurance Authority) and the Medical Card (HSE) from the Total Population (CSO).
14
Journal.ie
6confronted with the implications of this when or if they face serious health issues such as
cancer as highlighted by the Irish Cancer Society.15
Some costs such as rent and travel-to-work costs are taken into account by the HSE in
determining whether an applicant is entitled to the medical card. In the HSE guide to the
medical card16 they show how a low-income worker could qualify for the medical card. The
example given shows the worker paying €9,600 annually in rent (52% of net income for the
minimum wage worker). This level of rent, however, is way above the maximum rent allowed
under the Housing Assistance Program (HAP) operated by local authorities (€5,520 per annum
in Sligo).17 A low-income worker paying this high rent would not qualify for housing assistance.
A single person working full-time at the minimum wage qualifies for housing assistance from
the LA as her/his net income is below the LA housing limit (Sligo) of €25,000 for a single
person.18 If this single worker gets accommodation directly from the LA or through HAP s/he
will pay the minimum annual rent of €1,144 plus 20% of net income above €9,360 per annum,
bringing the total annual rent to €3,049 (Sligo).19 The link between council rent and income
means an effective LA tax of 10.4% on top of central government tax of 48.1% on any additional
income. Therefore, the total tax-type deductions on a single low-income worker in LA-assisted
housing is 58.5% on any additional income such as the recent increase in the minimum wage.
The employee experience of taxation varies depending on the type of remuneration they
receive. The majority of high-skill employees, including most public servants, are paid by salary.
In this case, it is appropriate to use average tax rates to analyse the impact of taxation and
other deductions on employees, as this is a measure of the tax burden that they experience.
The concept of a “tax wedge” for example, is based on the average rate of tax. On the other
hand, most low-skill workers are paid an hourly wage and experience the impact of taxation
quite differently. Waged employees are paid based on the number of hours worked and often
have some control over this. These workers can account for the net income they could make
from additional hours and adjust their working hours appropriately. As such, it is appropriate
to use marginal tax rates to assess the impact of tax and other deductions on low-skill workers,
as they reflect the incentives to earn, save, invest or spend.
Table 1 summarises year 2020 government deductions from additional income for a single
worker at different earning ranges. These are the marginal rates for USC, PRSI and income tax
15
Irish Cancer Society
16
HSE, MC Application Process
17
Housing Assistance Payment Information (HAP)
18
Sligo County Council Housing
19
Sligo County Council Differential Rent Scheme
7at different income ranges. LA rent is not included. The Fuel Allowance benefit loss is also not
included.
Table 1: Marginal-rate deductions from additional income and benefit loss for single worker by
income ranges, annual figures for 2020.
Income Income Combined
USC PRSI Benefit Loss
Range € Tax Deductions
MC Income
0 - 12,012 0.50% 0% 0% 0.50%
Limit: 9,568
12,013 - 16,500 2.00% 0% 0% 2.00%
16,501 - 18,304 2.00% 0% 20% 22.00%
18,305 - 20,484 2.00% 23.60% 20% 45.60%
20,485 - 22,048 4.50% 23.60% 20% 48.10%
LA Housing
22,049 - 35,300 4.50% 4% 20% 28.50%
Limit: 25,000
35,301+ 4.50% 4% 40% 48.50%
Figure 2: Graphical representation of marginal-rate deductions from single worker by income
ranges (2020).
8The unemployment option for the single worker in 2020 gave a JSA of €10,556 per annum.20
The JSA acts as an entitlement gateway for both the Winter Fuel Allowance of €686 per
annum (€24.50 per week for 28 weeks)21 and the medical card. The medical card then acts as
a gateway to the range of additional benefits listed above. The unemployment option also
gives entitlement to LA housing. It may be possible for such a worker to supplement the
“dole” through the informal economy.
Overall, it is clear that employment for low-skills workers is only financially attractive if they
are content with working at the minimum wage and are not concerned with payment for
medical costs or need LA housing assistance. If they get increases above the national minimum
wage, then they lose either 48.1% or 58.5% in State deductions and they are not entitled to
the medical card and are very unlikely to be able to pay for private health insurance or private
housing.
Low paid workers with families
Workers with families are also impacted by the complex interaction of policies on tax and other
deductions, social welfare, health and housing.
We will illustrate this by looking at the situation of a worker with an adult dependent and 3
children under 12, working at or just above the minimum wage. All figures are for 2020.
This person working at the 2020 minimum wage for 39 hours per week had gross earnings of
€20,483, paid €558 in PRSI, €229 in USC and €0 in income tax leaving a net income of
€19,696.22, 23, 24
The PRSI and USC deductions for this worker with adult dependent and 3 children were the
same as for the single worker discussed above. This breadwinner with a spouse and 3 children
had a 20% tax band of €44,300 with a tax credit of €4,950 and could earn a gross income of
€24,750 before starting to pay income tax.25 This means that the State took €787 in tax-type
deductions (over €15 per week) from this minimum wage worker, with an adult dependent
and 3 children under 12, doing a 39-hour week for 52 weeks.
This full-time worker suffered state deductions of 28.1%, (23.6% Transition Zone PRSI and 4.5%
USC) on any additional income above the minimum wage until gross income reached €22,048.
20
Jobseeker’s Allowance
21
Winter Fuel Allowance Eligibility
22
PRSI contribution rates and user guide from 1 January 2020
23
Revenue, Universal Social Charge (USC)
24
Revenue, Tax rates, bands and reliefs
25
Revenue, Tax rates, bands and reliefs
9Then the Transition Zone PRSI disappears reducing state deductions to 8.5% (4% PRSI and 4.5%
USC) on additional income until gross income of €24,750 when State deductions jump to 28.5%
(4% PRSI26, 4.5% USC27 and 20% tax28) on any further additional income.
The income limit for the medical card for this family of 2 adults and 3 children was €19,942 net
income and so this family got the medical card while the breadwinner worked. Any significant
increase in income, however, would threaten the medical card. This family also qualified for LA
housing while their net income remained below €28,750.29
The difference in State support between the children of workers and the children of those
relying on social welfare is very important for low-paid workers. All parents of children,
whether working or depending on social welfare, are paid Child Benefit. This was €1,680 per
child under 12 years in 2020, so families with 3 children got €5,040 in total in Child Benefits,
whether working or unemployed. Persons depending on JSA, however, got €1,872 per child
(under 12) per annum (child element in JSA). This costs an estimated €70m per annum in social
protection.30 Therefore, this family received €5,616 extra each year if the breadwinner was
unemployed but received nothing extra linked to their child dependents if the breadwinner
was working.31
This is illustrated by the table below which shows the impact of the different treatment of
children of workers and children of unemployed persons. This table is based on a full-time
minimum wage worker (breadwinner) with an adult dependent and varying number of children
below 12 years old.32
26
PRSI contribution rates and user guide from 1 January 2020
27
Revenue, Universal Social Charge (USC)
28
Revenue, Tax rates, bands and reliefs
29
HSE, Medical Card Application Process
30
Statistical Information On Social Welfare Services 2019
31
Child Benefit Rules
32
Jobseeker’s Allowance
10Table 2: Income from Jobseekers and full-time minimum wage work for families with children
Number of Jobseekers Net Income
Children Allowance (Min Wage, Full-time)
0 €17,560 €19,695
1 €19,432 €19,695
2 €21,304 €19,695
3 €23,176 €19,695
4 €25,048 €19,695
5 €26,920 €19,695
Note: Child Benefit as a universal payment is not included in table 2.
A family with 3 children, if the breadwinner chose to remain unemployed, s/he received
€23,176 in JSA in 2020 but only €19,695 net income from working full-time at the 2020
minimum wage. If the wage rate was at the national living wage of €12.30 the breadwinner
would only take home €22,980 - still less than the “dole.”33
This means that the interaction of State policies strongly discourages low-skills families with
children from working, especially larger families. The State has introduced several schemes to
address this issue including the Working Family Payment (WFP),34 formerly known as the
Family Income Supplement (FIS), the Back-to-Work Family Dividend35 and the HSE Medical
Card Retention Scheme.36
Applying for the WFP is very complex.37 Additional earnings are strongly discouraged by
deductions of 71.5% on any additional earnings (USC of 4.5%, “transitional PRSI” of 23.6% and
60% reduction (based on net income in the WFP- with 1 year delay) for a fulltime minimum
wage worker. The WFP is very generous but also highly complex. In 2017 the average payment
per child under WFP was €3,300 but only 60,000 families benefited.38
The Back-to-Work Family Dividend allows families moving from unemployment to work to
retain the child element of the unemployment assistance for 2 years but only 5,345 persons
33
Jobseeker’s Allowance
34
Working Family Payment
35
Back to Work Family Dividend
36
HSE Scheme for retaining the Medical Card
37
WFP Application Form
38
Parliamentary Question 3036-18
11returning to work benefited from this scheme in October 2019.39 Since this is a 2-year scheme
it is likely that there were only about 3 thousand new beneficiaries in 2019.
The Medical Card Retention Scheme allows a person returning to work after a period of
unemployment to retain the medical card for 3 years. The HSE response to our FOI Request for
information on the number of persons benefiting from the Scheme (FOI 2627) was that they
do not have the information requested.
These schemes seem to assume that workers taking up employment will achieve rapid pay
increases to offset the loss of the child element of the JSA and the medical card. Automatic
increments are a feature of the public sector where workers such as teachers, nurses and
Gardai, whose starting salaries are all above the Job Kill Zone, have annual increments which
increase their pay substantially. Annual increments increase earnings by more than 56% for
Nurses,40 72% for Gardai41 and 83% for teachers42 without any promotion. Low skills workers
in the private sector do not normally have such incremental wage increases.
The impact of the interaction of state policies can be seen clearly in the labour market
participation rate for early school leavers in the Labour Force Surveys.43 Early school leavers
are defined as those who leave education without even having achieved the Junior Cert level,
ISCED levels 0, 1 and 2.44 Labour market participation means either working or actively seeking
work (actively seeking work means that they must have taken some concrete action, such as
applying for a job, within the previous 4 weeks. Being registered for UA or UB does not
necessarily mean that the person is actively seeking work45 in terms of the ILO definition).
Between Quarter 4 of 2010, when the Irish economy was in deep recession, and Quarter 4 of
2019, when our economy was booming, the labour market activity rate for early school leavers
fell from 49.1% to 42.2%. This is lower than the eurozone average for early school leavers at
54.7%, which is also unsatisfactory. The best performance in Europe in terms of labour market
activity by early school leavers is by Iceland where 71.9% of early school leavers were active in
Quarter 4 of 2019.46
39
DEASP Annual Statistical Report 2019 - Table E4
40
HSE Consolidated Pay Scales
41
Garda Pay Scale, Garda.ie
42
Teachers Salary Scale, Dept of Education
43
Eurostat LFSQ_ARGAED
44
International Standard Classification of Education, 2011
45
ILO Definition used by CSO
46
Eurostat LFSQ_ARGAED
12The very low employment rates for Irish early school leavers were confirmed by the
Educational Attainment Thematic Report for 2019.47
The labour market activity rate by contrast for third level graduates in Ireland for Quarter 4 of
2019 was 88.7%, slightly higher than the eurozone average of 88.4%.48
The fall in labour market participation, while total employment was growing rapidly, cannot be
explained by job shortages. The way that the interaction of state policies impact on low-income
workers offers a credible explanation. We have created a Jobs Kill Zone for workers earning
between €18k and €30k per annum and therefore should not be surprised that low-skills
workers are opting out of the workforce.
Housing
Housing is, in most cases, the largest monthly outlay for workers, and where purchased, the
largest financial transaction workers will ever undertake. The average house price in Ireland in
Q1 2021 was €275,751.49
This is a multiple of 6.3 times the average industrial wage of €43,939, and 13.5 times the annual
National Minimum Wage of €20,483 (2020).
The current income limits for people wishing to avail of social housing supports are set by the
Department of Housing, Local Government and Heritage50 and are annexed at Appendix I.
Broadly, this sets the income limit for a single person seeking social housing at €35,000 in the
conurbations, €30,000 regionally, and €25,000 in rural areas.
Single Person As A Percentage of As A Percentage of
Income Limit Minimum Wage Average Industrial
Wage (Q4 2020)
Band 1 35,000 171% 80%
Band 2 30,000 146% 68%
Band 3 25,000 122% 57%
These income limits, relative to the cost of housing in Ireland, are sufficient reason on their
own for many people to decline higher rates of pay, or indeed to decline to work at all. We are
47
Educational Attainment Thematic Report
48
Educational Attainment Thematic Report
49
Daft.ie House Price Report Q1 2021
50
Social Housing Income Limits
13aware of many cases where individuals have declined a job, as well as where workers have
declined a promotion, purely because of the impact on their ability to remain on the social
housing list. This is unsustainable.
Explaining the Policy Mismatches
There are several reasons why this situation has been allowed to develop. The first reason is
that the interaction of these policies falls outside the domain of both tax experts and social
policy experts. Tax experts only focus on taxation and social policy experts focus on social
policy. The interaction of policies is very complex and has been largely neglected. The
interaction of these policies is most important for low-skills workers, but they do not have a
strong voice.
The focus of our economic strategy for the last 30 years has been on high-tech and having a
highly educated workforce to drive knowledge-based industries. In this we have been highly
successful, and as of Quarter 4 2019, we have the highest proportion of graduates in the
workforce of all 27 EU countries, just slightly above Luxembourg by 0.21%.51, 52 These
knowledge-based industries have been resilient during the COVID-19 crisis. The downside of
the emphasis on higher education is that we have not had a focus on the position of early
school leavers.
Policy-makers including politicians, senior civil servants and policy analysts have incomes that
are multiples of the incomes available to low skills workers and therefore rely on CSO data on
incomes to guide them. The main source of information on earnings in Ireland is the CSO’s
earnings and labour costs quarterly53 (ELC). Before COVID-19 all these ELCs used a standard
format in their introductory notes. The ELC for Quarter 3 of 2019 stated that “average weekly
earnings were €768.14 in Q3 2019, an increase of 3.4% from €742.75 one year earlier.”54 Each
of the next five sentences also dealt with aspects of average earnings. Average earnings
however can give a misleading picture of typical earnings, particularly private sector earnings.
A much deeper insight into earnings is given by the CSO’s ‘Earnings Analysis using
Administrative Sources’ (EAADS). The most recent EAADS is for 2018.55 The primary source for
EAADS is the Revenue Commissioner’s data on employee annual earnings. Tables 4.2 and 4.3
(See Appendix II) give mean and median earnings per week for public and private sector
workers. Tables 8.2 and 8.3 give mean and median annual earnings for public and private
51
Employment by Educational Attainment Level - Quarterly Data- Tertiary Education
52
Employment and Activity by Sex and Age - Quarterly Data
53
Earnings and Labour Costs Q3 2019
54
Earnings and Labour Costs Q3 2019
55
Earnings Analysis using Administrative Data Sources 2018 - CSO - Central Statistics Office
14sector workers. The annual figures however exclude “employees who worked for less than 50
weeks in the reference year.”56 We have used the weekly data for the analysis below.
Table 4.2 of EAADS 2018 shows that mean earnings for all workers in 2018 was €740.72 per
week with mean public sector earnings of €930.03 per week compared with mean private
sector earnings of €687.57 per week.
Table 4.3 shows that median earnings for all workers in 2018 was €592.60 per week with
median public sector earnings of €844.23 per week compared with median private sector
earnings of €523.25 per week.
Most policymakers are public servants and are therefore more familiar with public sector pay
scales. Median or typical public sector earnings at €844.23 per week were 61% higher than
median or typical private sector earnings at €523.25 per week. If policymakers rely on CSO data
on average earnings to give them insight into the earnings of private sector workers they will
be misled. Mean earnings for all workers in 2018 at €740.72 per week were 42% higher than
median private sector earnings of €523.25pw, which is the realistic comparator figure for
private sector workers.
The private sector median earnings at €523.25 per week is equivalent to €27,209 per annum.
This means that 50% of all private sector workers had earnings/gross income below €27,209.
This means that well over 50% of private sector workers had earnings in or below what we are
calling the Jobs Kill Zone where the complex interaction of state policies strongly discourages
workers either from employment or working additional hours.
The treatment of low-income workers contrasts with the treatment of high earners and those
depending on welfare. The failure to take into account the position of low-income workers is
symbolized by the way many of them find themselves excluded from our two-tier health
system of private health cover for high earners, supported with tax relief,57 and the medical
card for unemployed persons.
Our taxation system recognises that the level of personal taxation should not discourage work
for high earners. The combination of USC at 8%, PRSI at 4% and income tax at 40% on high
earners (over €70k per annum) only comes to 52%, yet low earners suffer much greater losses
through deductions and benefit loss.58, 59, 60
56
Earnings Analysis using Administrative Data Sources 2018- Annual Earnings
57
Revenue Commissioners, Tax Relief for Medical Insurance
58
Revenue, Universal Social Charge (USC)
59
PRSI contribution rates and user guide from 1 January 2020
60
Revenue, Tax rates, bands and reliefs
15Our welfare system is also very generous to persons who are unemployed compared with the
way our welfare, taxation and health systems treat low-income workers. This is illustrated by
the example above of the low-income breadwinner in a family with a dependent adult and
three children under 12. On the “dole” in 2020 the “breadwinner” got €23,176 per annum.
Working at the national minimum wage the breadwinner had only €19,695 net per annum
from working full-time.61
The low and falling labour market participation rate that we had pre-COVID-19 is likely to be
made even worse by the COVID-19 crisis. This is going to be massively damaging to our
economy and society. COVID-19 should have taught us that “low status” workers play vital
roles in our community.
We have marginalized communities of people with low educational achievement, low jobs
skills, low employment participation and the social problems associated with intergenerational
marginalization. In some of these communities, such as the Traveller Community where family
size is large, the unemployment rate is over 80%.62 We cannot have integrated communities
without involving most persons from these marginalized communities in work activities, as is
outlined by the Department of Justice 2017 policy paper on the new migrant communities.63
This means that there are strong moral, economic and social arguments in favour of addressing
the issues linked to how our policies in welfare, health, housing and taxation interact in a way
that is very unfair to low skills workers. As such, it is driving many persons with low labour
market skills out of the labour market.
Recommendations
There are four policy changes that would go a long way to re-balancing the labour market for
early school leavers, make the treatment of low paid workers fairer and encourage early school
leavers and low skills workers to take up employment.
The first would be to change the income limit for the medical card by getting rid of the complex
application process and the calculation of allowable expenses and have the income limit set at
the Jobseeker’s rate plus at least 30%. This change would eliminate the need for the HSE’s
Medical Card Retention Scheme and the income assessment for the medical card.
61
History of Minimum Wage in Ireland
62
National Traveller and Roma Integration Strategy 2017
63
Migrant Integration Strategy 2017 -2020
16The second change would be to restructure the calculation of PRSI to eliminate the Transition
Zone marginal PRSI Rate of 23.6%. This could be done in a revenue neutral way but there would
be losers as well as winners.
The third would be to eliminate the child element in unemployment assistance (and a host of
other welfare payments which have a child element) and replace it by substantially increasing
Child Benefit, while simultaneously making Child Benefit taxable. This change would leave the
position of persons on unemployment assistance and other welfare payments and persons on
the high tax rate largely unchanged. The only people who would benefit would be low-income
working families. This change would eliminate the need for both the Working Family Benefit64
(FIS, c.€390 million per annum) and the Back-to-work Family Dividend65 (c.€20 million per
annum).
There could be a difficulty with this in terms of persons working in Ireland and claiming Child
Benefit for children living elsewhere in the EU.66 This might be overcome by linking the
payment to school attendance within the state or some other measure to prevent what might
be seen as abuse.
The impact of the cost of accessing housing is, on its own, a significant motivating factor for
people on low incomes. The only realistic way to address this is to significantly increase the
income thresholds for access to social housing. The fact that local authority rent charges are
also linked to the renter’s income actively discourages local authority tenants from declaring
further income. Reform or remove the link between income and local authority rent.
These four changes are practical and the implications of each in terms of cost and benefits is
easy to predict. Together they would transform the position of low-income workers and create
an incentive for early school leavers both to stay longer in education and to enter the labour
market. These changes would benefit both marginalized communities and the overall
community.
Lastly, we should point out that administering our social protection system costs the State
more than €800 million annually. Simplifying our system of allowances and entitlements would
ease this burden considerably.
64
Working Family Payment
65
Back to Work Family Dividend
66
Child Benefit Rules
17Appendix I: Social Housing Income Thresholds
Table of maximum net income limits in
Social Housing Assessment Regulations, 2011, as amended.
2nd June 2016
Band City and County Councils Maximum Net Income Maximum Income
Threshold – single person Threshold – 3 adult & 4
child family
1 Cork City €35,000 €42,000
Dublin City €35,000 €42,000
Dún Laoghaire Rathdown €35,000 €42,000
Fingal €35,000 €42,000
Galway City €35,000 €42,000
Meath €35,000 €42,000
South Dublin €35,000 €42,000
Kildare €35,000 €42,000
Wicklow €35,000 €42,000
2 Cork County €30,000 €36,000
Kerry €30,000 €36,000
Kilkenny €30,000 €36,000
Limerick City & County €30,000 €36,000
Louth €30,000 €36,000
Wexford €30,000 €36,000
Waterford City & County €30,000 €36,000
3 Carlow €25,000 €30,000
Cavan €25,000 €30,000
Clare €25,000 €30,000
Donegal €25,000 €30,000
Galway County €25,000 €30,000
Laois €25,000 €30,000
Leitrim €25,000 €30,000
Longford €25,000 €30,000
Mayo €25,000 €30,000
Monaghan €25,000 €30,000
Offaly €25,000 €30,000
Roscommon €25,000 €30,000
Sligo €25,000 €30,000
Tipperary €25,000 €30,000
Westmeath €25,000 €30,000
18These income bands are expressed in terms of a maximum net income threshold for a single-person
household, with an allowance of
• 5% for each additional adult household member, subject to a maximum allowance under
thiscategory of 10%, and
2.5% for each child, subject to a maximum allowance under this category of 10%.
Net income is defined in the Household Means Policy which also specifies what kinds of
income areassessable for the purposes of the Regulations.
See the table below for examples of the limits for different sizes of household.
These limits are the current maximum thresholds set by the Minister in Regulations. Note that a
housingauthority may set a lower limit if appropriate.
Two Three
adults adults
Single 2 adults One One Two plus 4 or plus 4 or
Person no adult one adult two adults 1 Two adults Two adults more more
household children child children child 2 children 3 children children children
Band 1
€35,000 €35,000 €36,750 €35,875 €36,750 €37,625 €38,500 €39,375 €40,250 €42,000
Band 2
€30,000 €30,000 €31,500 €30,750 €31,500 €32,250 €33,000 €33,750 €34,500 €36,000
Band 3
€25,000 €25,000 €26,250 €25,625 €26,250 €26,875 €27,500 €28,125 €28,750 €30,000
Social Housing Policy
June 2016
19Appendix II: Mean Vs Median Income
Table 4.2 Mean weekly earnings by NACE principal activity, public/private sector status and sex
Male Female Total
NACE Principal Activity
2016 2017 2018 2016 2017 2018 2016 2017 2018
€ € € € € € € € €
B-E Industry 899.11 912.74 942.78 734.74 751.94 788.00 853.58 868.28 899.22
F Construction 660.07 682.08 716.81 470.57 489.08 504.13 640.29 661.97 694.09
Wholesale and retail trade; repair
G 631.49 652.19 670.89 434.94 448.86 454.41 532.64 549.86 562.30
of motor vehicles and motorcycles
H Transportation and storage 731.22 740.53 768.44 605.44 614.04 636.34 703.01 712.04 738.69
I Accommodation and food services 377.58 388.33 396.52 291.98 299.31 305.94 331.84 340.64 347.64
J Information and communication 1,233.85 1,298.24 1,346.82 960.93 1,014.30 1,062.72 1,136.28 1,196.28 1,244.13
K-L Financial, insurance and real estate 1,251.43 1,280.14 1,331.04 825.69 850.75 883.32 1,020.51 1,049.18 1,091.92
Professional, scientific and
M 1,028.37 1,050.42 1,075.78 713.92 733.30 756.50 868.35 890.36 916.76
technical activities
N Administrative and support services 617.96 641.68 670.17 473.61 485.48 499.05 557.85 575.11 595.89
O Public administration and defence 968.04 992.27 1,007.48 798.62 813.98 830.51 894.77 914.49 930.07
P Education 822.25 843.93 877.76 712.09 734.01 752.85 742.99 764.87 787.47
Q Human health and social work 886.49 904.57 931.57 640.74 651.71 668.54 688.33 701.27 720.48
Arts, entertainment, recreation and
R-S 556.74 564.25 570.52 376.83 384.14 394.75 447.19 454.55 462.54
other service activities
Total 796.57 817.74 847.35 600.32 616.30 635.12 697.64 716.40 740.72
Of which:
Public sector1 1,008.68 1,030.80 1,056.51 812.76 833.07 854.57 886.13 907.04 930.03
Private sector 754.56 775.33 806.13 521.29 534.63 552.77 644.75 662.47 687.57
1
Public sector including semi-state companies. See Background Notes for further information.
Source: CSO Ireland, Earnings Analysis using Administrative Data Sources
Table 4.3 Median1 weekly earnings by NACE principal activity, public/private sector status and sex
Male Female Total
NACE Principal Activity
2016 2017 2018 2016 2017 2018 2016 2017 2018
€ € € € € € € € €
B-E Industry 707.24 717.70 740.27 592.94 606.51 628.68 673.13 684.71 706.73
F Construction 592.92 613.72 648.31 397.86 423.60 441.57 575.74 596.88 626.10
Wholesale and retail trade; repair of motor
G 504.52 516.81 531.45 352.44 358.37 366.62 421.38 430.35 441.13
vehicles and motorcycles
H Transportation and storage 621.62 631.10 650.60 538.22 544.92 563.63 599.63 607.52 627.81
I Accommodation and food services 347.84 353.73 361.85 266.92 272.13 276.32 303.57 309.20 313.59
J Information and communication 1,027.85 1,065.60 1,101.17 755.22 784.77 815.78 923.37 961.52 991.18
K-L Financial, insurance and real estate 908.86 939.79 981.56 678.92 698.45 717.33 763.02 787.92 817.67
M Professional, scientific and technical activities 766.83 787.81 804.54 573.84 586.95 602.88 656.46 674.94 692.31
N Administrative and support services 494.92 510.62 534.67 387.59 401.37 409.14 456.44 468.93 485.90
O Public administration and defence 892.64 896.57 904.40 743.10 752.10 762.75 821.96 832.33 841.54
P Education 761.95 774.63 798.38 686.67 707.85 728.92 697.25 722.88 743.71
Q Human health and social work 719.29 733.83 752.83 587.68 599.27 613.02 613.40 626.85 643.54
Arts, entertainment, recreation and other service
R-S 415.60 425.13 436.23 311.52 318.15 326.15 348.00 354.88 363.79
activities
Total 618.70 636.13 659.58 494.12 504.77 517.62 560.21 575.75 592.60
Of which:
Public sector2 912.31 920.96 937.94 764.73 779.72 792.87 817.40 831.00 844.23
Private sector 568.87 585.17 606.39 404.94 414.94 428.00 492.31 505.06 523.25
1
Median weekly earnings: Half of the employees earn more than this amount and half earn less.
2
Public sector including semi-state companies. See Background Notes for further information.
Source: CSO Ireland, Earnings Analysis using Administrative Data Sources
20For further information, please contact:
Felim O’Rourke
E: felimorourke@gmail.com
T: 087 2437360
Sheema Lughmani
Press, Policy and Research Officer
T: 01 6622755
E: sheema@isme.ie
21You can also read