www.penguinwealth.com 02920450143 - Penguin Wealth
←
→
Page content transcription
If your browser does not render page correctly, please read the page content below
1
www.penguinwealth.com   02920 450 143   Info@penguinwealth.com

Contents

Introduction                                                                         3

What we said in 2016                                                                 4

The fees that managers may get and why this could be described as scandalous when
performance is poor                                                                  4

Why performance makes such a big difference to Investor outcomes                     5

Summary Findings                                                                     7

2020 findings                                                                        8

Overall Conclusions                                                                  8

Background and Sources                                                               9

Crown Rating                                                                         10

The Pension Review Service                                                           12

About Penguin                                                                        13

Appendix                                                                             15

                                           2
 www.penguinwealth.com               02920 450 143          Info@penguinwealth.com
A Research Report from Penguin
If, by end of this report, you identify with the funds presented, or you have old Pensions/funds
you haven’t yet reviewed, contact us via the details below.

    Tel: 02920 450 143 | Web: www.penguinwealth.com | Email: info@penguinwealth.com

  You can also click the below button to be taken directly to our free Pension Review Service page.
   This page will outline how you can access our Pension Review Service and what information is
                                              provided.

Introduction
In 2016 we produced research which was called “The Billion Pound Pension Funds that Fail Investors”.

This highlighted some staggering findings, in particular that many very large Pension funds had
systemic poor performance records.

Today – in mid-2020 – we have refreshed this research, looking again at Pension funds which have
more than £1 Billion in them.

The findings are summarised in this report, which includes a section which reviews how some of the
culprits from 2016 have fared since.

This is important because we need to ensure if we identify poor funds, they don’t then start
performing well. As that could suggest the value of the research is reduced or even mitigated entirely.

The summary findings are contained below and are accompanied by our view on what this means in
each instance.

We also provide guidance on how Investors in such funds should deal with this and how Investors can
access our review service to get specific reviews of their own funds.

                                                 3
 www.penguinwealth.com                     02920 450 143              Info@penguinwealth.com
What we said in 2016…
Here’s the introduction to our 2016 report, these words are still just as true today as they were then:

“It would seem reasonable to assume that if a Pension fund has more than £1 BILLION POUNDS of
Pension Investors’ money it – it should be a good Investment.

It may come as a surprise therefore to report that there are many such funds which are – judged on a
series of performance measures – actually VERY POOR Investments.

Pension Investors are rewarding these £1 Billion pounds plus funds and the companies that manage
them with huge fees despite the fact they are failing. These fund managers are ‘getting away’ with
producing absolutely nothing of value to their customers and still being paid vast riches for their
failure.”

The fees that managers may get and why this could be
described as scandalous when performance is poor
The definition of a Billion-Pound fund is very simple. It is any fund which at the time of this research
manages a total of £1 Billion or more as measured by fund size.

£1 Billion is 1,000 million pounds.

                                                                            Source: @Humphreytalks

Some of the funds listed below – which are serial underperformers – have multi billion pounds within
them. This is astonishing because it means hundreds of thousands of Pension Investors are, all at

                                                  4
 www.penguinwealth.com                      02920 450 143             Info@penguinwealth.com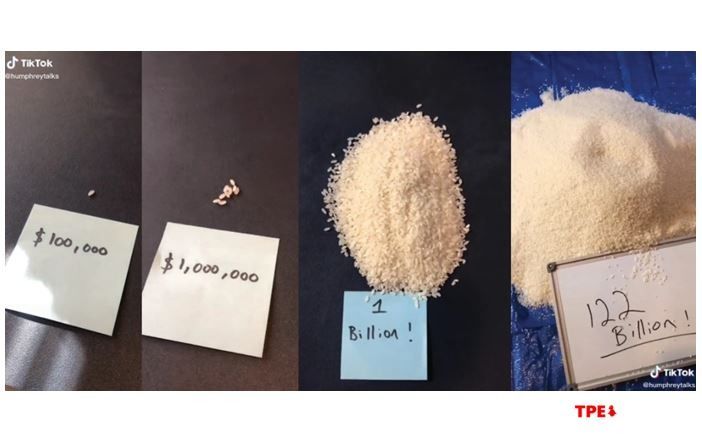
once, leaving their money in these funds even though the fund managers are seriously letting them
down.

Worse, they are paying for this so-called ‘privilege’.

Let us look at a typical fund with, as an example, £3 Billion in it. Various estimates are available, which
suggest that the average holding, per Investor, in a typical fund is anything from £22,000 to £30,000.
Let us assume for one moment that it is the higher figure.

£3 Billion divided by £30,000 = 100,000.

That means a typical fund of that size might have 100,000 Investors. It is more likely to be higher than
this.

A typical £3 Billion-pound fund might have an ANNUAL FEE of 1%.

£3 Billion x 1% = £30 million.

That means the fund manager – at that level of annual management fee – is receiving £30 million per
year for managing the fund. A huge reward for providing nothing of value.

Funds charge different amounts, some are 1%, some lower, some even higher.

The principal point is that large funds, charging a percentage fee, receive substantial multi-million-
pound sums every year.

Why performance makes such a big difference to Investor
outcomes
The effect of compounding returns is so great that Investors need to be very wary of small differences
in annual returns.

Especially over time.

Let us take the simple example of two people each with £80,000 in a Pension fund. One obtains 3.5%
per year (after allowing for costs/charges) “Investor One” and the other one gets 6% per year (after
allowing for costs/charges) “Investor Two”.

How much money do they each have in the future?

After 5 years
Investor One (3.5% per year return) has £95,015

Investor Two (6% per year return) has £107,058

After 10 years
Investor One (3.5% per year return) has £112,848

Investor Two (6% per year return) has £143,268

                                                   5
 www.penguinwealth.com                       02920 450 143              Info@penguinwealth.com
After 20 years
Investor One (3.5% per year return) has £159,183

Investor Two (6% per year return) has £256,571

After 30 years
Investor One (3.5% per year return) has £224,543

Investor Two (6% per year return) has £459,479

Therefore, paying attention to performance is important.

Relatively small performance differences can make very large differences in future fund value. Over
30 years in the example above, the difference is approximately £225,000.

No-one can get better performance ‘on demand’ and there are no guarantees of finding better
performance through any simplistic method. But, being conscious of performance levels, striving for
better returns (without taking unsuitable risks) and constantly reviewing funds all are things that
may help.

As does not using or Investing into funds that have proven poor performance.

                                                6
 www.penguinwealth.com                    02920 450 143            Info@penguinwealth.com
Summary Findings
1. An update on the 2016 findings
In 2016 we identified 34 Pension funds that we classified as ‘poor’.
To review these again gives us a valuable benchmark to see if our research is reliable, after all we are
looking backwards with the measurements, so does poor performance persist?
Of the 34 ranked as poor in 2016 here is how these funds rank today:
• 2 have moved to good
• 21 have moved to average
• 11 have stayed as poor
It is worth noting, however that of the 34 funds ranked in 2016, 9 would today be reclassified in such
a way they would not feature in our rankings at all. See the Background and Sources section for more
explanation.
In that respect 25 funds are in a similar position today as they were in 2016, true ‘active’ managed
funds and of these:
• 2 are good (8%)
• 13 are average (52%)
• 10 are poor (40%)
This suggests that poor performance persists, and even if a fund recovers it does not become ‘good’
– in most cases.
This, in our view, is not surprising if poor performance amongst these giant funds is indeed, at least in
part, ingrained.
This is backed by the findings of all Billion-Pound Pension funds we looked at in 2016 where we
concluded in the original report at that time that:
• 12% were good
• 50% were average
• 38% were poor
When we consider the percentages that fall into each category, they remain broadly the same. Hence
the systemic conclusion.
This is an update on the funds we researched in 2016. Now we can show how the research we have
done in 2020 compares.
7
www.penguinwealth.com 02920 450 143 Info@penguinwealth.com1. 2020 findings
We reviewed 153 Pension funds we could classify as qualifying as true £1 Billion Pound + Pension
funds.
Of these, according to our ratings:
• 39 were good (26%)
• 2 were average (47%)
• 42 were poor (27%)
This represented a slightly better split than the 2016 findings, but still emphasised the sheer number
of poor funds that exist.
What was especially notable from the findings, were the number of funds offered by Aviva and St
James Place that featured in the category described as poor.
Aviva had 10 funds then SJP had 8 funds that comfortably met the poor definition.
Approximately £140 Billion is collectively managed in these poor funds.
It is estimated that over 5 million Pension Investors are Invested in these poor performing £1 Billion+
funds.
2. Overall conclusions
By and large nearly all fund managers take their fees as a percentage of the size of a fund.
The attempt to identify poor funds, amongst these giants, is driven by an observation that the size of
a fund would logically suggest it should perform better. Why? Because, again logically, large numbers
of Investors have flocked to that fund because they are seeking good management of their long-term
Pension savings.
If we can find poor performers amongst this group of very large funds, we are exposing the fact that
they are failing. Despite their poor performance, and because of their size, the fund management
team or group running the fund still receive very high fee levels.
One of the ways we measure fund performance is against the performance of similar funds, which
are alternatives for pension savers to use. These comparable funds are both large and small.
Looking at the 2020 findings in isolation, large funds clearly do not perform better than smaller funds.
They are not likely to have lower percentage fees, the question of why use them is, therefore a valid
one.
There are some very good large funds, that is clear.
But between our research in 2016 and 2020 we also know that there are some consistently poor ones.
Pension savers future fund values are being damaged by Investing into these.
8
www.penguinwealth.com 02920 450 143 Info@penguinwealth.comAt an individual level any Pension fund saver should be aware of the performance, in relation to
alternatives open to them, and should – in our opinion – be prepared to regularly review poor
performers to see if they can spot consistent failings.
They should also be prepared to look at funds of all sizes and not be swayed by a fund’s size, a group’s
brand name or excuses commonly offered for below par returns.
Background and Sources
1. How the research is conducted
Just over three hundred qualifying funds were identified from the sources we used. Many of these are
duplicates of the same fund, complicating matters - see next section for further detail of these
complicating factors.
Once a fund has been identified as having more than £1 Billion pounds Invested within it, we then look
at two measures of performance:
• Its ranking against its peer group over different periods of time
• Its Crown Rating
Ranking against its peer group over different periods of time
We believe this is a key metric.
When a fund sits in a ‘sector’, for example the UK Equity sector, this tells us what its purpose or
objective is likely to be.
In this example, UK Equity funds will Invest into a pool of companies that are by and large listed on
the UK stock market.
We can then look at its performance position, based on where it sits in a quartile ranking. If a fund sits
in the top quartile, this means it is amongst the best 25% of funds – in that sector – and has performed
well against its peer group.
If it is in the bottom quartile it is amongst the worst 25%.
We award points as follows:
Top quartile 1 point
Second quartile 2 points
Third quartile 3 points
Fourth quartile 4 points
So, a low score is good, and a high score is bad.
9
www.penguinwealth.com 02920 450 143 Info@penguinwealth.comBut we recognise that looking at a moment in time or over just one period can throw up anomalies –
to mitigate this we therefore look at various periods (five in total) and award points based on each
period.
Then we add those points up.
The lowest number of points a fund can have is 5, the highest is 20, with 5 being exceptional and 20
being terrible.
Judging funds against its immediate peer group is very important. If you are Invested in an UK Equity
fund which has poor performance, you could be or have been in another fund which may have
performed much better or perform better in the future.
Crown Rating
The Crown Rating is a publicly available rating of a fund and is considered a robust way to view a fund’s
performance.
Here is how Trustnet describe the rating system:
“FE fundinfo Crown Ratings are a quantitative measure covering the hundreds of thousands of
Investment instruments that we collect worldwide.
They enable Investors to distinguish between funds that are strongly outperforming their
benchmark and those that are not.
The top 10% of funds will be awarded five FE fundinfo Crowns, the next 15% receiving four Crowns
and each of the remaining three quartiles will be given three, two and one Crown(s) respectively.
Rebalanced twice a year in January and July, the rating takes into account three key measurements
to derive a fund’s performance: alpha, volatility and consistently strong performance.
FE fundinfo Crown Ratings are frequently used by professional advisers to screen for the best
performing funds in a sector and at a factsheet level are used as part of an adviser’s paper trail to
show thorough and rigorous research has been undertaken.”
We use these Crown Ratings as a measure to cross check against the point rating system we have
employed, described in the previous segment.
If we find funds that a fund ranks as poor on both rating systems, we are confident the pointers are
reliable, accurate and telling a story.
The funds we describe as ‘poor’ in this document fail based on both metrics.
10
www.penguinwealth.com 02920 450 143 Info@penguinwealth.com2. Problems with this sort of research and overcoming these
Any review of funds of this sort is challenging for several reasons:
• Funds will often change their names over time
• Funds may be closed or amalgamated with other funds
• Funds may be reclassified, changing their sector comparison
• Funds will often have multiple series of the same fund depending on how they can be accessed
• It may be difficult to get reliable information on fund performance and/or fund size in every
case
• Although funds may sit in the same sector as other similar type fund names, they may have
different Investment objectives, therefore not entirely comparable
• We wish to avoid including “passive” or “index” funds – it is not always clear if a fund is a true
passive or index funds
Overcoming these challenges:
Wherever possible, we cross check with other sources when we find it difficult to identify if a fund has
more than £1 Billion pounds in fund size and/or we cannot ascertain if it is a passive/index fund and/or
its performance record is unclear.
We will cross check with information on the Company or Fund Management Group’s own website,
with other analytical, agencies sites or software tools.
Why we ignore passive or index funds:
We do not include this type of fund because they are different in nature, employing a management
technique of tracking an index (e.g. FTSE All Share or S+P 500) where the fund manager makes no
active fund management decisions. They exist to replicate the performance of a market as a whole
and should therefore be close to or around average performance. Such funds do not normally have a
Crown Rating and are, in effect, a different proposition.
3. Sources
We used FE Analytics to get a complete and accurate list of all the Pension Funds in the UK with a
minimum of £1 Billion Assets under Management. This was determined by going to the Pension option
under the ‘Fund Universe’ and using the ‘fund size’ to filter out the funds with assets of under a £1
Billion. Once this was done, the list was generated with the necessary funds and their fund size. To
double check the list, we checked the factsheet of each fund to ensure the figures were correct.
11
www.penguinwealth.com 02920 450 143 Info@penguinwealth.com4. Disclaimer
Penguin Wealth Planners Ltd have conducted this research for the benefit of Pension savers. In every
area and in every way the information presented has been put together in good faith and with every
effort to ensure fairness and accuracy.
Penguin Wealth Planners Ltd have attempted to ensure the information is accurate at the time of
publication but cannot guarantee any part of the information as being accurate.
Readers should not rely on the information in this document or anything related to this document
to make any decisions about their finances or their Pension funds.
Readers should only make decisions about their finances or Pension funds having first taken
appropriate regulated advice.
Decisions about such matters will always be circumstantial and should be based on the reader’s own
requirements, risk position and long-term goals.
Penguin is a trading name of Penguin Wealth Planners Ltd. Penguin Wealth Planners Ltd are
authorised and regulated by the Financial Conduct Authority (FCA no. 830057).
The Pension Review Service
We offer a Pension Review Service, to anyone who has money in Pension funds.
If you can provide us with the details of the funds you have, we will be able to use the software
available to us, to analyse these funds and provide you with an overview of how they are doing and
how they would be classified against our ranking methods.
We can then provide you with a report and, if required, regulated advice to help you make decisions
around these matters.
12
www.penguinwealth.com 02920 450 143 Info@penguinwealth.comAbout Penguin Wealth Planners Ltd
We are a Cardiff-based Financial Planning firm formed in 2010 by a group of Financial Planners who
share the same vision and love for what we do. Our processes, support team and the accreditation we
have achieved all reflect our principles and prove that we are best placed to help you live the life you
deserve with peace of mind.
Your planning is only truly complete when you have ensured that the unexpected is catered for. We
help prepare you for all eventualities by protecting you from the curveballs life can throw at you and
keeping you on track to fulfil your goals and dreams, no matter what happens.
Penguin is a CISI Accredited Firm. This signifies that we “demonstrate the highest professional
standards of Financial Planning service and advice”, “our clients are at the heart of our business”, and
that we “ensure our staff members acquire and retain the necessary knowledge and skills to deliver
the highest quality advice”.
“Thank you for your hard work in helping us plan for our financial future. Your efforts are greatly
appreciated and are also helping our mental wellbeing.”
– Gareth and Sylvia Davies
“We have been advised by the Penguin Team for 20 years now. In some ways that says it all!
Sound decisions are made by a team we fully trust and who are straightforward and honest to
deal with”
– Peter and Sally Thompson
“I've been involved with the Penguin team since the company was founded and over the
years I can only say how pleased I've been with their professional approach and knowledge
base .”
- Keith S
Tel: 02920 450 143 | E: info@penguinwealth.com | W: www.penguinwealth.com
Penguin House, Brigantine Place, Cardiff, CF10 4LN
13
www.penguinwealth.com 02920 450 143 Info@penguinwealth.com14 www.penguinwealth.com 02920 450 143 Info@penguinwealth.com
Appendix

The 2016 list of poor performers:
The list below summarises the 34 funds we classified as poor in 2016 and alongside in red, is how they
are classified in 2020. If there is nothing in red, this is because we have re-classified them as Passive
or Index Funds and as explained in the earlier section, we no longer rank these, for the reasons
explained.

Aviva Japan/Japanese                                              £1.6 Billion Average

Aviva UK/UK Equity                                                £8.7 Billion Average

Baillie Gifford Diversified Growth                                £4.4 Billion Good

BlackRock Aquila Connect UK Equity                                £4.2 Billion Average

BlackRock Aquila Life Pacific Rim Equity Index                    £3.9 Billion

BlackRock Aquila Life European Equity Index                       £9.2 Billion

BlackRock Aquila Life UK Equity Index                              £23.3 Billion

Friends Life L BlackRock (50:50) Global Equity Index (Aquila C)   £1.9 Billion

FL (Friends Life) BlackRock Long Term (Aquila C)                  £1.0 Billion

Friends Life BlackRock UK Equity Index                            £1.1 Billion

Friends Life UK Equity                                            £1.7 Billion Average

HSBC Balanced                                                     £1.3 Billion Poor

L&G UK Equity Index                                               £2.4 Billion Poor

Lloyds TSB Managed                                                £3.8 Billion Poor

Met Life Managed Wealth Portfolio Min                             £1.2 Billion Poor

M&G PP Long Dated Corporate Bond                                  £1.2 Billion Good

NPI Managed                                                       £1.2 Billion Average

RLP (Royal London) BlackRock Aquila Global Blend                  £1.2 Billion Poor

RLP (Royal London) Global Managed                                 £6.3 Billion Poor

Scottish Equitable BlackRock Aquila 50/50 Global Equity           £1.2 Billion

Scottish Equitable Balanced Passive                               £7.2 Billion

Scottish Equitable European                                       £1.2 Billion Average

                                                 15
 www.penguinwealth.com                      02920 450 143              Info@penguinwealth.com
Scottish Equitable Global £1.2 Billion Average
Scottish Equitable North American £1.4 Billion Average
Scottish Equitable Universal Balanced Collection £9.5 Billion Average
Scottish Equitable UK Equity £3.3 Billion Average
SJP Global Equity £2.5 Billion Poor
SW (Scottish Widows) SSgA 50:50 Global Equity £1.1 Billion
Scottish Widows Consensus £2.4 Billion Poor
Scottish Widows Mixed £3.5 Billion Average
Standard Life Annuity Purchase £1.0 Billion Poor
Standard Life Long Corporate Bond £1.2 Billion Average
Standard Life UK Equity £2.1 Billion Poor
Zurich Equity 3/4 £1.1 Billion Average
The 2020 list of poor performers:
Abbey Equity Pension £1.0 Billion (February 2016)
Abbey Managed Pension £2.1 Billion (February 2016)
Aviva Managed LMP £5.3 Billion (September 2013)
Aviva Managed LMP/FPP £1.6 Billion (May 2020)
Aviva Diversified Assets 2 £2.7 Billion (May 2020)
Aviva European CGU £3.7 Billion (May 2020)
Aviva Fixed Interest GA S1 £2.7 Billion (May 2020)
Aviva Growth Managed Pn £21.7 Billion (May 2020)
Aviva Japanese £1.4 Billion (May 2020)
Aviva Mixed Investment (0-35% Shares) £2.0 Billion (May 2020)
16
www.penguinwealth.com 02920 450 143 Info@penguinwealth.comAviva Mixed Investments (20-60% Shares) £1.7 Billion (May 2020)
Aviva ULP Ordinary Share £7.5 Billion (May 2020)
Aviva Your Pension European CGU £3.7 Billion (May 2020)
BlackRock Aquila Life Pacific Rim Equity Index £1.8 Billion (April 2020)
CanLife Invesco High Income £3.3 Billion (April 2020)
Clerical Medical Balanced £2.4 Billion (April 2020)
Fidelity Diversified Markets £1.6 Billion (December 2019)
Formerly Lloyds TSB Managed £3.4 Billion (April 2020)
Invesco Global Targeted Returns Pn 7 £6.3 Billion (April 2020)
Pru Managed Pn £1.5 Billion (June 2020)
RLP Global Managed Pn £19.4 Billion (February 2020)
RLP Managed £2.3 Billion (February 2020)
RLP Medium (10yr) Index Linked £1.3 Billion (February 2020)
Scottish Widows Cash Pension £1.2 Billion (April 2020)
Scottish Widows Consensus £2.4 Billion (April 2020)
Scottish Widows Mixed Pension Series 2 £3.2 Billion (April 2020)
SJP Global Equity £5.4 Billion (March 2020)
SJP Global Managed £2.5 Billion (March 2020)
SJP Managed Growth £4.0 Billion (March 2020)
SJP Money Market £1.3 Billion (March 2020)
SJP Multi Asset £3.2 Billion (March 2020)
SJP North American £1.0 Billion (March 2020)
SJP Strategic Income £2.6 Billion (March 2020)
SJP Strategic Managed £3.8 Billion (March 2020)
SSGA MPF Fundamental Index Global Equity £1.2 Billion (March 2020)
Stan Life ASI Myfolio Managed II £1.1 Billion (May 2020)
Stan Life ASI Myfolio Managed III £2.6 Billion (May 2020)
Stan Life Global Bond £3.7 Billion (March 2020)
Stan Life Global Equity 50:50 £1.0 Billion (March 2020)
Stan Life UK Equity £1.4 Billion (March 2020)
Stan Life UK Gilt £1.6 Billion (March 2020)
Zurich Equity Capital ¾ Ap £1.1 Billion (February 2020)
*Fund is less than 5 years old thus cannot score the fund over a 5-year period. However, based on points
available to them they would fall into this respective group.
17
www.penguinwealth.com 02920 450 143 Info@penguinwealth.comYou can also read