Opportunity Day 2018 Results - 1 March 2019 Your Ultimate Solution Partner in Utilities & Power with Environmental Care - The Stock Exchange of ...
←
→
Page content transcription
If your browser does not render page correctly, please read the page content below
Opportunity Day
                                                                        2018 Results

                                                                        1 March 2019

Your Ultimate Solution Partner in Utilities & Power with Environmental Care
Disclaimer
The information contained in this presentation is for information purposes only and does not constitute an offer or invitation to sell or the solicitation of an offer or
invitation to purchase or subscribe for share in WHA Utilities & Power Public Company Limited (“WHAUP” and shares WHAUP, “shares”) in any jurisdiction nor
should it or any part of it form the basis of, or be relied upon in any connection with, any contract or commitment whatsoever.

In addition, this presentation contains projections and forward-looking statements that reflect the Company's current views with respect to future events and financial
performance. These views are based on a number of estimates and current assumptions which are subject to business, economic and competitive uncertainties
and contingencies as well as various risks and these may change over time and in many cases are outside the control of the Company and its directors. You are
cautioned not to place undue reliance on these forward looking statements, which are based on the current view of the management of the Company on future
events. No assurance can be given that future events will occur, that projections will be achieved, or that the Company's assumptions are correct. The Company
does not assume any responsibility to amend, modify or revise any forward-looking statements, on the basis of any subsequent developments, information or
events, or otherwise. These statements can be recognized by the use of words such as “expects,” “plans,” “will,” “estimates,” “projects,” or words of similar meaning.
Such forward-looking statements are not guarantees of future performance and actual results may differ from those forecast and projected or in the forward-looking
statements as a result of various factors and assumptions.

                                                                                                                                                                      2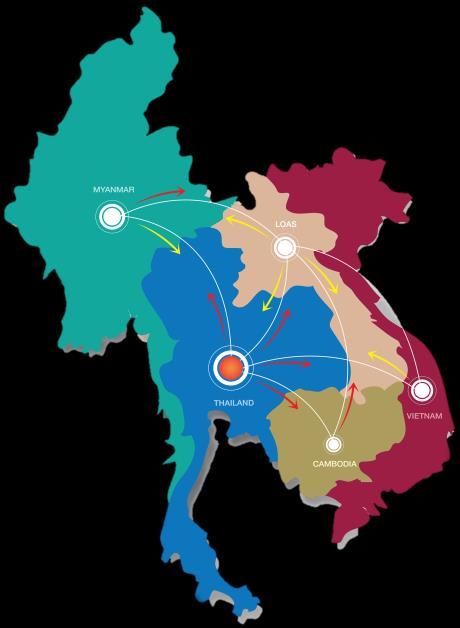
Agenda

   I.         Company Profile

        II.    Utilities Business

              III. Power Business

                IV.    Operating Performance

                      V.    Performance Highlight

                           VI. Financial Information

                             VII. Outlook 2019B

                                VIII   Appendix

                                                       3
I. Company Profile
Vision & Mission

                     VISION

                            “To be Asia's leader in Utilities and Power providing total solutions to
                            partners with good corporate governance as well as environmentally
                            and socially friendly operations”

                     MISSION
                     • To develop world class utilities and power solutions fitting customer's needs

                     • To vertically integrate solutions in utilities and power businesses and expand
                       market segment in Thailand and CLMV (Asia)

                     • To continuously develop Human Resources competencies

                     • To nurture an innovative culture in the organization

                     • To add value to communities and the environment with good corporate
                       governance and sustainable development strategies

                                                                                                       4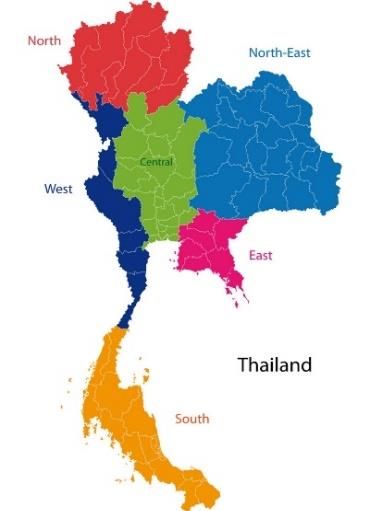
I. Company Profile
WHAUP is the Flagship Company in Utilities and Power Business of WHA Group
#1 Logistics developers #1 Industrial Estate Exclusive utilities provider To be one-stop service
Developer in the industrial estates for Data Center developer
Built-to-Suit (BTSW): and provider by way of
World-class standard Existing 9 operating and 3 with high margin products
warehouses and factories developing IEs in and steady growth business collaboration
with reputable partners
Built-to-Suit (BTSF):
strategic cluster to serve Active power investor with
Premium quality factories
key sectors in Thailand - strategic partnership with Be part of the
total of 48,624 rais reputable partners. Government Initiative to
for tenants with specific
Net sellable area approx. promote digital economy
requirements 552 Operational Equity
11,235 rais consisting of MW* and growing to 570
Warehouse Farm: 7,475 rais of operating IE
Combination of Built-to- Equity MW by 2019 from
and 3,759 rais developing under construction and in
Suit and Ready-Built IE
Projects at the same site pipeline.
Ready-Built factory and
Built-to-Own warehouse in IEs and
(BTO):Warehouse or logistic park
factory customized to
client’s special needs Potential geographical
then transfer the asset to expansion in cross-border
the client provinces and overseas
investment
Built-to-Suit Office:
Offices that are
customized to customers’
specific requirements i.e.
Multi-purpose offices
Remark * As of February 2019
5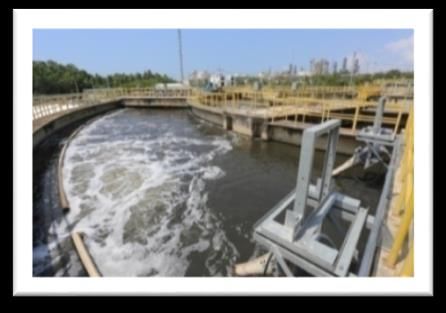
I. Company Profile
Business Overview
                         Utilities Business                                                Power Business

Sole provider of utilities to manufacturers/ factories in leading   Active power investor with strategic partnership with leading Thai
industrial estates with a concrete plan to capture increasing       and international power companies
demand from heavy users and expand outside i.e. other IEs, non-IE
area and international

                                                                                                                           521
                                                                                                                        Installed
                                                                                                                      Equity MW
                   HE
 Raw Water           Industrial Water
                   SIE                                                Conventional

                                                  105
                   3
                     - Process water
                     - Clarified water                                                               486
                                                  Million M3                                       Installed
                                                                                                 Equity MW

                                                    2018
 Wastewater                                                           Renewable
 Treatment

                                    100
                                    Million M3

 Reclaimed Water                         2017                         Natural Gas                    2017                 2018

                                                                                                                                         6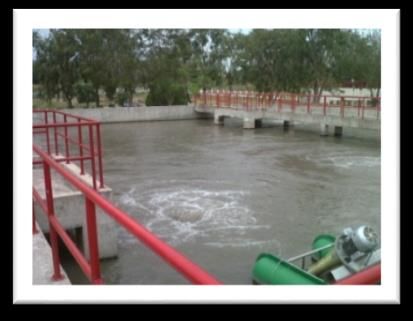
Agenda

   I.         Company Profile

        II.    Utilities Business

              III. Power Business

                IV.    Operating Performance

                      V.    Performance Highlight

                           VI. Financial Information

                             VII. Outlook 2019B

                                VIII   Appendix

                                                       7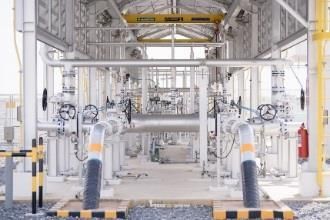
II. Utilities Business
Utilities Business Overview
One of the largest industrial utilities providers in Thailand
Excellent track record in providing comprehensive utilities service
Exclusive right for all existing and future WHA ID’s Estates in Thailand and CLMV
Strong base of industrial users in various sectors and opportunity to capture non-industrial users
Supplier Water Production Product/ Service Provided
1 Raw Water
WHAUP secures 80% of raw water Supply and distributes raw water to
from EASTW for its industrial water factories in the industrial estates.
production via IEs Main customers: Power Industry
1 Industrial 2 Industrial Water
WHAUP Users
3 WHAUP
2 Produces and distributes process
and clarified water to supply
industrial users in the industrial
Royal Irrigation
700 International and Thai Corporate Customers estates
Main customers : Petrochemical
Department (“RID”) Industry
3 Wastewater Management
Collect and provide wastewater
treatment services to factories in the
industrial estates
IE’s Reservoir
Main customers : Petrochemical,
Automotive, and Power Industry
Currently supply via
IEs of WHA ID
8
II. Utilities Business
Assets Location
    WHAUP’s exclusive rights to operate and provide utilities services to customers cover all WHA ID’s Industrial Estates.
           Currently, WHAUP provides utilities services to 9 operating IEs plus 3 developing IEs in the future.

                                                                 1   WHA Chonburi Industrial Estate 1
                                                                     (WHA CIE 1)
                                                                 2   WHA Chonburi Industrial Estate 2
                                                                     (WHA CIE 2)

                                                                 3   WHA Eastern Seaboard Industrial Estate 1
                                                                     (WHA ESIE 1)

                                                                 4   Easter Seaboard Industrial Estate (ESIE)

                                                                 5   WHA Eastern Industrial Estate (Map Ta
                                                                     Phut) (WHA EIE)
                                                                 6   WHA Saraburi Industrial Land (WHA SIL)

                                                                 7   WHA Rayong Industrial Land (WHA RIL)

                                                                 8   WHA Eastern Seaboard Industrial Estate 2
                                                                     (WHA ESIE2)
                                                                 9   WHA Eastern Seaboard Industrial Estate 4
                                                                     (WHA ESIE4)

                                                                                                                             9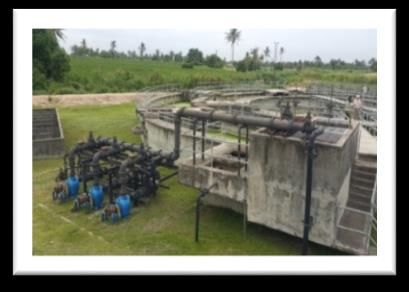
II. Utilities Business
Industry Overview – Water Demand
Forecasted Demand for Water Proportion of Water Demand
• Demand for water in Thailand for the next 20 years increases at the rate of
0.5% CAGR 93%
• Agriculture sector reduce its proportion from 90% to 85% while municipal and 8% Agricultural
industrial proportion strongly grow to reach 5% and 4% respectively North 25% 5%
Northeastern 6% Industrial
2017 2036F
EEC 2%
131,440 million m3 144,062 million m3 Household
9%
West
11% • In 2014, Easternth part of Thailand total water
Agricultural Agricultural usage ranked 4 with water demand of nearly
19% East
90% 85% 10,000 million m3
Central • However, when comparing water demand to
total area, eastern part ranked 2nd after
28% Southern part of Thailand
South • Emphasizing on EEC area, proportion of water
Ecosystem Ecosystem demand from Industrial sector ranked 1st
Industrial Industrial
5% 4% comparing to other part of Thailand
2% 4%
Municipal Service Municipal Service
2% 1% 5% 2% Industrial Water Consumption
20,000
• Food industry demand for water the most at 12 m3 per rai per day
million m3/year
• Industry that demand less water is wood industry with 3 m3 per rai per day
15,000
7,250 m3/Rai/Day
10,000 12
2,797
5,000 2,009 8 8
1,937 7
5,506 6
2,877 5 5
4 4
0 3
2017 2036F
Industrial Service Municipal
Paper
Unmetal
Wood
Other
Textile
Metal
Outdoor
Chemical
Food
Accessory
Municipal Service Industrial
CAGR 7.0% CAGR 2.0% CAGR 4.0%
10II. Utilities Business
Opportunities in EEC
Forecasted Demand and Supply for Industrial Water
1 Raising the efficiency of 7 old reservoirs in EEC which will increase water storage level from 770 million m 3 to 872 million m3
2 Establish the diversion channel from Klong Panthong to Bang Pra Reservoir diverted water for 75 million m3
1000 3 Develop 4 new reservoirs around Klong Wang Ta Nod accounted for 100 million m3
900 4 Search for new reserve water which raise will add 77 million m 3 to water supply
800
781
700
Water Volume (million m 3)
704
600 561
604
476
500 529
400 427
315
300
200
100
0
2017 2018 2019 2020 2021 2022 2023 2024 2025 2026 2027 2028 2029 2030 2031 2032 2033 2034 2035 2036
Source: Irrigation Water Management (Prachachat news 15/02/2018) Forecast Demand Forecast Supply
21 Promotional Zones Out Of 31 Industrial Estates In EEC Including 9 from WHA Group
TFD2 Declared as EEC Industrial Promotional Zone for Targeted Industries
21 8 Area Declared 86,755 Rai
Zones
zones
Area to Accommodate New Investment 28,666 Rai
WHA CIE 1-2
Estimated investment THB 1.31 trillion
1 Zones
WHA ESIE 2-3
EEC Industrial Promotional Zone Basic Package EEC Package
Yamato
Amata 1-2 12 Zones WHA ESIE1,4 Target Industries* 10 yrs 12 yrs
Pinthong 1-5 WHA EIE 5 – 8 yrs Basic + 50% 5 yrs
ESIE Other Industries 10 yrs 12 yrs
WHA RY36 5 – 8 yrs Basic + 50% 3 yrs
8 Zones Smart Park
Amata City Other Estates in EEC 10 yrs 11 yrs
CP 5 – 8 yrs Basic + 50% 3 yrs
11II. Utilities Business
Business Strategies
Current Positioning 5Y Aspiration
Industrial Estate
Products (Raw Water, Developing
Industrial Water and Integrated Solutions Municipal Water CLMV Markets
Central Wastewater to Industrial Users Supply
Treatment)
Thailand’s leader in Domestic: Integrated solutions to industrial market,
industrial water
businesses provides expansion to other market segments with world-class
105 million m3 operation and services
Industrial Estate
products to customers International: Expand to strategic regional countries by
in WHA Group in 2018.
leveraging on WHA Group brand, expertise and
customer base
12Agenda
I. Company Profile
II. Utilities Business
III. Power Business
IV. Operating Performance
V. Performance Highlight
VI. Financial Information
VII. Outlook 2019B
VIII Appendix
13III. Power Business
Growing Portfolio
Continuing Growth from Projects Under Construction and Projects in Pipeline
Over 200 MW of solar opportunities
from over 2 million sqm logistics roof areas
under WHA/WHA Management
570 MW
521 MW
486 MW
352 MW
2016 2017 2018 2019B
14III. Power Business
Well-balanced and High Stability Portfolio
Conventional Power: 547 Equity MW Secured Highly reliable off-taker (EGAT) Long-maturity Portfolio
By Type of Power Plant By Type of Sourcing
Industrial
52% Users, 8%
Analysis
IPP Coal 43%
PortfolioAnalysis
SPP 48% Gas 53% Maturity < 20
Years, 27%
Hydro 4%
Maturity ≥ 20
Portfolio
Renewable Power: 22 Equity MW Secured Years, 100%
EGAT/ PEA/ Maturity ≥ 20
MEA, 92% Years, 73%
By Type of Power Plant By Type of Sourcing
VSPP 100% Solar 87%
Client Profile 2018 Additional Incoming
WTE 13% Project in 2019
Installed WHAUP
Project Name Type JV Partner Location Equity MW COD
Capacities (MW) Portion
Operating Phase
Gheco-I IPP Coal Glow Map Ta Phut IE 660 35.00% 231 Q3’12
Glow IPP IPP Gas Combined Cycle Glow WHA CIE 1 713 5.00% 36 Jan-03
Houay Ho Power IPP Hydro Glow Lao PDR 152 12.75% 19 Sep-99
GJP NLL SPP Gas Co-gen Gulf JP WHA RIL 123 25.01% 31 May-13
WHA LP 1, WHA CIE 1,
Portfolio Summary
Gulf Solar VSPP Solar Gulf 0.6 25.01% 0.2 Jun-14 – Jan-15
WHA ESIE 1, ESIE
WHA Gunkul VSPP Solar Gunkul Bangna and Ayudthaya 3.3 74.99% 2.5 Apr – Jul-14
BGWHA-1 SPP Gas Co-gen B Grimm WHA CIE 1 130 25.01% 33 Nov-16
GVTP SPP Gas Co-gen Gulf MP ESIE 137 25.01% 34 May-17
GTS1 SPP Gas Co-gen Gulf MP ESIE 134 25.01% 34 Jul-17
GTS2 SPP Gas Co-gen Gulf MP ESIE 134 25.01% 34 Sep-17
GTS3 SPP Gas Co-gen Gulf MP WHA ESIE 1 130 25.01% 32 Nov-17
GTS4 SPP Gas Co-gen Gulf MP WHA ESIE 1 130 25.01% 32 Jan-18
GNLL2 SPP Gas Co-gen Gulf MP WHA RIL 127 25.01% 32 Jan-19
Solar Rooftop Projects Private PPA Solar 100% Owned IEs/ Logistic Center 1.8 100.0% 1.8 May’18-Feb’19
Total 2,576 552
Construction Phase
Solar Rooftop Projects Private PPA Solar 100% Owned IEs/ Logistic Center 14.6 100.0% 14.6 Q1-Q3’19
CCE VSPP Waste-to-energy Glow& Suez WHA CIE 1 8.6 33.33% 2.9 Q4’19
Total 23 17
15III. Power Business
Industry Overview
Increasing Power Generation with CAGR of 3.2% during 2007-2017 with Natural Gas as the main fuel source
Power Generation by Fuel Sources Proportion of Fuel Sources in 1H2018
TWh Hydro Oil & Diesel
250 CAGR 3.7% 0.1%
Imported
192 200 201 Oil & Diesel -19.8% 12.1%
200 179 181 186
165 164
147 148 148 Hydro -5.2%
150 Renewable
101 Imported 18.5% 8.8%
100 ~101 TWh
Renewable 19.9%
Natural Gas
50 56.8%
Coal 1.5% Coal
0 Natural Gas 18.4%
1H18 2.1%
2007
2008
2009
2010
2011
2012
2013
2014
2015
2016
2017
• Total country power generation in the first half of 2018 is
The main fuel source of the power generation in Thailand is 101,482 GWh with natural gas accounted for 57% and coal
natural gas which accounted for more than 60% however, the fired of 18% of total power generation.
portion of power generation using natural gas are decreased in the
past 3 years
The decrease of power generation using natural gas has been Key Challenges of Power Industry:
replaced by the use of renewable and import • Natural gas has become the dominant fuel for electricity
Thailand depends heavily on natural gas could lead to various generation for decades because of low capital intensive and
problems: higher efficiency of gas-based power plant technology
o The reserves and production of natural gas are depleting
o The state-owned oil & gas company imports gas from o The overuse of natural gas has led to a declining supply which
Myanmar and plans to open a second terminal near causes Thailand to import LNG for power generation
Rayong to add 7.5m tons/year, totaling of 18m tons/year by • Policy uncertainty and discontinuity toward Solar PV
2022
Power generating by renewable is increasing with CAGR of 20% • Constraints related to the grid infrastructure is a hindrance for
from 2007 to 2017 because of EPC cost of renewable plants are renewable power producers to sell power back to grid
cheaper and government’s promotional measures on renewable • Electricity shortage in Southern part of Thailand
fuel sources
Source: PDP 2015, DBS (Thailand power Outlook), Energy Transition in Thailand
16III. Power Business
Business Strategies
“Developer” in Power and Energy Businesses
Conventional - IPP : Glow IPP, Gheco-One , Houay Ho Hydropower in Lao PDR
Power - SPP : 8 SPPs in operation
- Solar Rooftop : 2.6 MW sale to grid & 1.8 MW private-sale.
Further opportunities from over 6 million sqm IE roof areas and 2 million sqm
Renewable logistics roof areas
Power - WTE : 8.6 MW CCE Project SCOD in Q4’2019. Exploring municipal-waste-to-
energy opportunities
Natural Gas - New projects in IEs : WHA ESIE 2 COD in Dec’18 and WHA ESIE4 SCOD
Distribution in Q2’2019
Other Targets
- Exploring opportunity in Energy Management Services such as Cogen
Energy
Services plant, Boiler, Chiller, Energy Storage for IE customers
17Agenda
I. Company Profile
II. Utilities Business
III. Power Business
IV. Operating Performance
V. Performance Highlight
VI. Financial Information
VII. Outlook 2019B
VIII Appendix
18IV. Operating Performance
Utilities – Operating Performance
Utilities Portfolio Growth – Sale & Management Volume
Million m3/ year
WWT +2% YoY
120 100 105
RW +2% YoY
100 82
35 IW +7% YoY
80 34
60 17 17
31 32 34 13
40
43 49 53
20 31 32 34
0
2013 2014 2015 2016 2017 2018
Industrial Water Raw Water Wastewater
Potential Demand from New Power Plants On Schedule
Water Consumption 2017 2018 2019E 2020E 2021E
SPP COD 3,500 – 4,000 m3/day GVTP (16 May 17) Gulf TS4 (Jan 18) GNLL2 (Jan 19) TBA
Gulf TS1 (8 Jul 17)
Gulf TS2 (Sep 17)
Gulf TS3 (Nov 17)
IPP COD 40,000 m3 / day Block 1 Block 2
CCE (Q4’19)
Waste to Energy 1,000 m3 / day
+13,000 +3,000
Petrochemical
19IV. Operating Performance
Power Business - IPP Group
2017 (A) 2017 (A)
Energy Dispatch 2018 (A)
Availability 2018 (A)
GWh % AF
100.0% 99.2%
5,503 95.6%
5,021 86.4%
396 417
34 38
Gheco-One HHPC Glow IPP Gheco-One Glow IPP
20IV. Operating Performance
Power Business - SPP Group
2017 (A) 2017 (A)
Energy Dispatch 2018 (A) Availability 2018 (A)
GWh
% AF
890
864 863 874 856 98.4% 97.9% 97.5% 97.8% 97.4% 98.0% 98.0%
830 828 850
810 98.9% 99.6% 98.2%
95.6% 98.4% 95.2%
498
412
280
127
GNLL GVTP GTS1 GTS2 GTS3 GTS4 BPWHA-1 GNLL GVTP GTS1 GTS2 GTS3 GTS4 BPWHA-1
21IV. Operating Performance
Power Business - Solar Performance
2017 (A)
2018 (A)
Energy Dispatch
GWh
1.35 1.28
1.19 1.14 1.19 1.14
0.89 0.85
WHA GunKul 1 WHA GunKul 3 WHA GunKul 6 WHA GunKul 17
Total Energy Dispatch for 2017 = 4.62 GWh
2018 = 4.41 GWh
22Agenda
I. Company Profile
II. Utilities Business
III. Power Business
IV. Operating Performance
V. Performance Highlight
VI. Financial Information
VII. Outlook 2019B
VIII Appendix
23V. Performance Highlight
Financial Highlight 2018
2018 YoY Remark
Revenue from Sales and Services 1,708.3 4.6%
1) Higher Sales Volume mainly from full year
operation after COD of 5 SPPs, existing
Share of Profit and Dividend Income 2,122.4 6.4% and new IEs customers
2) Gheco-One higher energy dispatch versus
planed maintenance in 2017
3) Dividend income from Glow IPP of Baht
75.0 million in 2018 versus Baht 59.3
miliion in 2017
4) Lower Finance Cost from loan repayment
EBITDA 2,854.8 8.2% in April’17 and issued debentures to
refinance existing bank loan in Aug’17 and
Jun’18
5) Lower administrative Expenses from
accounting adjusted of doubtful debt in
1Q’18
Net Profit Attribute to Owners of the Parents 2,251.9 13.7%
Foreign Exchange Gain and One-Time Loss
Normalized Net Profit Attribute to Owners of items totaling of Baht 15.9 million in 2018 VS
the Parents
2,267.8 61.2% Foreign Exchange Gain Baht 574.3 million in
2017
24Agenda
I. Company Profile
II. Utilities Business
III. Power Business
IV. Operating Performance
V. Performance Highlight
VI. Financial Information
VII. Outlook 2019B
VIII Appendix
25VI. Financial Information
Consolidated Financial Statement
Revenue and Share of Profit and Dividend Income was recorded at Baht 3,830.7 million
Unit : THB mm
3,830.7
3,629.1
2,122.4
+6.4%
1,995.4
1,633.8 1,708.3 +4.6%
2017 2018
Revenue from Sales and Services Share of Profit and Dividend Income
26VI. Financial Information
Utilities Performance
Revenue from Sales and Services from Utilities Business was recorded at Baht 1,708.3 million.
Revenue from Sales and Services Gross Profit Margin
Units: THB mm
1,708.3
1,633.8
28.6
35.3% 34.4%
63.5 158.3 33.1%
152.1 29.5%
268.9
262.9 27.4%
33.3%
30.4%
25.8% 26.9% 27.9%
1,252.6
1,155.2
2017 2018 2014 2015 2016 2017 2018
/1
Industrial Water Raw Water Wastewater Other Revenue
Gross Profit Margin (%)
Gross Profit Margin (%) (Exclude Other Utilities)
Remark /1 : Other Revenue is consist of excessive charge, management fee and revenue from WHA KM.3 Solar
27VI. Financial Information
Power Performance
Share of Profit and Dividend Income total at Baht 2,122.4 million
Units: THB mm
2,122.4
1,995.4
574.3
2,138.3
1,421.0
-15.9
2017 2018
Normalized Share of Profit & Dividend Income Fx and One-Time Items Gain (Loss)
28VI. Financial Information
Consolidated Performance
Consolidated EBITDA/1 and EBITDA Margin Consolidated Net Profit/2 and Net Profit Margin/3
Unit : THB mm Unit : THB mm
4500.0 100.0%
71.2% 72.9% 3500.0 53.5% 57.5% 60.0%
4000.0 57.6%
73.0%
66.0% 50.0%
3500.0 3000.0 40.0%
44.9%
2,854.8
2,251.9
3000.0 2,639.2 2500.0 20.0%
0.0% 1,980.9
2500.0 2000.0 0.0%
574.3
574.3
2000.0 -50.0%
1500.0 -20.0%
1500.0 2,870.7 2,267.8
-100.0% 1000.0 -40.0%
1000.0 2,064.9
1,406.6
500.0 -60.0%
500.0
-150.0%
0.0 0.0 -80.0%
2017 2018 -15.9 2017 2018 -15.9
-500.0 -200.0% -500.0 -100.0%
Normalized EBITDA EBITDA Margin (%) Normalized Net Profit Net Profit Margin (%)
(THB mm) (THB mm)
Normalized EBITDA FX and One-Time Item Normalized Net Profit
FX and One-Time Item
Margin (%) Gain (Loss) (THB mm) Margin (%)
Gain (Loss) (THB mm)
Remark:
/1Consolidated EBITDA from Utilities Business and Power Business and Other Income.
/2Net Profit Attribute to Owners of the Parent
/3 Net Profit Margin is calculated by dividing the Net Profit Attribute to Owners of the Parent by revenue from Sale and Services and Share of Profit from Investments in Associates and Joint Ventures and Other Income
29VI. Financial Information
Capital Structure and leverage ratio
Statement of Financial Position Debt Maturity Profile
Unit : THB mm Unit : THB mm
23,773 23,773
21,378 21,378
14,049
12,577
4,000
871 736
2,390
7,930 8,988 1,290 1,320
0 0
1 2017 2 3 4 5 2018 6 2018 2019 2020 2021 2022 2023 2024 2025
Bond
Total Assets Interest Bearing Debt
Other Liabilities Total Equity
Financial Ratio
D/E Ratio Net IBD/E Ratio ROE* ROA*
0.70x 0.69x 19.8%
16.9% 10.0%
9.9%
0.58x 0.58x
2017 2018 2017 2018 2017 2018 2017 2018
Note : * Weighted average equity or asset
assets
30Agenda
I. Company Profile
II. Utilities Business
III. Power Business
IV. Operating Performance
V. Performance Highlight
VI. Financial Information
VII. Outlook 2019B
VIII Appendix
31VII. Outlook 2019B
2019 Plan: Utilities Business
Market Product Capture Key Deliverables
Expansion Innovation Vietnam
New WHA IEs Wastewater Reclamation, Opportunity
Non-WHA IEs RO Water,
Demineralized Water, Raw Water, Industrial
Target Sales &
Smart Water Solution, Water, Municipal
Water, Wastewater
Managed Volume
Wastewater Pretreatment
Partner with Leverage IE customer
Industrial Estate
base to offer innovative
Developers to
products
120
provide Utility
Solution
3,650,000 m3/yr Capacity
RECLAMATION Million M3
Located in WHA EIE Non-IE
Sourcing potential M&A Products
opportunities in CLMV,
especially Vietnam 10
million m3
Target STRATEGIC
Growing water 2,190,000 m3/yr Capacity LOCATIONS with growing
populations, industrial users
105
sales volume
DEMINERALIZED WATER and abundant water Million M3 2019B
with new up-
+3 coming
WHA IEs
To serve for a Well-know Power Plant resources
Smart Water Solution 2018A
Integrating IoT on water meter
(First phase in WHA EIE)
32VII. Outlook 2019B
2019 Plan: Power Business
Power Innovative Energy Capture Key Deliverables
Portfolio Solution Vietnam
Growth Smart Grid, Energy Storage Opportunity
System, Captive Gas Power
Renewable Solar
Plant, Floating Solar
Energy in Focus 570
Installed
Explore potential
Solar power Equity MW
projects in
Conventional Renewable Vietnam
+49 Generation
Equity
Generation
521
Megawatt Energy Installed
Storage Equity MW
Utility Grid
Smart grid
Controller Industrial
32 Equity MW Users
from GNLL2 COD
in Jan 2019
Waste-to-Energy Project
Study and prepare for
COD in Q4’2019
future of electricity trend
(EV, ESS) to make
optimal investment
Leverage on WHA customers’
roofs to create track record and
project references for business 2019B
expansion to non-WHA Roofs
2018A
33VII. Outlook 2019B
2019 Plan: Power Business
Enhance Products Offering to Provide Total Solution Energy
Services
Leverage on Industrial Estates’ Customers Base
Focus on Industrial Sales
Strong Partnership with Leading International Energy Players
Natural Gas Distribution Projects
3
WHANGD 3
- Upcoming -
1 WHANGD 2 PARTNERSHIP & COLLABORATIONS
Status : Operating 2 WHANGD 4
Under Construction
(Expected COD Q2’19)
34Agenda
I. Company Profile
II. Utilities Business
III. Power Business
IV. Operating Performance
V. Performance Highlight
VI. Financial Information
VII. Outlook 2019B
VIII Appendix
35Appendix
Shareholders and Management Structure
Shareholding Structure Board of Directors
Foreign Retail, Mr. David Richard Nardone
15% Ms. Jareeporn Jarukornsakul
Institutions,
1% Chairman of Board of Directors Director
Domestic
Institutions,
10%
WHA Group, Mr. Vivat Jiratikarnsakul Mr. Wisate Chungwatana
74% Director
Director and Chief Executive
Officer
Remark /1 WHA Group covers WHA Industrial Development Plc, WHA Ventures Holding, WHA
Industrial Development International (SG) Pte. Ltd., Mr. Somyos Anantaprayoon ,
Miss Jareeporn Jarukornsakul
Mr. Surathian Chakthranont Mr. Weidt Nuchjalearn
Top 10 Shareholders No. of shares %
Director Independent Director
WHA Industrial Development Plc 2,633,999,970 68.9% and Chairman of Audit
Bangkok Life Assurance PCL 72,581,665 1.9% Committee
WHA Ventures Holding Co., Ltd. 71,235,900 1.9%
Thai NVDR Co.,Ltd 63,174,998 1.5%
Mr. Somyos Anantaprayoon 50,240,625 1.3%
WHA Industrial Development International (SG) Pte. Ltd 46,999,800 1.1% Mr. Ekajai Tivutanond Mrs. Punnee Worawuthichongsathit
Miss Jareeporn Jarukornsakul 43,500,010 0.9% Independent Director Independent Director
K Value 16,749,500 0.6% and Audit Committee and Audit Committee
Muang Thai Life Assurance PCL 16,117,900 0.4%
SOUTH EAST ASIA UK (TYPE C) NOMINEES LIMITED 15,499,200 0.4%
Others 794,900,432 21.0%
Total 3,825,000,000 100%
Note: Shareholding Structure and Top 10 Shareholders are reference from WHAUP’s registered list
of shareholders on latest closing date of 31 December 2018 36You can also read