Premier Defensive Growth Fund - FUND UPDATE - FIRST QUARTER 2017 - Premier Asset Management
←
→
Page content transcription
If your browser does not render page correctly, please read the page content below
Q1 2017   FOR PROFESSIONAL ADVISERS ONLY, NOT FOR DISTRIBUTION TO RETAIL CLIENTS

Premier Defensive Growth Fund
FUND UPDATE - FIRST QUARTER 2017
1            PREMIER DEFENSIVE GROWTH FUND Q1 2017

Premier Defensive Growth Fund

Need to know                                                                         Contents
The Fund’s five essential characteristics:                                           2.    Performance summary
Looks to generate a positive return on a rolling 36 month basis                      3.    Stable returns
Focus on absolute returns with significantly less volatility than                    4.    Investment themes
global stock markets*
                                                                                     5.    Performance attribution
Diversified portfolio of global assets and investment strategies
                                                                                     10. Risk scores
Actively managed by specialist investment team
                                                                                     11.   The complete portfolio
Led by experienced fund manager with proven absolute return
fund track record                                                                    13. General investment risks
                                                                                     15. Important information

*As an indication of the typical volatility expectation, the Fund is aiming to achieve its absolute return objective on a rolling 36 month basis with less than
a quarter of the volatility of global equity markets, represented by the volatility of the FTSE All-World Index over the medium term. There is no guarantee
that the Fund’s objective or the performance or volatility targets will be achieved and there is always a risk of loss to original capital.
2
Performance summary
zz The Fund continues to generate a stable return using a multi- PERFORMANCE SINCE LAUNCH TO 31.03.2017
investment strategy approach.
70
zz As the chart shows, the Fund is able to achieve attractive returns
60 Premier Defensive
with low levels of volatility; a welcome alternative to some of the
50 Growth Fund
Total return (%)
largest absolute return funds and bond funds.
FTSE 100 Index
40
zz The defensive nature of the Fund means that it is not expected LIBOR GBP 3m
30
to participate in large market falls nor large market rallies. The Index
20
Fund’s reduced sensitivity to market conditions is key for it to
produce stable returns. Our experience, research and analysis of 10
the underlying investments helps us to model and control risk 0
and regulate the downside risk to the Fund. -10
-20
zz The Fund aims to achieve its absolute return objective with
2010 2012 2014 2016
less than a quarter of the volatility of the FTSE All-World index
over the medium term. Over the 36 months to 31.03.2017, the
volatility of the Fund has been 9.5% of the index.
ANNUALISED VOLATILITY TO 31.03.2017
CUMULATIVE PERFORMANCE TO 31.03.2017 3 years Since launch
Premier Defensive Growth Fund 1.3% 1.6%
3 years 5 years Since launch
FTSE 100 Index 14.5% 14.6%
Premier Defensive Growth Fund 7.5% 19.1% 23.2% FTSE All-World Index 13.7% 13.7%
LIBOR GBP 3m Index 1.6% 2.8% 4.0% The BofA ML Sterling Non-Gilt Index 5.4% 5.0%
Line graph source: FE Analytics, bid to bid, total return, UK sterling basis. Annualised volatility table source: FE Analytics, annualised returns based on weekly
data, net income reinvested, UK sterling basis. All fund data based on class C income shares. Fund launched on 21.12.2010. Past performance is not an
indication of future returns.
Q1 20173 PREMIER DEFENSIVE GROWTH FUND Q1 2017
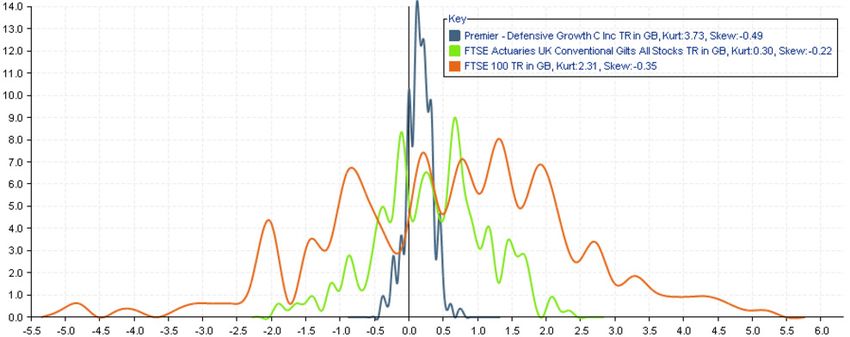
Stable returns
Distribution of weekly returns, since launch
Percent of returns
Premier Defensive Growth Fund
FTSE 100 Index
FTSE UK Conventional Gilts All Stocks Index
Weekly return
Source: FE Analytics, based on total return data. Data from 21.12.2010 to 25.04.2017. Past performance is not a guide to future returns.4
Investment themes
Portfolio breakdown as at 31.03.2017 (figures in brackets as at 31.12.2016)
Discount opportunities 7.7% (5.4%)
This theme aims to exploit a pricing anomaly where the market value
of an investment is perceived to be at a discount to its real value. Many
investment strategies can be used in order to realise the value within a
discount at a reduced level of risk.
Relative valuation 8.8% (6.1%)
This theme focuses on identifying the value in one
or more investments relative to other investments.
Various valuation metrics are used to highlight
opportunities. Defined investments 44.9% (50.9%)
Short term catalyst 14.8% (15.0%) These investments tend to have predictable
return profiles. Typically they are identified by
There are often catalysts within an investment’s
having a fixed life or a fixed entitlement, or both.
life which can lead to a change in the price or
The fixed life allows easier identification of the
value of an investment. This theme focuses on
major risks and the fixed entitlement enables
catalysts that are likely to occur in the short
the calculation of the responsiveness of the
term and therefore will become the driver of the
investment if those risks occur.
performance of an investment.
Trading strategies 23.9% (22.7%)
Within this theme we aim to use a
combination of financial instruments to
tactically express a view or take advantage of
market conditions.
Data as at 31.03.2017. Please note that the asset allocation may be above or below 100% due to rounding.
Q1 20175 PREMIER DEFENSIVE GROWTH FUND Q1 2017
Performance attribution - defined investments Contribution to returns over the
0.62% quarter to 31.03.2017
Highest contributors & detractors to returns over the quarter to 31.03.2017
Zero Dividend Preference
ST Modwen Properties 2.875% Share Portfolio
Convertible Bond Mar 2019 This is a portfolio of zero dividend
Although these convertible preference shares. During the
bonds are unlikely to be driven quarter the portfolio’s largest
significantly by the company’s position, M&G High Income ZDP,
equity as the conversion price is matured.
much higher, the issue was
re-rated on a lower yield given the
very conservative levels of leverage Investec CL S&P500/EuroStoxx50
and short maturity. Incr Cpn Def Autocall Sep 2020
This strategy performed well as
both the FTSE 100 and Euro Stoxx
50 indices rose during the quarter,
whilst volatility fell.
Contribution over the quarter (%)
Source: Northern Trust Fundamentals, data as at 31.03.2017. Past performance is not a guide to future returns. Figures quoted are calculated gross of fees, on an
offer to offer basis, from 31.12.2016 to 31.03.2017. This performance is indicative only, and should not be relied on for the purposes of valuation. Figures refer to the
past and are not a reliable indicator of future results.6
Performance attribution - trading strategies Contribution to returns over the
-0.18% quarter to 31.03.2017
Highest contributors & detractors to returns over the quarter to 31.03.2017
Highbridge Multi-Strategy Morgan Stanley EuroStoxx50
This listed hedge fund’s NAV Dividend Future Dec 19
continued to grow solidly while As sentiment towards European
displaying characteristically low equities improved over the
volatility. Meanwhile, the discount quarter, the outlook for the
to NAV has narrowed as investors dividends those companies
have welcomed the board’s are likely to pay in the future
proactivity in implementing improved. This led to an increase
tenders and the reduction of in the value of the 2019 dividend
legacy positions at reassuring contract.
levels.
iTraxx Xover Payer Spread Jun
2017
This investment was designed
to provide protection should
credit conditions in Europe
worsen. It performed poorly as
credit conditions improved.
Contribution over the quarter (%)
Portfolio hedge (-0.14%): This strategy seeks to mitigate a number of risks that
the Fund faces through a combination of financial instruments. The strategy has
performed negatively this quarter, largely due to strength in risk assets.
Source: Northern Trust Fundamentals, data as at 31.03.2017. Past performance is not a guide to future returns. Figures quoted are calculated gross of fees, on an
offer to offer basis, from 31.12.2016 to 31.03.2017. This performance is indicative only, and should not be relied on for the purposes of valuation. Figures refer to the
past and are not a reliable indicator of future results.
Q1 20177 PREMIER DEFENSIVE GROWTH FUND Q1 2017
Performance attribution - short term catalysts Contribution to returns over the
0.06% quarter to 31.03.2017
Highest contributors & detractors to returns over the quarter to 31.03.2017
Conygar Investment Company
During the quarter, it was
Barclays 7.75% CoCo 2023 announced that Regional REIT
The short term catalyst for these had acquired a portfolio of 31
bonds is their call feature in 2018, properties from Conygar. Regional
which the issuer is economically also assumed Conygar’s bank debt
incentivised to exercise. If it does and zero dividend preference
not, the coupon is likely to fix share (ZDP) obligation, leaving the
higher for the remaining five years company debt-free and able to
to maturity to compensate. focus on maximising value from its
development portfolio. Conygar’s
share price significantly re-rated
on the announcement. The Fund
also benefitted from its holding of
the ZDP, as in order to persuade
the ZDP shareholders to approve
the transaction, 2p was added to
their final entitlement, reflecting a
1% increase in GRY to maturity, in
2 years time.
Contribution over the quarter (%)
Source: Northern Trust Fundamentals, data as at 31.03.2017. Past performance is not a guide to future returns. Figures quoted are calculated gross of fees, on an
offer to offer basis, from 31.12.2016 to 31.03.2017. This performance is indicative only, and should not be relied on for the purposes of valuation. Figures refer to the
past and are not a reliable indicator of future results.8
Performance attribution - relative valuation Contribution to returns over the
0.06% quarter to 31.03.2017
Highest contributors & detractors to returns over the quarter to 31.03.2017
Euro Stoxx 50 Dispersion
strategies
The volatility of the stocks within
the Euro Stoxx 50 realised higher
than the levels implied at the start
of the investment, especially when
compared to the index itself. This
increased dispersion ensured both
investments performed well.
French OAT vs. German Bund
A trading strategy seeking
RBC S&P500 vs US Tech to benefit from a tightening
Outperformance Note 2019 of the spread between the
On the back of positive newsflow ten year French OAT and the
and sentiment US tech stocks corresponding German Bund.
outperformed the S&P 500 index This could occur through a
over the quarter leading to the market friendly election result or
investment being a detractor from intervention from the ECB using
performance. their ability to buy government
bonds to control yields.
Contribution over the quarter (%)
Source: Northern Trust Fundamentals, data as at 31.03.2017. Past performance is not a guide to future returns. Figures quoted are calculated gross of fees, on an
offer to offer basis, from 31.12.2016 to 31.03.2017. This performance is indicative only, and should not be relied on for the purposes of valuation. Figures refer to the
past and are not a reliable indicator of future results.
Q1 20179 PREMIER DEFENSIVE GROWTH FUND Q1 2017
Performance attribution - discount opportunities Contribution to returns over the
0.21% quarter to 31.03.2017
Highest contributors & detractors to returns over the quarter to 31.03.2017
Brunner Investment Trust
This well-established investment
company invests in a portfolio of
global equities. In recent years its
Discount Opportunities Hedge share price has been languishing
This is used to reduce the risk on a wide discount to NAV. With
a tranche of high-cost debt due
of adverse movements in the to mature at the end of the
underlying assets of a number year and strong performance
of investment strategies and from the now sole investment
thereby focusing exposures to the manager, sentiment towards
discount opportunities rather than the company has improved.
market movements. As equity During the quarter the discount
markets moved higher during the narrowed significantly leading to
the share price outperforming the
quarter, the hedge performed mix of indices used to hedge the
negatively but was more than underlying assets.
offset by positive performance of
the positions it was hedging. A
mixture of improving sentiment
and corporate actions led to
narrowing discounts and a positive
contribution to the fund.
Contribution over the quarter (%)
Source: Northern Trust Fundamentals, data as at 31.03.2017. Past performance is not a guide to future returns. Figures quoted are calculated gross of fees, on an
offer to offer basis, from 31.12.2016 to 31.03.2017. This performance is indicative only, and should not be relied on for the purposes of valuation. Figures refer to the
past and are not a reliable indicator of future results.10
Risk scores
zz Each investment strategy is assigned a risk LIQUIDITY RISK AVERAGE: 7.2 CREDIT RISK* AVERAGE: 7.0
score for liquidity, credit, structure and
governance risk, where appropriate. 50 40% 40 35%
35% 35 30%
zz The score ranges from 0-10, 10 being the best. 40
30% 30 25%
30 25% 25
zz The charts to the right show the number (blue 20%
20% 20
bar) and weighting (orange line) of investment 41 20 35 15%
35 15% 15
strategies held in the portfolio with scores 24 10%
10% 10
within each range. 18 17 14
10
5%
0 3 7 11 11 5% 0 0 0 2 7 11 8 4 5
zz The structure risk distribution has changed 0 0% 0 0%11 PREMIER DEFENSIVE GROWTH FUND Q1 2017 The complete portfolio Defined investments (44.9%) Burford Capital PLC 6.5% Bond Aug 2022 (0.7%) Gilt-Collateralised Defensive Autocall Portfolio (11.5%) Barclays FTSE100/EuroStoxx50 Synthetic Zero Jan 2020 (0.6%) Zero Dividend Preference Share Portfolio (5.4%) Barclays FTSE100 Synthetic Zero Nov 2017 (0.5%) RBC FTSE100 Synthetic Zero Jan 2018 (1.9%) Morgan Stanley FTSE100/EuroStoxx50 Synthetic Zero Jan 2020 (0.5%) Natixis EuroStoxx 50/10yr US CMS Synthetic Zero Sep 2017 (1.9%) Helical Bar 4% Convertible Bond Jun 2019 (0.5%) Investec CL S&P500/EuroStoxx50 Incr Cpn Def Autocall Sep 2020 (1.6%) SocGen (UCITS 120) CLN on iTraxx Xover S24 Tranche 25-75 2021 (0.4%) ST Modwen Properties 2.875% Convertible Bond Mar 2019 (1.6%) LEG Immobilien AG 0.5% Convertible Bond Jul 2021 (0.4%) Barclays FTSE100 Incr Cpn Def Autocall Mar 2021 (1.5%) BNP MSCI EM Synthetic Zero Feb 2018 (0.4%) BNP FTSE100 Synthetic Zero Nov 2019 (1.4%) JZ Capital Partners 6% CULS Jul 2021 (0.3%) Credit Suisse FTSE100 Incr Cpn Def Autocall Nov 2020 (1.4%) Aberdeen Asian Smaller Companies 3.5% CULS May 2019 (0.3%) Barclays FTSE100/S&P500 Synthetic Zero Apr 2019 (1.4%) BNP FTSE100/EuroStoxx50 Synthetic Zero Apr 2018 (0.3%) Morgan Stanley S&P500/EuroStoxx50 Incr Cpn Def Autocall Sep 2020 (1.3%) Grand City Properties 0.25% Convertible Bond Mar 2022 (0.3%) Edinburgh Dragon 3.50% CULS Jan 2018 (1.2%) Other (1.0%) British Land 0% Convertible Bond Jun 2020 (1.2%) F&C Global Smaller Companies 3.5% CULS Jul 2019 (0.9%) JP Morgan FTSE100 Incr Cpn Def Autocall Mar 2021 (0.9%) Morgan Stanley FTSE100 Incr Cpn Def Autocall Jun 2021 (0.9%) Real Estate Credit Investment Pref 8% Sep 2017 (0.9%) Defined HSBC S&P500 Incr Cpn Def Autocall Mar 2021 (0.9%) investments Derivative Asset Pool (0.8%) 44.9% S&P 500/10yr US CMS Dual Digital Warrant Nov 2018 (0.8%) Each holding has been categorised to help you identify the types of theme that the Premier Defensive Growth Fund is invested in. The pie chart shows the asset allocation of the Fund through analysis of the underlying securities in each holding. Source: Northern Trust Fundamentals, data as at 31.03.2017. Please note that the asset allocation may be above or below 100% due to rounding.
12

The complete portfolio continued
Trading strategies (23.9%)                                                                                                               Short term catalysts (14.8%)
                                                                                                                                                Money Market (9.6%)
Derivative Asset Pool (6.1%)                                               Discount
 FTSE100 Condor Calendar Ratio Spread Mar 2019 (1.9%)                                                                                    DW Catalyst Fund Ltd (1.8%)
                                                                      opportunities 7.7%
 FTSE100 Put Spread Warrant Apr 2019 (1.7%)                                                                                     Short Duration Bond Portfolio (1.1%)
 S&P 500/10yr US CMS Contingent Put Warrant Dec 2018 (0.9%) Relative                                                           Barclays 7.75% CoCo Apr 2023 (0.5%)
 S&P500 Inverse Range Accrual Feb 2019 (0.8%)              valuation 8.8%                                                       Barclays 14% Perp-2019 Bond (0.5%)
 FTSE100 Put Spread Sep 2019 (0.8%)                                                                             ICG-Longbow Secured UK Property Debt Ltd (0.4%)
Brevan Howard Global GBP Ord (1.3%)                                                                                                                      Other (0.7%)
Natixis FTSE100 Range Accrual Aug 2020 (1.1%)
Brevan Howard Macro GBP Ord (0.9%)                                                                                                          Relative valuation (8.8%)
                                                         Short term
Highbridge Multi-Strategy Fund (0.9%)                                                                                                   US Treasury vs. UK Gilts (1.6%)
                                                        catalyst 14.8%
Boussard & Gavaudan (0.9%)                                                                                                     French OAT vs. German Bund (0.9%)
Merger Arb Strategy Feb 2022 (0.8%)                                                                     RBC US Financials vs. S&P500 Outperf Note Sep 2018 (0.7%)
Morgan Stanley 5.3% FTSE100 Range Accrual Feb 2019 (0.8%)                                    JP Morgan 4 UK REITs vs FTSE EPRA UK Outperf Note Mar 2021 (0.7%)
SocGen FTSE100 8.25% Range Accrual Jan 2020 (0.8%)
                                                                                                            RBC S&P500 vs US Tech Outperf Note Nov 2019 (0.7%)
Sanditon Investment Trust (0.8%)
SocGen (Gilt Backed) FTSE100 8.6% Range Accrual Feb 2020 (0.7%)                                                                  Impact Healthcare REIT PLC (0.6%)
Goldman Sachs S&P500 Inverse Range Accrual Jun 2019 (0.6%)                                                        BNP FTSE100 vs S&P500 Outperf Aug 2017 (0.6%)
Morgan Stanley EuroStoxx50 Dividend Future Jan 2020 (0.6%)          Trading strategies                            EuroStoxx50 Dispersion Strategy Jun 2018 (0.5%)
Credit Suisse S&P500 Twin-Win Straddle Note Mar 2019 (0.6%)               23.9%          Natixis Short US Healthcare Contingent US 10yr CMS Note Jun 2019 (0.5%)
Ruffer Investment Company (0.6%)                                                                                       S&P500 Dispersion Strategy Jun 2018 (0.4%)
BNP FTSE100 Lookback Tracker Mar 2020 (0.6%)                                                                      EuroStoxx50 Dispersion Strategy Dec 2017 (0.4%)
RBC FTSE100 Bear Lockin Nov 2019 (0.6%)                                                        Goldman Sachs FTSE100 VS UK Basket Outperf Note Jul 2019 (0.3%)
Nomura FTSE100 Geared Put Spread Nov 2019 (0.5%)                                                                                            UK Mortgages Ltd (0.3%)
Goldman Sachs Russell2000 Inverse Participation Jun 2018 (0.4%)                                                                                          Other (0.6%)
Capital Gearing Trust Ord (0.4%)
Credit Suisse S&P500 Twin-Win Straddle Note Aug 2018 (0.4%)                                                                            Discount opportunities (7.7%)
German Index-Linked Bund vs. German Bund (0.4%)                                                                                        Private Equity Portfolio (2.5%)
Goldman Sachs Russell2000 Geared Put Spread Sep 2019 (0.4%)
                                                                                                                                JPMorgan Global Convertibles (1.1%)
Natixis Up&In Short Dividend Discount Note May 2017 (0.4%)
Goldman Sachs FTSE100 11.75% Range Accrual Feb 2020 (0.4%)                                                                         Miton Global Opportunities (0.7%)
Goldman Sachs Cap Protected Callable FTSE100 6.5% Sep 2019 (0.3%)                                                               TR Property Investment Trust (0.7%)
Hadrian’s Wall Secured Investments (0.3%)                                                                                           Brunner Investment Trust (0.6%)
Blue Capital Global Reinsurance Fund (0.3%)                                                                                       Edinburgh Investment Trust (0.6%)
Other (0.9%)                                                                                                                                             Other (1.5%)
Source: Northern Trust Fundamentals, data as at 31.03.2017. Please note that the asset allocation may be above or below 100% due to rounding.

                                                                                                                                                             Q1 2017
13 PREMIER DEFENSIVE GROWTH FUND Q1 2017
General investment risks
All types of investment carry a degree of risk and it is important If investors withdraw part of their investment, or take an income
that investors understand and are comfortable with the level of risk greater than the natural income from, or growth of, their
to which their capital could be exposed. investment, there is a risk that they could get back less than
There is the potential for loss of the original investment. The degree originally invested.
of investment risk will depend on the fund’s risk profile. We would Other risks that could impact returns:
typically expect investments that are perceived as lower risk to offer The fund may invest directly into, or be exposed to via its underlying
less potential for loss but with potentially lower returns, whereas we investments, a variety of assets, sectors or regions, all of which
would expect higher risk investments to generate higher returns carry specific risks which could impact returns. The main risks are
albeit with the extra risk of potential loss. However, there are no summarised on this document, with further detail available in the
guarantees as to how a type of asset, sector or region will perform fund’s prospectus.
in the future.
Counterparty
Inflation could erode the value of returns from the investment.
Some investments are reliant on a specific entity, usually a large
There is a risk that the entire market of an asset will fall, affecting bank, to honour its repayment obligations; failure to do so could
the value of assets and the return on an investment. impact returns.
There is no guarantee that the investment objective of the fund will Credit
be achieved.
If the issuer of a security held within the fund is unable to make
Past performance is not a guide to future returns. The price of income payments or repay its debt.
shares and any income from them can go down as well as up and
Currency
there is the possibility of a loss to the original investment.
Where investments are denominated in currencies other than
The levels of taxation and of relief from taxation will depend upon
sterling, changes in exchange rates may cause their value to rise or
individual circumstances.
fall.
There may be a variation in the performance between funds with
Derivatives
similar objectives due to the different assets selected. Performance
of a fund will be affected by the fund manager’s investment This is a financial contract whose value is related to the value of an
decisions. underlying asset or index, often used with the aim to manage risk
or enhance returns, and whilst their use is not necessarily expected
to increase risk within a fund, they could expose the fund to higher
levels of volatility from time to time.14
General investment risks (continued)
Equities Market
As an asset class, equities can experience higher levels of The risk of a fall in price of a particular asset type.
fluctuation than bonds or money market securities. Operational
Fixed interest securities Occasionally processes fail. This is more likely to happen with
This is a type of asset, which includes bonds and gilts, it is more complex products or investments in overseas markets,
particularly affected by movements in interest rates. If the interest such as emerging market countries, which may not have the
rates rise, their price may fall, and vice versa. same level of safekeeping, infrastructure or controls as more
developed markets.
Futures/forward contracts
Structured investments
Typically used for portfolio mangement purposes to help mitigate
interest / inflation risks, but could also expose the fund to volatile These are investments which are usually linked to the
returns from time to time. performance of one or more underlying instruments or assets
such as market prices, rates, indices, currencies and commodities
Inflation
and other financial instruments that may introduce significant
Fixed interest securities, such as bonds, are particularly affected by risk that might affect returns.
trends in interest rates and inflation.
Zero dividend preference shares
Interest rate
Although historically these have proved to be a lower risk
Where the fund has exposure to fixed interest securities such as investment than more traditional shares, serious falls in
bonds, these are particularly affected by trends in interest rates and stockmarket levels can alter their structure and adversly impact
inflation. If interest rates go up, the value of capital may fall, and on their performance.
vice versa.
Legal/Tax
Arising from a change in legal/tax regulations or the application of
them.
Liquidity
During difficult market conditions, some securities or larger
holdings may become more difficult to sell quickly at a desired
price.
Q1 2017IMPORTANT INFORMATION
Risk of investments
Past performance is not a guide to future returns. The price of
shares and any income from them may go down as well as up
and investors may get back less than invested. Movements in
exchange rates may also affect the value of your investment. These
investments are typically intended as long term investments.
The methodology and calculations used by the companies or
Disclaimer: Whilst every effort has been made to ensure the organisations that provide the fund or fund manager awards and
accuracy of the information contained within this document, ratings are not verified by us and we therefore are unable to accept
we regret that we cannot accept responsibility for any omissions responsibility for their accuracy. Ratings and awards should not
or errors. The information given and opinions expressed are be relied upon for making an investment decision, nor are they an
subject to change and should not be interpreted as investment indication, promise or guarantee of future performance of a fund or
advice. Reference to any particular stock does not constitute fund manager.
a recommendation to buy or sell the stock. All data is sourced
Source: FTSE International Limited (“FTSE”) © FTSE 2017. “FTSE®” is
to Premier unless otherwise stated. Persons who do not have
a trade mark of the London Stock Exchange Group companies and
professional experience in matters relating to investments should
is used by FTSE under licence. All rights in the FTSE indices and /
not rely on the content of this document. or FTSE ratings vest in FTSE and/or its licensors. Neither FTSE nor
A free, English language copy of the Fund’s full prospectus, the Key its licensors accept any liability for any errors or omissions in the
Investor Information Document and Supplementary Information FTSE indices and / or FTSE ratings or underlying data. No further
Document, are available on the Premier website, or you can request distribution of FTSE Data is permitted without FTSE’s express
copies by calling us on 01483 306090. For your protection, calls written consent.
may be monitored and recorded for training and quality assurance
Issued by Premier Asset Management. ‘Premier Asset Management’
purposes.
and ‘Premier’ are the marketing names used to describe the
Awards and ratings: The Elite Rating TM system is proprietary to group of companies including Premier Fund Managers Limited
FundCalibre Ltd, but should not be taken as a recommendation. and Premier Portfolio Managers Limited, which are authorised
The Defaqto 2017 Diamond Rating is based on the class B shares and regulated by the Financial Conduct Authority of 25 the North
for the Fund. Defaqto is an independent researcher of financial Colonnade, Canary Wharf, London E14 5HS and are subsidiaries
products and is not authorised to provide financial advice. Premier of Premier Asset Management Group plc. The registered address
Asset Management does not have any influence or control over of all companies is Eastgate Court, High Street, Guildford, GU1
the Defaqto Diamond Ratings or the methodology used to create 3DE. Premier Portfolio Managers Ltd is registered in England no.
them. We are therefore unable to guarantee their accuracy or 01235867. Premier Fund Managers Ltd is registered in England no.
that these will not change in the future, or that Premier Asset 02274227. Premier Asset Management Group plc is registered in
Management will continue to use Defaqto ratings in the future. England no. 06306664. 05051712439
For more information: 0333 456 9033 www.premierfunds.co.ukYou can also read