Accessing ASEAN Markets - Geoff Howie Markets Strategist, Singapore Exchange 11May 2013 - OCBC Securities
←
→
Page content transcription
If your browser does not render page correctly, please read the page content below

Accessing ASEAN Markets
Geoff Howie
Markets Strategist, Singapore Exchange
11May 2013

Investment Choices
Private Investment share of GDP to moderately rise (+1.1%), while private savings
rate to moderately fall (-1.8%) over next 5 years according to annual IMF Country
Report*.
Real Estate or Stocks?
– Over a ten year period ending March 2013, the average annualised return of the Urban
Redevelopment Authority Property Price Index by residential type amounts to +6.4%.
– Over the same timeframe the average annualised return of the STI was +10.4% not
including dividend distributions.
IMF Article IV Report – Singapore July 2012
SGX The Asian Gateway 1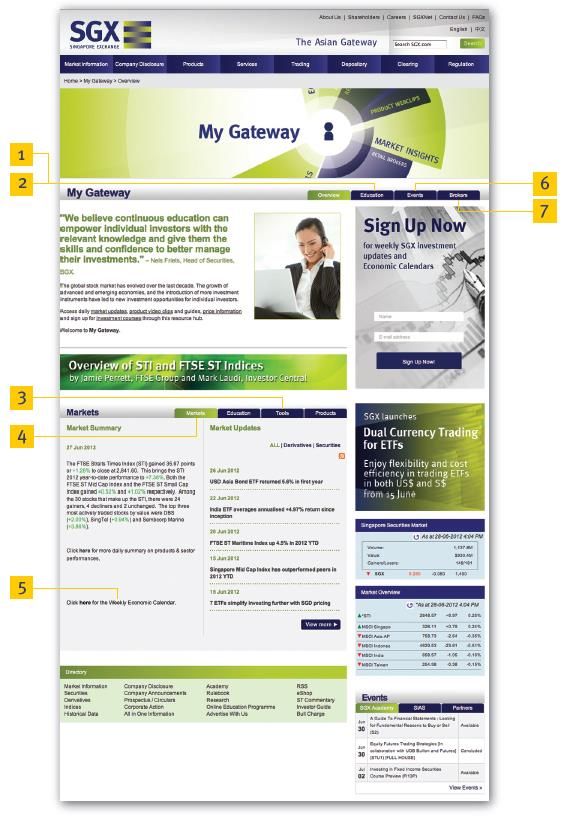
ASEAN Market Highlights
In the April 2013 IMF World Economic Outlook, GDP growth of ASEAN-5 was revised
upwards versus downward revisions for United States, Europe, China and India.
Alongside listing a number of stocks and trusts that generate a large percentage of
their revenue in ASEAN neighboring states, SGX offer a number of ETFs that provide
exposure to the performance of ASEAN equity indices.
While the majority of the ETFs are US Dollar denominated, the majority of the stock
offerings are denominated in the Singapore Dollar (SGD). Furthermore, the strong
external position of reserves at 100% of GDP means Singapore is one of three
countries in the world outside Europe & UK to maintain the highest sovereign rate by
Fitch, S&P and Moody’s.
Coinciding with increased physical trade flows between ASEAN and China, the
largest IPO in Asia in the 2013 YTD has been a REIT which holds assets in Greater
China and is managed by a wholly-owned subsidiary of Mapletree Investments.
SGX The Asian Gateway 2
ASEAN Growth
     Global Context

SGX The Asian Gateway   3
IMF 2013 Global Growth Forecast
+3.3%
International Monetary Fund - World Economic Outlook, April 2013, ‘Hopes, Realities, Risks’
World Output downwardly revised by 0.2%, 2012 Level was 3.2%, Forecast for 2014 is 4.0%.
SGX The Asian Gateway 4
IMF 2013: 1.2% Advanced World Growth Forecast
+1.9% -0.3%
Unemployment Rate 7.5% Unemployment Rate 12.1%
Quantitative Easing Outright Monetary Transactions
US and Europe both downwardly revised by 0.2% in April. US growth was 2.2% in 2012, Europe was -0.6%, forward estimate is 3.0% and
1.1% for US and Europe respectively.
SGX The Asian Gateway 5
IMF 2013: 7.1% forecast for Developing Asia Growth
The 2015 ASEAN Economic
Community (AEC) with the freer
flow of capital objective is the
largest integration effort attempted
+8.0% in the developing world.
+5.7% Combined ASEAN GDP & Average Inflation (1998 – 2016E)
Nominal GDP ($US Trillion)
Average Inflation Rate
30.0 3.5
25.0 3.0
2.5
+5.9%
20.0
2.0
15.0
Estimates
1.5
10.0
1.0
5.0 0.5
0.0 0.0
1998 2000 2002 2004 2006 2008 2010 2012 2014 2016
ASEAN-5 2013 Growth update was revised Upward by 0.3%, China was revised Average Inflation rate, average consumer prices (Annual percent change)
down 0.1% and India was revised downwards by 0.2%. In 2012, China growth was
Nominal GDP (Trillions of U.S. dollars)
7.8%, India was 4.0% and ASEAN-5 was 5.1%.
SGX The Asian Gateway 6Common ASEAN growth drivers
Strong domestic demand and consumer confidence
Investment and Infrastructure requirements
Growing wages and rising middle class
Further subsidization reforms +5.9%
Low Inflation and accommodative Monetary Policy
35
Nominal GDP ($US Trillion)
30
25
20
15
10
5
0
1980 1984 1988 1992 1996 2000 2004 2008 2012 2016
United States Asia and Pacific Europe Developing Asia
SGX The Asian Gateway 7ETF Application SGX The Asian Gateway 8
An original ASEAN asset
CIMB FTSE ASEAN 40 ETF is a non-SIP ETF that adopts a full replication strategy,
that is the fund holds the physical underlying stocks.
Gained 18.2% in 2012, with a five year annualised return of 11.5% as of 28 March
2013.
The ETF was established as an ASEAN government initiative to position ASEAN
markets as a regional asset class in Sep 2006.
This Index represents 40 of the largest stocks listed across Singapore, Malaysia,
Indonesia, Thailand and Philippines.
Of the 40 stocks that are held by the ETF, there are 19 different sectors as
represented as categorised by the ICB.
SGX The Asian Gateway 9Banks-heavy FTSE ASEAN 40 Index
Banks make up the largest Supersector of the FTSE ASEAN 40
Index, accounting for 12 constituents and 41.4% of the Index
weighting as of April 30, 2013.
Singapore's three locally-listed banks - DBS Group Holdings,
Oversea-Chinese Banking Corp. and United Overseas Bank -
accounted for half of Singapore's 11 stock - 36% weighting in
the FTSE ASEAN 40 Index as of April 30.
Num 5Y
YTD Total 1Y Total 5Y p.a. Div
FTSE Index as of 30 April 2013 of 1Y Vol Total Retn
Retn % Retn % Vol Yield
Cons %
FTSE Asian Banks Index 30 5.9 17.3 14.4 11.3 29.9 3.5
FTSE Bursa Malaysia EMAS - Banks 9 4.4 17.1 6.9 90 17.9 3.6
FTSE ST Banks Index 3 11.4 21.6 12.1 30.6 27.9 3.1
FTSE SET Banks Index 10 12.9 30.2 18.9 137.3 29 2.4
SGX The Asian Gateway 1012 of 40 stocks listed on Singapore Exchange
Name Local Exchange ICB Sector Name Mkt Cap (S$m)
Exchange Location
Symbol
SINGAPORE TELECOM LTD Z74 Singapore Mobile Telecommunications 61,861
DBS GROUP HOLDINGS LTD D05 Singapore Banks 42,465
OVERSEA-CHINESE BANKING CORP O39 Singapore Banks 37,148
UNITED OVERSEAS BANK LTD U11 Singapore Banks 34,304
WILMAR INTERNATIONAL LTD F34 Singapore Food Producers 21,172
KEPPEL CORP LTD BN4 Singapore Oil Equip, Services & Distribution 19,149
GENTING SINGAPORE PLC G13 Singapore Travel & Leisure 18,092
JARDINE CYCLE & CARRIAGE LTD C07 Singapore General Retailers 17,163
CAPITALAND LTD C31 Singapore Real Estate Investment & Services 15,582
SINGAPORE TECH ENGINEERING S63 Singapore Aerospace & Defense 13,682
SINGAPORE AIRLINES LTD C6L Singapore Travel & Leisure 12,920
CITY DEVELOPMENTS LTD C09 Singapore Real Estate Investment & Services 10,284
SGX The Asian Gateway 1111 of 40 stocks listed on Bursa Malaysia
Name Local Exchange ICB Sector Name Mkt Cap (S$m)
Exchange Location
Symbol
MALAYAN BANKING BHD 1155 Kuala Lumpur Banks 32,870
AXIATA GROUP BERHAD 6888 Kuala Lumpur Mobile Telecommunications 23,112
PUBLIC BANK BERHAD 1295 Kuala Lumpur Banks 23,102
CIMB GROUP HOLDINGS BHD 1023 Kuala Lumpur Banks 23,070
SIME DARBY BERHAD 4197 Kuala Lumpur General Industrials 22,816
PETRONAS CHEMICALS GROUP BHD 5183 Kuala Lumpur Chemicals 20,851
MAXIS BHD 6012 Kuala Lumpur Mobile Telecommunications 20,393
TENAGA NASIONAL BHD 5347 Kuala Lumpur Electricity 17,664
PETRONAS GAS BHD 6033 Kuala Lumpur Oil & Gas Producers 15,634
IOI CORPORATION BHD 1961 Kuala Lumpur Food Producers 12,814
GENTING MALAYSIA BHD 4715 Kuala Lumpur Travel & Leisure 8,412
SGX The Asian Gateway 12Nine of 40 stocks listed on Indonesia Stock Exchange
Name Local Exchange ICB Sector Name Mkt Cap (S$m)
Exchange Location
Symbol
ASTRA INTERNATIONAL TBK PT ASII Indonesia Automobiles & Parts 36,932
BANK CENTRAL ASIA TBK PT BBCA Indonesia Banks 33,582
TELEKOMUNIKASI INDONESIA PER TLKM Indonesia Fixed Line Telco 29,886
BANK MANDIRI PERSERO TBK PT BMRI Indonesia Banks 29,416
BANK RAKYAT INDONESIA PERSER BBRI Indonesia Banks 28,912
UNILEVER INDONESIA TBK PT UNVR Indonesia Personal Goods 24,604
PERUSAHAAN GAS NEGARA PERSER PGAS Indonesia Gas, Water & Multiutilities 18,890
GUDANG GARAM TBK PT GGRM Indonesia Tobacco 12,482
UNITED TRACTORS TBK PT UNTR Indonesia Industrial Engineering 8,484
SGX The Asian Gateway 13Six of 40 stocks listed on Stock Exchange of Thailand
Name Local Exchange ICB Sector Name Mkt Cap (S$m)
Exchange Location
Symbol
ADVANCED INFO SERVICE PCL ADVANC Bangkok Mobile Telecommunications 33,149
SIAM COMMERCIAL BANK PUB CO SCB Bangkok Banks 26,290
PTT EXPLOR & PROD PUBLIC CO PTTEP Bangkok Oil & Gas Producers 25,697
SIAM CEMENT PUBLIC CO LTD SCC Bangkok Construction & Materials 24,354
KASIKORNBANK PCL KBANK Bangkok Banks 21,088
BANGKOK BANK PUBLIC CO LTD BBL Bangkok Banks 17,696
SGX The Asian Gateway 14Two of 40 stocks listed on Stock Exchange of Thailand
Name Local Exchange ICB Sector Name Mkt Cap (S$m)
Exchange Location
Symbol
SM INVESTMENTS CORP SM Philippines General Retailers 22,320
PHILIPPINE LONG DISTANCE TEL TEL Philippines Mobile Telecommunications 20,357
SGX The Asian Gateway 15Core Satellite Strategy
Portfolio Managers that wish to combine the benefits of a
passive portfolio with their expertise or experience in specific
sectors or market genre can adopt the Core Satellite strategy.
Core Satellite Portfolio Management is comprised of:
– a core portfolio, generally in the form of a passive investment that
provides a comparable performance to an investment benchmark
such as a stock market index or commodity price.
– a satellite portfolio, generally in the form of active investments in
stocks and securities that provide portfolio alpha.
– in this context investment alpha refers to the return of these active
investments, adjusted for their associated trading risks.
SGX The Asian Gateway 16Two Year Raw Beta of FTSE ASEAN 40 Constituents
MAXIS BHD 0.40
ADVANCED INFO SERVICE-NVDR 0.43
TELEKOMUNIKASI INDONESIA PER 0.49
PUBLIC BANK BHD-FOREIGN MKT 0.56
UNILEVER INDONESIA TBK PT 0.57
SINGAPORE TELECOM LTD 0.57
SINGAPORE TECH ENGINEERING 0.65
SIME DARBY BERHAD 0.81
MALAYAN BANKING BHD 0.85
TENAGA NASIONAL BHD 0.86
PETRONAS GAS BHD 0.86
BANK CENTRAL ASIA TBK PT 0.93
SINGAPORE AIRLINES LTD 0.95
OVERSEA-CHINESE BANKING CORP 0.96
PTT EXPLOR & PROD PCL-NVDR 1.00
WILMAR INTERNATIONAL LTD 1.03
AXIATA GROUP BERHAD 1.03
UNITED OVERSEAS BANK LTD 1.04
DBS GROUP HOLDINGS LTD 1.04
DIGI.COM BHD 1.06
IOI CORPORATION BHD 1.11
PERUSAHAAN GAS NEGARA PERSER 1.12
KASIKORNBANK PCL-NVDR 1.15
SIAM CEMENT PCL-NVDR 1.16
PHILIPPINE LONG DISTANCE TEL 1.18
BANGKOK BANK PUBLIC CO-NVDR 1.18
PTT PCL-NVDR 1.23
SIAM COMMERCIAL BANK P-NVDR 1.25
ASTRA INTERNATIONAL TBK PT 1.31
GENTING SINGAPORE PLC 1.32
CIMB GROUP HOLDINGS BHD 1.33
CITY DEVELOPMENTS LTD 1.36
BANK RAKYAT INDONESIA PERSER 1.40
KEPPEL CORP LTD 1.41
MISC BHD 1.42
CAPITALAND LTD 1.52
BANK MANDIRI PERSERO TBK PT 1.52
GENTING BHD 1.53
NOBLE GROUP LTD 1.94
Source: Bloomberg Jan 2013 0.00 0.20 0.40 0.60 0.80 1.00 1.20 1.40 1.60 1.80 2.00
SGX The Asian Gateway 17Most liquid ASEAN ETFs after STI ETF in 2012
The DB x-trackers MSCI Thailand TRN Index ETF (LG7) tracks the MSCI Thailand
TRN Index, appreciated by 34.88% in 2012. The underlying index consist of 21
constituents, with a large weighting to the financials and energy sector of Thailand.
The DB x-trackers FTSE Vietnam ETF (HD9) tracks the FTSE Vietnam TRN Index,
appreciated 20.11% in 2012. The underlying index consists of 23 constituents,
heavily weighted towards the financial sector of Vietnam.
The DB x-trackers MSCI Indonesia TRN Index ETF (KJ) tracks the MSCI TRN
Indonesia Index, appreciated 2.78% in 2012. The underlying index consists of 25
constituents, with a large weighting to the financial and consumer discretionary sector
of Indonesia.
SGX The Asian Gateway 18Core Satellite: SPDR® GOLD SHARES
Together, five countries of Developing Asia, India, China,
Thailand, Vietnam and Indonesia accounted for half of the
world’s gold bar and gold coin investments in 2012.
SPDR® GOLD SHARES trade the same way ordinary stocks
do. SPDR Gold Shares represents an ownership interest in a
Trust, the sole assets of which are gold bullion, and, from time
to time, a portion of cash.
SPDR Gold Shares are intended to lower a large number of
the barriers preventing investors from using gold as an asset
allocation and trading tool.
– Barriers include the logistics of buying, storing and insuring
gold. In addition, lower minimum notional value relative to
other gold markets make SPDR® GOLD SHARES
(exchange code O87), accessible to most investors.
The CIMB FTSE ASEAN 40 ETF is cash-based with a
management fee of 0.65%.
SGX The Asian Gateway 19Education – Portfolio Combinations up to 2 May 2013
2013 2012 2011 2010
ETF Portfolio YTD Total Total Total Total
Return Return Return Return
SPDR STI ETF (1000) +6.86% +21.00% -14.02% +12.46%
CIMB FTSE ASEAN 40 (200 & SGD adj) +9.19% +11.03% -3.57% +18.35%
SPDR Gold Shares ETF (20 & SGD adj) -10.38% -8.60% +21.92% +16.70%
Combined Portfolio Return +0.56% +7.91% +2.32% +15.63%
STI, ASEAN & Gold: 2010 - 2012, annualised return +10.2%
Note this is purely and education example on diversification application with
ETFs. Past performances do not guarantee future results.
SPDR STI ETF & SPDE Gold Shares are SIPs
SGX The Asian Gateway 20Relevant Stocks and Trusts SGX The Asian Gateway 21
Stocks & Trusts that generate ASEAN revenue
SGX Market ASEAN (Excl 12 M Price
Stock/Trust
According to Bloomberg, there are Code Cap S$M SG) GEO Seg Chng % to
Rev % 11 April 13
24 Mainboard stocks listed on SGX PARKSON RETAIL O9E 1,118 100 13.80%
that maintain a market capitalisation TOTAL ACCESS-FRN B2W 9,495 100 20.80%
FIRST RESOURCES EB5 2,954 100 -6.30%
above S$50 million and have BUMITAMA AGRI LT P8Z 1,784 100 34.70%
GALLANT VENTURE 5IG 1,351 100 -8.20%
specifically reported that more than LIPPO MALLS D5IU 1,152 100 26.80%
80% of their revenue was generated YOMA STRATEGIC Z59 949 100 58.90%
KENCANA AGRI F9M 356 100 -11.40%
in one or more neighboring ASEAN RH PETROGAS LTD T13 310 100 4.10%
states. INTERRA RESOURCE 5GI 234 100 36.50%
GLOBAL PALM RESO K6J 76 100 -20.40%
LION ASIAPAC LTD L08 75 99 -3.10%
CONSCIENCE FOOD L1D 74 98 -11.40%
This is based on their most recent HEALTH MGMT INTL 588 72 97 18.40%
financial year report and the table THAI BEVERAGE Y92 15,443 96 104.90%
JB FOODS LTD Q0W 221 93 53.30%
below details the revenue that was KHONG GUAN FLOUR K03 55 92 18.10%
SINARMAS LAND LT A26 1,338 92 24.30%
reported to be generated in ASEAN FIRST REIT AW9U 863 91 48.00%
economies other than Singapore. JARDINE CYCLE & C07 18,287 91 9.60%
RIVERSTONE HLDGS AP4 173 90 10.20%
STRAITS TRADING S20 1,499 86 15.20%
SEROJA INVESTMEN IW5 66 82 -23.20%
INDOFOOD AGRI RE 5JS 1,692 82 -23.20%
SGX The Asian Gateway 22ASEAN and China Interconnectiveness
China & ASEAN are two of just three regions
to see GDP double over 8 years.
Both have different structural challenges.
Rebalancing focus is raising Consumption in
China, while focus is on raising investment in
ASEAN.
ACTFA is planned to grow to US$500 billion by
2015 making ASEAN China’s largest trading US$ Billion 2010 2011 2012
partner by value.
China-ASEAN
Trade Value 292.8 363.8 400.9
YOY change (%) 37.5 24.2 10.2
Source: China Daily
SGX The Asian Gateway 23FTSE China Top Index
There are a number of businesses in 2012 total returns:
Singapore with revenue or assets ties to FTSE ST China Top Index +17.1%
China. FTSE China A50 Index +14.6%
Stock SGX Mkt YTD Total 2012 Dvd Ind
The FTSE ST China Top Index (China Code Cap
($m)
Return
(%)
Total Yld
Return
Top) represents the top 20 stocks within (%)
the FTSE ST All Share Index by full
HONGKONG LAND HOLDINGS H78 21555 0.08 58% 2.30
market capitalisation that either: LTD*
WILMAR INTERNATIONAL LTD F34 21300 -0.01 -32% 1.52
– Derive at least half of their sales revenue
HUTCHISON PORT HOLDINGS NS8U 8903 0.09 38% 8.45
from Mainland China; or TR-U*
– Have at least half of their operational KEPPEL LAND LTD K17 6322 4.53 93% 2.93
assets located in Mainland China. YANGZIJIANG SHIPBUILDING BS6 3621 -1.56 11% 5.26
YANLORD LAND GROUP LTD Z25 2796 -4.34 59% 1.32
BIOSENSORS INTERNATIONAL B20 2073 0.41 -11% NA
GRO
COSCO CORP SINGAPORE LTD F83 1825 -6.32 5% 2.30
CAPITARETAIL CHINA TRUST AU8U 1289 5.47 56% 1.75
HYFLUX LTD 600 1182 12.96 8% 3.62
SGX The Asian Gateway 24Possible capital market implications into 2020
Growing infrastructure requirements and cross border trade growth with ASEAN has
coincided with GDP growth in recent years.
On the Infrastructure side, according to the Asia Development Bank (ADB), there are
15 projects under the Master Plan of ASEAN Connectivity, of which six involve
physical infrastructure.
ADB have estimated that ASEAN needs US$600 bn between 2010 and 2020 to build
power, transport, water and sanitation and telecommunications infrastructure.
Conventional methods to raise funds include government funding, foreign direct
investment, public and private partnerships and capital markets.
REITs or Business Trusts can pay distributions to investors out of operating cash
flows and can thus be an appropriate structure for an organisation with high initial
capital expenditures with stable operating cash flows. The Business Trust structure is
more suited for businesses with stable growth and cash flow, such as infrastructure
and utilities businesses, vehicle leases and charters.
SGX The Asian Gateway 25Recent Business Trust Highlights
In 2012, the number of Business Trusts listed on SGX grew
30% with the listing of Ascendas Hospitality Business Trust,
Far East Hospitality Business Trust and Religare Health Trust.
The combined full market capitalisation of the 13 Business
Trusts listed on SGX currently amounts to S$18.6 billion.
According to the MAS’s OPERA database, two Business
Trusts, Global Telecommunications Infrastructure Trust and
Croesus Retail Trust have lodged listing prospectuses.
A Business Trust is an alternative structure of a commercial
operation which might otherwise be legally incorporated as
company. Typically, a Business Trust holds and manages
assets for the Trust beneficiaries. These assets can be related
to property, infrastructure, utilities and shipping.
SGX The Asian Gateway 26Objectives of the ASEAN Trading Link
Mr Arjun Goswami (Head of Regional Current Members of the Trading Link:
Cooperation of the Southeast Asia Bursa Malaysia
Department of ADB) on regional
Stock Exchange of Thailand
infrastructure noted last year that "in the
medium- to longer-term, improved Singapore Exchange
infrastructure would contribute to lowered
costs of doing business, increased market
accessibility and enhanced competitiveness."
Similarly through cross border trading, the
ASEAN trading link enhances accessibility of
ASEAN assets, reduces entry costs for
emerging brokers and promotes the ASEAN
asset class.
SGX The Asian Gateway 27How diverse are Singapore Stocks and Sectors?
2003 2004 2005 2006 2007 2008 2009 2010 2011 2012
Utilities RE D & H RE D & H Utilities Utilities Telco Oil & Gas Healthcare Telco RE D & H
138.29% 41.90% 33.75% 65.22% 118.42% -36.78% 160.58% 64.60% 4.99% 56.04%
Technology REITs Healthcare RE D & H Oil & Gas Cons Services Technology Industrials Healthcare Financial P
84.76% 30.84% 30.53% 54.54% 78.03% -43.39% 115.23% 25.58% 3.70% 36.84% E
Basic R
Cons Goods Cons Services Oil & Gas REITs STI Healthcare Cons Services REITs REITS F
Materials
62.07% 23.37% 28.52% 41.45% 57.12% -49.17% 114.79% 17.63% -16.04% 36.67% O
R
Telco Healthcare Telco Financial Industrials Financial Cons Goods Oil & Gas STI Industrials
M
55% 22.46% 20.53% 38.04% 39.55% -51.43% 103.20% 11.14% -17.04% 27.34% A
Oil & Gas Telco Industrials Cons Goods Cons Goods RE D & H RE D & H REITs Oil & Gas Oil & Gas N
C
54.76% 22.35% 17.95% 36.25% 22.12% -56.78% 89.94% 10.62% -17.40% 23.79% E
Industrials STI Financial Cons Services Telco REITs Utilities STI Industrials STI
F
53.01% 15.58% 14.99% 31.36% 21.61% -59.03% 81.38% 10.09% -18.57% 19.68% T
Basic S
Financial STI STI STI Technology Industrials Cons Goods Cons Services Utilities E
Materials
46.41% 14.68% 14.04% 27.97% 18.74% -60.02% 76.35% 9.80% -18.83% 14.99%
S
Healthcare Cons Goods REITs Telco Cons Services Industrials Financial Technology Cons Goods Telco
T
41.54% 12.32% 13.11% 25.09% 14.30% -60.08% 75.09% 9.56% -23.05% 8.55%
Basic S
REITs Industrials Cons Services RE D & H Healthcare REITs RE D & H Financial Technology
Materials E
34.65% 10.35% 10.10% 24.99% 13.97% -60.15% 69.35% 6.36% -23.41% 4.44% C
Basic T
STI Cons Goods Industrials Financial Cons Goods STI Utilities RE D & H Cons Services O
Materials
32.81% 2.48% 9.29% 19.20% 9.61% -63.28% 64.49% 4.62% -33.24% 4.43% R
Basic Basic Basic
RE D & H Oil & Gas Utilities Healthcare Healthcare Utilities Financial I
Materials Materials Materials
27.51% 0.32% 2.22% 16.79% 9.43% -72.72% 58.85% 2.38% -40.47% 2.18% N
D
Financial Technology Technology Technology Technology Oil & Gas Cons Services Telco Technology Healthcare
I
27.28% -29.75% -0.47% 10.01% 1.63% -73.17% 58.35% 0.01% -41.78% -4.13% C
Basic Basic Basic E
Cons Services Utilities Oil & Gas REITs Telco Utilities Cons Goods S
Materials Materials Materials
18.75% -59.82% -11.69% 2.75% -2.59% -74.13% 21.87% -3.87% -45.12% -17.55%
SGX The Asian GatewaySGX My Gateway
www.sgx.com/mygateway
1. Product Web Clips & Strategies
2. Research and Analysis of Products and
Companies
3. Investment Tools
4. Market Insights – Daily market summary and
market updates
5. Economic Calendar – Macroeconomic events,
corporate actions and earning releases
6. Investor Events
7. Retail Brokers – Information and Research
reports
SGX The Asian Gateway 29Thank you
Singapore Exchange • London • Tokyo • Beijing
2 Shenton Way, #19-00 SGX Centre 1, Singapore 068804
Main: (65) 6236 8888 Fax: (65) 6535 6994
This presentation is not intended for distribution to, or for use by or to be acted on by any person or entity located in any jurisdiction where such distribution, use or action would be contrary to applicable laws or
regulations or would subject SGX to any registration or licensing requirement.
This presentation is not an offer or solicitation to buy or sell, nor financial advice or recommendation for any investment product. This presentation is for general circulation only. It does not address the specific
investment objectives, financial situation or particular needs of any person. Advice should be sought from a financial adviser regarding the suitability of any investment product before investing or adopting any
investment strategies. Further information on investment products may be obtained from www.sgx.com.
Investment products are subject to significant investment risks, including the possible loss of the principal amount invested. Past performance of investment products is not indicative of their future performance.
Examples provided are for illustrative purposes only.
While SGX and its affiliates have taken reasonable care to ensure the accuracy and completeness of the information provided in this presentation, they will not be liable for any loss or damage of any kind (whether
direct, indirect or consequential losses or other economic loss of any kind) suffered due to any omission, error, inaccuracy, incompleteness, or otherwise, any reliance on such information. Neither SGX nor any of
its affiliates shall be liable for the content of information provided by or quoted from third parties.
SGX and its affiliates may deal in investment products in the usual course of their business, and may be on the opposite side of any trades.
SGX is an exempt financial adviser under the Financial Advisers Act (Cap. 110) of Singapore.
The information in this presentation is subject to change without notice.
Any recirculation, transmission or distribution of this presentation or any part thereof by any third party requires the prior written permission of SGX. SGX and its affiliates disclaim all responsibility and liability
arising in connection with any unauthorised recirculation, transmission or distribution of this presentation or any part thereof.
© SGX Ltd, November 2010
www.sgx.com
SGX The Asian Gateway 30You can also read