Environment and Business Opportunities - Presentación Colombia - in Colombia - Chambre de Commerce
←
→
Page content transcription
If your browser does not render page correctly, please read the page content below
Investment
Presentación Colombia –
   Environment and
Inglés
Business Opportunities
     in Colombia
April – 2015
PROCOLOMBIA
About us
PROCOLOMBIA
We promote exports, tourism, investment and industrial expansion for
internationalization. We integrate the work of the Country Brand within the
strategic planning of Colombia’s promotion worldwide.
PROCOLOMBIA in the world

                                                    26 commercial offices
                                                     Presence in    30 countries
United States. Canada. Mexico. Guatemala. Costa Rica. Caribbean. Venezuela. Brazil.
Ecuador. Chile. Peru. Argentina. Spain. Germany. Portugal. United Kingdom. France. Turkey.
United Arab Emirates. India. China. South Korea. Russia. Japan. Singapore. Indonesia.
Presence in Colombia

                 25 Information centers
                   Valledupar,      Pasto,    Palmira,    Armenia   =
                   Villavicencio,    Tunja,    Duitama,     Sogamoso,
                   Ibagué, Santa Marta, San Andrés, Aburrá, Neiva,
                   Barranquilla, Cartagena, Medellín, Bucaramanga,
                   Cali, Pereira, Bogotá, Manizales y Cúcuta.

                  8 Regional Offices
                   Barranquilla, Bogotá. Bucaramanga. Cali.
                   Cartagena. Cúcuta. Medellín. Pereira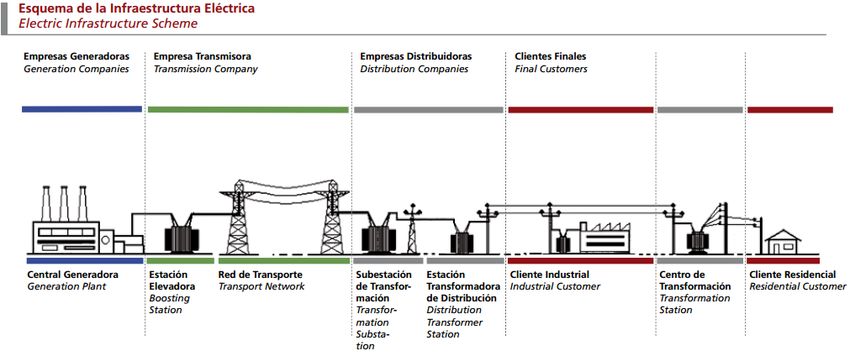
Services for investors Information that addresses specific needs Contacts in the public and private sector Organization of agendas and accompaniment during the visit to Colombia Services for investors residing in the country All services are free of charge and the information provided during the process will be made available under complete confidentiality

COLOMBIA

Table of Contents

Current Macroeconomic Indicators

Colombian Investment Standards

Sectors for Potential Investments

Current Macroeconomic Indicators

Colombian Investment Standards

Sectors for Potential Investments

Macroeconomic stability and strong economic
performance in the long term
GDP Growth, Inflation and unemployment Rate
2002 – 2018p (%)
                                                                                                                        Unemployment rate
   15.6                                                                                                                 GDP
          14.1                                                                                                          Inflation
                 13.7

                           11.8     12.0                     12.0     11.8
                                            11.2     11.3
                                                                              10.8
                                                                                       10.4
                                                                                                9.6
                                                                                                         9.1     9.0     8.9     8.9     8.6
                                                   7.7
                                    6.7      6.9                               6.6
   7.0           5.3                                                                                      5.0
           6.5              4.7                                                                 4.7              5.0     4.7     4.6     4.6
                 5.5                         5.7                      4.0              4.0
                            4.9                      3.5
                                    4.5                      2.0
   2.5    3.9                                                                  3.7                       3.6     3.4     3.6     3.5     3.3
                                                                                       2.4
                                                                                                1.9
                                                            1.7

   2002   2003   2004      2005     2006    2007     2008    2009     2010    2011     2012    2013     2014p   2015p   2016p   2017p   2018p

                        P: Projected
                        Source: DANE; Banco de la República; Fedesarrrollo July 2014, EIU - Economist
                        Intelligence Unit . 2014
                        * 2014 inflation given by DANE
PIB (PPA) – 2015 (Billions USD)
2,324
Germany
1,790
Brazil
1,176
Mexico
1.089
Australia
600
Malaysia
Colombia is within the 30th largest economies in the world.
595
Colombia
415
Vietnam
The country has a population of 47,7 million inhabitants.
401
Switzerland
387
Singapore
448
Belgium
432
Sweden
373
Chile
425
Hong Kong
397
Peru
300
Norway
302
Israel
226
Denmark
New Zealand
150 Note: GDP adapted to Purchasing Power Parity
PPP. Projected data.
Source: FMI . 2014PIB per capita (PPA ) 2000-2018
(USD)
Colombia´s per capita income has nearly doubled since 2000
Income
16.000
14,110 High Income
14.000
12.000
10.800
10.000
8.850
Middle High
8.000 Income
5,805
6.000
4.000
Middle Low
Income
2.000
Low Income
0
2000 2001 2002 2003 2004 2005 2006 2007 2008 2009 2010 2011 2012 2013 2014p 2015p 2016p 2017p 2018p
Source: EIU – Economist Intelligence Unit. PPP = purchasing power parity.
Economies are divided according to 2012 income per capita, calculated using the World Bank Atlas method. The groups are: low
income, US$1,035 or less; lower middle income, US$1,036 - US$4,085; upper middle income, US$4,086 - US$12,615; and highA rapidly expanding middle class
Middle class* in Colombia as a Average real growth of consumer
percentage of total population expenditure, 2014 – 2018
46%
5,5%
Million
inhabitants
37%
4,7%
25%
24.7
4,2%
19.0
16%
11.6 4,1%
6.7
2,9%
2002 2012 2020 2025
* Calculus based on a 4.6% GDP growth
Middle class: Monthly household income between 3.2MW and
13MW
(MW) Minimum wage in Colombia 2014: USD 320.
Source: Fedesarrollo (2013) and EuromonitorMultiple development regions
Barranquilla
1.212,943 hab.
Cartagena
990,179 hab.
55% of the population has less
Medellín
Cucuta than 30 years old.
643,666 hab.
2.441,123 hab.
Bucaramanga 9 cities have a population of
527,451hab. over 500,000 inhabitants
Cali
2.344,734 hab.
Bogota
7.776,845 hab.
Ibague
512,631 hab.Private sector: Main driver of economic growth
Contribution of demand components to the growth of GDP
Private consumption and investment contributed strongly to the growth between 2010 and 2012
• Decrease in unemployment Rate Increase in trust
• Historically low interest rates Increase of loans
• Important increase of the middle class.Foreign Direct Investment
FDI inflows 1994 –2014 I Trim Top Investors in Colombia
US$ Mio. 2000 – 2014 I Trim
USA
Var. • US$ 25,912 millions
• 23.1 %
8%
16,354
15,119 England
• US$ 15,894 millions
• 14.1%
Spain
7,821 • US$ 8,579 millions
• 7.6%
2,504 Chile
• US$ 4,408 millions
• 4%
Prom. Prom. 2012 2013
1994 - 2002 2003 - 2011
Source Ballance of Payments- Banco de la República.
Share of all countries with positive cumulative investment, The information includes reinvested profits or investments in the oil sector
Note: the list of the top countries investing in Colombia does not include Panama.Current Macroeconomic Indicators Colombian Investment Standards Sectors for Potential Investments
Economic growth, Investor Confidence and Security
6000                                                                                         30,0

5000                                                                                         25,0

4000                                                                                         20,0

3000                                                                                         15,0

2000                                                                                         10,0

1000                                                                                         5,0

  0                                                                                          0,0

                               IED - US$ million*   Insecurity perception**

         •   Figures do not include FDI registered for SabMiller acquisition of Bavaria in
             2005 (USD 4,800 MM).
         ** Perception of insecurity as a key issue affecting industrial growth in the
         country. Monthly Industrial Survey -ANDI.
         Source: National Business Association of Colombia - ANDI. Balance of
         Payments – Banco de la República.
An investment-grade country with positive outlook
Rating Term Rating Date Outlook
Agency
Long Term–
BBB 24– Apr- 2013
Foreign Currency
Stable
Long Term– Local
Currency BBB + 5 – Mar - 2007
Long Term–
BBB 13 – Dic- 2013
Foreign Currency
Stable
Long Term –
Local Currency BBB+ 22 – Jun -
2011
Long Term– Baa2 Positive
28– Jul - 2014
Foreign Currency
The key drivers for Moody´s upgrade on July 2014 were:
1. Expectations of continued strong growth dynamics despite external headwinds and robust long-term growth
prospects supported by the fourth generation (4G) infrastructure investment program;
2. Sound fiscal management that has led to moderate fiscal deficits coupled with continued compliance with
the fiscal rule and expectations that this will continue.
Source: S&P Ratings; Revista Dinero, Colombian Treasury.The World Bank’s Doing Business Report 2015
Colombia, 34*
Colombia tops the region
Peru, 35 *
Invited to become OECD member
19
Mexico, 39 *
-1
Chile, 41 *
+4
-2 Panama, 52 *
+3 Ecuador, 115 *
Position out of 189 economies
Change in rank 2014 – 2015**
Brazil, 120 *
0
+3
Source: Doing Business Report 2015. World Bank
* Position between 189 economies. ** Positive numbers indicate an improvement in the business environmentLeader in terms of Investor Protection in L.A.
and 10th worldwide
Investment Protection Index
Doing Business - 2015
Ranking Country
7,2
10 Colombia
6,3 6,2
5,8 5,8 5,8
5,6 35 Brazil
4,8 4,7
4,2 40 Peru
56 Chile
62 Mexico
62 Argentina
76 Panama
Ecuador
Colombia
Chile
Argentina
Uruguay
El Salvador
Brazil
Peru
Mexico
Panama
110 Uruguay
117 Ecuador
154 El Salvador
Source: Doing Business 2015 – World Bank
* Índex: 0-10 and 10 = the best scoreFree Trade Zones
->Reduced income tax
-> Sales allowed in the local market
Guajira
Atlántico Magdalena
Free Trade Zone
Bolívar Norte de
Santander
Antioquia Santander
Special Standing
Permanent Free
Caldas "Uniempresarial"
Trade Zone
Risaralda Boyacá (FTZ)
Quindío Cundinamarca
Valle del
Cauca
Cauca Huila
FTZ filed after
FTZ requested or approved prior December 31, 2012.
to December 31, 2012.
• Income tax of 15%
• 15% Income tax.
+ 9% tax CREE.
Caribbean
Andean Region
Pacific RegionCompetitive advantages of Free Trade Zones
No import duties. VAT exemption for goods sold
from Colombia to FTZ.
Benefit from international trade agreements.
Allows sales to the local market.
Free trade zones for different investor styles.Access to more than 45 countries and 1,5 billion
consumers through its network of FTAs
Norway
Island
Canada Liechtenstein
European
Switzerland
Union
South Korea
United States Turkey Japan
Israel
Mexico
Costa Rica
Cuba*
Guatemala
Panama
Honduras
Venezuela*
Nicaragua*
El Salvador
Ecuador
Brazil
Peru
Pacific
Alliance
Bolivia
Paraguay
In force
Chile
Uruguay
Signed
Argentina
In negotiation
*These are Partial Scope Agreements (PSA)
- - - The dotted line refers to member countries of The Pacific
Alliance other than Colombia. – Chile, Peru and México.
Source: Colombian Ministry of Commerce, Industry and Tourism.
2014.International Investment Agreements - IIA
United Russia
Kingdom
Canada
Switzerland
France
United States Spain Turkey Japan
Israel China
Azerbaijan
Mexico Kuwait South Korea
UAE
Qatar India
Guatemala
Costa Rica
Honduras
El Salvador
Panama
Singapore
Peru In force
Pacific
Alliance Signed
Chile In negotiation
Note: The International investment agreements (IIA) include Agreement Investment
Treaties – BIT (agreement) and Free Trade Agreements – FTA- with investment section
(chapter).
Source: Colombian Ministry of Commerce, Industry and Tourism. 2014.Double Taxation Agreements - DTA
United Kingdom
Canada Netherlands
Belgium
Switzerland
France
Portugal Czech South Korea
United States Republic Japan
Spain
Mexico
India
Ecuador
Peru
Bolivia In force
Chile Signed
In negotiationA competitive location with easy access to
markets around the globe
Frankfurt
11H15M
Canada Toronto Paris
6H05M 10H40M
United States Germany
Los Angeles New York France
8H20M 5H35M
Madrid
9H40M Spain
México
Mexico City Over 935 weekly direct international flights.
4H45M Caracas
1H20M
More than 6,197 weekly domestic flights.
Ecuador
Quito Brazil
1H30M Peru
Sao Paulo Less than 6 hours to the main capital cities
Lima 5H45M
3H00M
in Latin America.
Chile Argentina More than 20 different airlines
Santiago Buenos Aires operating in Colombia.
Chile 6H15M
5H00MLabor incentives Discount in the income tax and supplementary contributions New employees under twenty eight New employees certified in displacement (28) years old. Length of benefit by situation, reintegration or disability. employee: 2 years. Length of benefit by employee: 3 years. New employees with incomes lower New women employees above 40 years than 1.5 Minimum Wages (US$ old with more than 1 year 476). Length of benefit by employee : unemployed. Length of benefit by 2 years. employee: 2 years.
POTENTIAL
 SECTORS
INFRASTRUCTURE
Current state of infrastructure
State of the Total State of the Roads
Infrastructure
Chile Mexico
Mexico Chile
Ecuador Argentina
Colombia 3,66 Ecuador
Brasil Perú
Perú Brasil
Argentina Colombia 1,7
Venezuela Venezuela
Uruguay Uruguay
0 1 2 3 4 5 6 0 1 2 3
State of the Railways State of the Port Infrastructure
Chile
Mexico Chile
Mexico
Ecuador
Ecuador
Perú
Argentina
Argentina
Perú
Venezuela Colombia 3,4
Uruguay Brasil
Colombia 2,9 Venezuela
Uruguay
Brasil
0 1 2 3 4 5 6
0 1 2 3 4 5 6
Quelle: World Economic Forum. Global Competitiveness Report 2011 - 2012
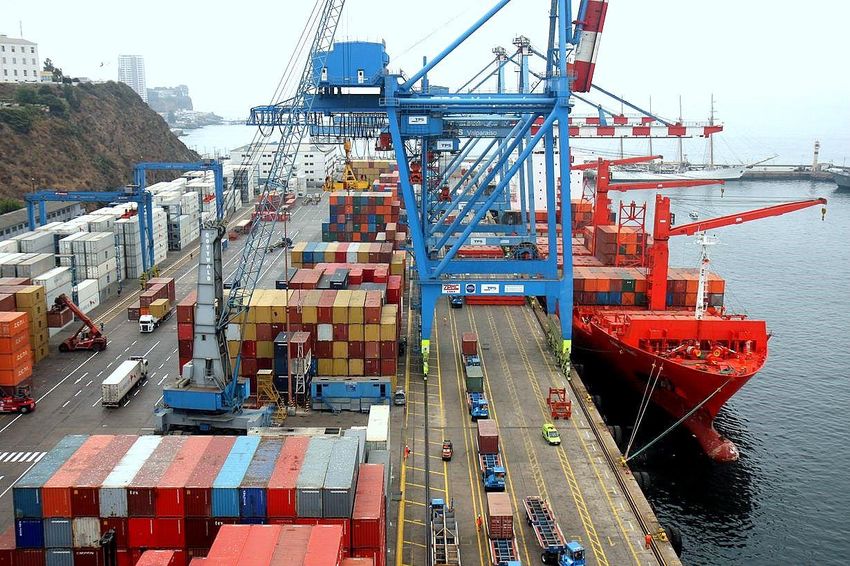
1 = Extremely Undeveloped; 7 = Completely efficient by the International StandardsA budget of 25 billion USD (2014-2018)
8,170 Km of roads to be constructed or
improved. (ANI, 2013)
The Government aims to
increase port capacity
by 70%
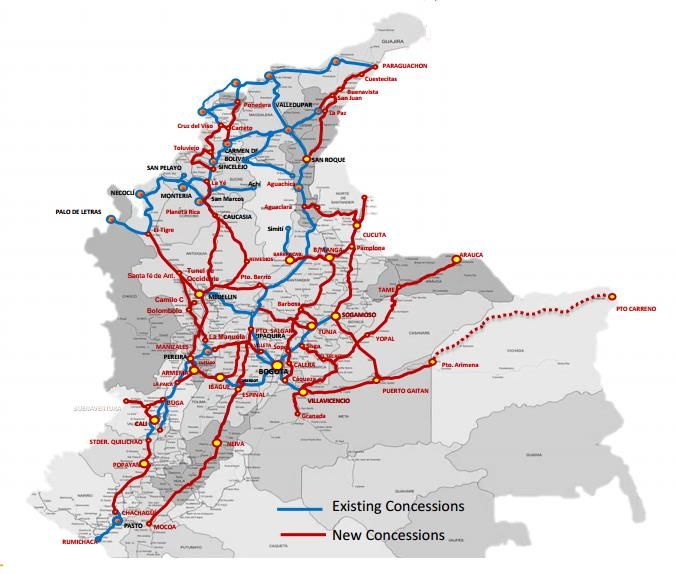
Source: MCIT, 2013Infrastructure: A major drive for growth
Fourth Generation of PPP’S (4g) –
Roads: US$ 24 Bill.
-Intervention of 8.000 Km of Roads
- 1.300 Km of new Roads
- 40 new concessions
Ports: US$
2,1 Bill.
(2015-2018)
Improvement of the
Opportunities to Magdalena river
develop air, road, river navigability:
and airport US$ 1.3 Bill.
infrastructure Airports: interventions US$ 1.8
Bill (10 projects) and
constructions US$ 2.3 Bill (2
projects). (2015-2018)
Step Rail Ways Concession
Program (feasibility study – step
2) US$ 4.2 Bill.
Source: Ministry of TransportENERGY
Market structure

      Competition               Monopoly                    Monopoly

    Agents of the power sector                                                         USERS
      registered in Colombia                                            Non regulated users (large users):
                                                                  o Power demand > 2 MW or power consumption of
                                                                    55 MWh/month.
 Commercialization                                     94
                                                                  o These users can celebrate bilateral contracts with
                                                                    marketers
                                                                  o Set the price and quantity freely between the two
       Generation                    53

                                                                    parties.
       Distribution        31
                                                                  Regulated users:
                                                                  o Subject to a contract of uniform conditions.
     Transmission     12                                          o Rates are regulated by the CREG through a
                                   Total Agents: 190                general tariff formula.
                                      Source: XM
Installed capacity in Colombia
National Interconnected System (NIS)
Installed capacity
Total NIS 2013: 14,559 MW December 31, 2013 Thermal Resources
Cogenerators
0,5% Thermal:
4,515 MW
Minors Coal
4,6% 22,1%
Thermal Gas
Hydro: 43,7%
31,4%
Fuel Oil
9,135 MW 6,8%
ACPM
Hydraulic 20,3%
63,5% Gas-
Jet
A1
6,1%
Jet1
1,0%
Source: XM- 2014Connected Zones (NIS) of Colombia
National Interconnected System (NIS)
− It includes 48% of the national territory and
San Andrés y
Providencia Atlántico
La Guajira
provides coverage to 96% of the
Magdalena
population.
Sucre Cesar
Bolívar
− Estimates on future demand are based on
Córdoba Norte de Santander the interconnected zones.
Antioquia Santander Arauca
− 32 large hydroelectric plants and 30
Risaralda Chocó Boyacá Casanare thermoelectric plants provide electricity to
Caldas
Bogotá
Vichada
the SIN.
Quindío
Tolima
V. del Cauca
Meta
Cauca
Huila Guainía
Non-connected areas (UA)
Guaviare
Nariño
− ZNI account for 52% of the country: 17
departments and 1.441 municipalities (625
Vaupés
Putumayo Caquetá
thousand people).
− It is mainly supplied by diesel generators.
Amazonas
NIS
Non-connected
areas
Source: Mining and Energy Planning Unit for Energy Solutions of Unconnected Zones (IPSE), 2013.Investment opportunities in power Generation
Solid and well established • Since 1994, 2 reforms (Laws 142 and 143) were implemented aiming primarily to
foster the private investment in the sector. This has translated into business
regulatory framework: opportunities for companies that have specific projects.
Resources to enhance the • Colombia has natural resources for power generation: water, coal and the
possibility of gas in amounts that allow greater supply than that of the country's
expansions: demand.
An energy deficit starting in • For the period 2019 - 2028, an increase of installed capacity is required, with the
year 2022 aim of meeting the criteria for energy reliability.
Power demand in Latin • The World Bank forecasts that demand will reach 2,500 TWh by the end of that
America will double between 2030. This growth implies a need of an additional 239 GW in the region
2008 and 2030 approaching 330GW of installed capacity.
International • Will increase energy exports to Latin American countries. Interconnection project
between Colombia – Panama (2018), Andean Electrical Interconnection System
interconnection projects between Ecuador-Peru-Chile.
• Different stages which sum 4,974 MW. 90 Hydraulic projects which sum 3,631
103 Power Generation MW, 8 thermal projects equivalent to 858 MW, 4 Eolic projects which estimate to
projects under development produce 654 MW, and 1 solar with an installed capacity of 19.9 MWInvestment opportunities in Non-Conventional power Generation
Development of Non- • Geospatial position of Colombia . (Generation of energy
Conventional power generation from Non-Conventional resources such as: solar,
projects wind, biomass, geothermal and solid waste).
• This Law promotes the development and use of non-conventional
Law 1715 of 2014 integrates energy sources (especially those from renewable sources), in the
national energy system, establishes the legal framework and
non-conventional renewable
instruments for the use of non-conventional energy sources (FNCE
energy to the national energy for its acronym in Spanish), especially those from renewable
system. sources, and creates tax incentives for the investment in this
kind of projects.
• The National Interconnected System (NIS) connects 48% of the
Non – Inteconnected Zones national territory and covers 97% of the population. The Non-
account to 52% of the National connected zones (ZNI) account for 52% of the country´s area (17
Territory departments and 1,441 municipalities) and 625 thousand people.
Currently, these zones produce energy with Diesel.OTHER SECTORS
Export Platform attracting European FDI
Identification of strategic sectors to attract foreign direct investments include:
Manufacturing Industry, Agroindustry and Services.        The principal subsectors
include:

 - Chemical Industry                       - Financial Services
 - Construction Industry                   - Logistics
 - Automobile Industry                     - Creative Industries
 - Pharmaceutical Industry                 - Petrol extraction and Services
                                           - Real Estate
 - Aerospatiale Industry                   - Hotels and Touristic Industries.
 - BPO et IT                               - Foods and Services Industries
 - Cosmetic Industry                       - Radio and TV Industry
You can also read