Becoming a world leader in renewables - Total.com
←
→
Page content transcription
If your browser does not render page correctly, please read the page content below
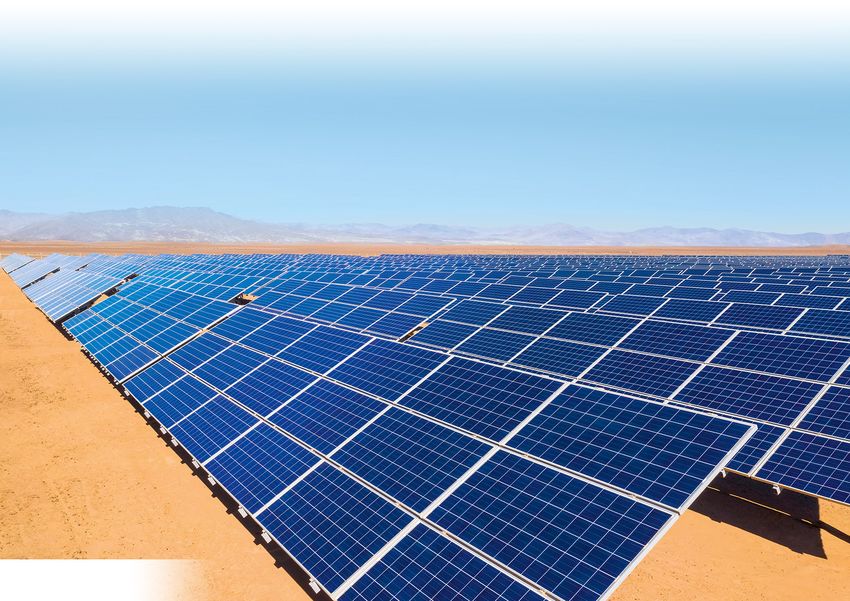
Becoming a world leader in renewables
All regions growing significantly

Global solar and wind capacity
GW
                             4000

                                                                                  Africa, Middle East, ROW
                                                                                  South America
                             3000
                                                          +10%                    Rest of Asia
                                                          per year
                                                                                  India
                                                                                  USA
                             2000
                                                                                  Europe

                             1000
                                                                                  China

                                         2020                              2030

                                     Solar capturing ~70% of capacity additions

Reference: Total Energy Outlook 2020, momentum scenario

                                                                             Becoming a world leader in renewables   |   1
Renewables & Power: growing ambition over the last 5 years

                                                                                         Ignis
                                                                                         Powertis
                                                                                         Solarbay
                                                                                         JV Adani Green
                                         SOLAR DISTRIBUTED GENERATION
                                                                                         Al Kharsaah
                                                                                         Global Wind Power
                                                                        JV Envision      Erebus
                                                                                         Seagreen 1
                                                                                         JV Macquarie (Korea)
                                                                                         EDP portfolio
                                                                                         CCGT EPH
                                      CCGT KKR                          JV Tianneng/Saft ACC (JV Peugeot)

  2011         2016        2017           2018                               2019                     2020

                      8 B$ investments over 2016-20

                                                                               Becoming a world leader in renewables   |   2
Already well established in Renewables

Renewables gross capacity
GW

                                     ~ 7 GW           Positioned on all high growth
                                                      markets
                                                          •    Solar farms
         6                                    Wind        •    Solar DG
                                                          •    Wind onshore
                                                          •    Wind offshore
                                                          •    Batteries
         3
                                              Solar   Experienced teams and partners

                                                      Capital light model

              2017     2018   2019     2020

             4 B$ capital employed end 2020

                                                              Becoming a world leader in renewables   |   3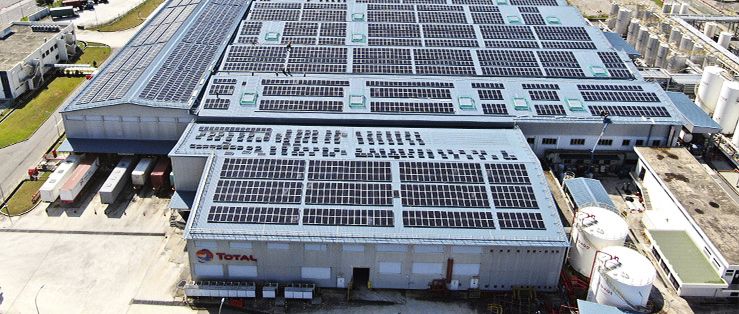
Building on 2020 dynamic to raise the bar
+10 GW in 2020 with equity return > 10%

Gross renewable capacity
GW
                                                                                                               35 GW
                    40

                    30

                                                                Spain                    Yet to find
                    20                                         France         Wind

                                                                              Solar

                    10
                                              Qatar
                                            Seagreen       In development
                            India
                                         In construction

                         In operation*                                      Already in                           2025
                                                                             portfolio

                                    Capturing profitable opportunities with low entry cost

* As of July 2020

                                                                                                       Becoming a world leader in renewables   |   4
France: balanced position in wind and solar

                                              Quadran created in 2013
          1 GW              > 4 GW
         in operation        by 2025          50% wind/50% solar in 2020
          end-2020
                                              Growing market share to ~10%
                                              by 2025

                                              Acquisition of Global Wind
                                              Power in 2020
                                              • Onshore wind developer
                                              • > 1 GW of project pipeline

                                              Benefiting from integration:
                                              • ~2.5 GW CCGT in 2020
                                              • 3.5 M power customers in 2020

 Wind
 Solar

                                                  Becoming a world leader in renewables   |   5
Spain: building a strong position

                                                                                 Acquired pipelines from
                                                                                 3 developers in 2020

           5 GW
                                                   850 MW
                                                                   2.5 M
                                                                  gas & power
           pipelines                                                             Phased payments as developers
                                 700 MW                            customers
                                                    360 MW                       de-risk projects
                             1150 MW
                                             450 MW
                                           350 MW
                                                                                 • 100% grid connection rights
                                                                                 • ~ 60% land secured
                       600 MW                         340 MW
                       200 MW
   Ignis                                850 MW                                   > 10% equity IRR
   Powertis
   Powertis
                                                                                 Upside from Integration with EDP
   CCGT
                                                                                 acquisition:
                                                                                 • 850 MW CCGT
Typical milestones                                                               • A portfolio of 2.5 M power
                                           Financing, PPA         Construction     and gas customers
                                           and EPC signed         starts

                       Administrative
 Grid access and                                 Working permit
                       authorization                                 start up
 land secured                                    granted
                       granted

                                                                                     Becoming a world leader in renewables   |   6
Greening all power used by our European operations
Reducing Scope 2 CO2 emissions in Europe by 2 Mt/y
                                                             Our Total sites

                                                                        Consuming
                                 Netherlands
                                                                        ~6 TWh in operated
                                                                        industrial sites,
                                               Germany
                                                                        commercial sites
                                 Belgium                                and offices

                                                             Our trading
                             France
                                                                        Interfacing with
                                                                        local Power markets
                                                                        and Group entities

                                                             Our solar farms

              Spain                                                     Solar farms
                                                                        producing ~10 TWh
                                                                        by 2025
                                                                        Selling excess power
                                                                        to 3rd parties
                 A corporate in-house PPA
        mobilizing renewable and trading expertise

                                                         Becoming a world leader in renewables   |   7
Qatar: developing first large-scale solar power plant
Strengthening long term hydrocarbons partnership

          800 MW                           ~10%
                                          Qatar peak    JV Total/Marubeni/Qatar
                                         power demand   Petroleum/QEWC

                                                        The first GW-size project
                                                        • 2,000,000 solar modules
                                                        • 3,000 people during
                                                          construction

                                                        ~0.5 B$ project investment

                                                        25-year PPA record levelized
                                                        electricity cost of 14.5 $/MWh
                         Iran
                                                        Starting up from 2021
           Al Kharsaah
 Saudi
 Arabia
               Qatar

                           United Arab
                            Emirates

                                                            Becoming a world leader in renewables   |   8
Building on partnership with Adani in India
Adani Green Energy Ltd, the largest solar developer in the world
100 MW
> 2 GW ~500 M$
in operation 220 MW 100 MW investment
2019: partnership in LNG and city
gas with Adani
100 MW
2020: 50/50 JV with Adani Green
20 MW
Energy Ltd
100 MW • Assets in 11 states
• 25-year PPA
50 MW
810 MW
Kamuthi: 650 MW
The largest solar farm in India Total equity IRR 13%
India: very strong support from government for renewables
Objective 175 GW by 2022
Becoming a world leader in renewables | 9Total Eren: fast growing global position
Global footprint
1.8 GW 5 GW Eren founded in 2012
in operation by 2022
Total shareholder since 2017,
30% today
100 assets in operation in 15
countries (50% solar, 50% wind)
Option to acquire remaining
shares in 2023
In operation and construction In development Prospect
Becoming a world leader in renewables | 10Solar distributed generation
Leveraging global footprint and customer proximity
Commercial and industrial market Delivering competitive renewable electricity
Capacity
GW
300
+15% Row
per year
ME/Africa
India
200 USA
Europe
Europe
Offering global solutions to multinational
100 companies
China Solarization of retail network and Group sites
JV 50/50 with Envision in China
2020 2025 > 100 customer sites in operation and
construction, 200 MW by end-2020
High growing demand for on site generation 3 GW by 2025
Becoming a world leader in renewables | 11New SunPower: the solar DG arm for Total on the US market
SunPower Maxeon Solar Technologies
52% ownership 36% ownership
North America DG Energy Services Global Solar Panel Business
• #1 in commercial business, #2 in residential • Successful spin off in August 2020
• Strong go to market channels • Partnership with TZS, a global Chinese supplier of
silicon wafers (29% shareholding of Maxeon)
• Expanding market through storage & services offerings
• Developing next generation solar panel technology
• Capital / Opex light model
with significant manufacturing cost savings
Focusing on DG and storage markets Deploying advanced technologies at scale
Becoming a world leader in renewables | 12Seagreen: first big step in offshore wind
Up to
3.7 B$ 1.5 GW 51% Total / 49% SSE
Capex
1.1 GW starting up end-2022
with 0.4 GW possible extension
> 50% load factor
70% covered by PPA
Seagreen
Becoming a world leader in renewables | 13Pioneer in floating offshore wind technology
Fueling post-2025 growth
UK: up to 400 MW South Korea: > 2,000 MW
South Korea
Erebus
Valorous United
Kingdom
Gray Whale
3 x 500 MW
Port Hamilton
Jindo
420 MW
420 MW
80% Total / 20% Blue Energy 50% Total / 50% Macquarie
Semi-sub technology Exclusive rights to collect wind data
Lease secured Priority to secure lease
Erebus target FID 2024 (100 MW) Target FID 2023 (500 MW)
First floating offshore wind Scaling up in floating offshore wind
Becoming a world leader in renewables | 14E&P know-how: key competitive advantage in floating offshore wind
Opening huge development potential up to 10x fixed offshore wind
Proven oil & gas technologies Leveraging O&G competencies
Offshore architecture
Large EPC management
Supply chain
Offshore logistics & operations
TLP Semi-Sub Spar
> 60 m water depth
Priority for R&D and Innovation: 20 M$/y budget
Becoming a world leader in renewables | 15Global footprint for building a unique renewables portfolio
Europe
15,000 MW Middle East
US 2,000 MW
3,000 MW China
3,000 MW
Rest of Asia
2,000 MW
Africa India
1,000 MW 6,000 MW
South America
3,000 MW
New regions rebalancing Group geopolitical profile
Presence by 2025
Becoming a world leader in renewables | 16Disclaimer
This document may contain forward-looking statements within the meaning of the Private Securities (ii) Inventory valuation effect
Litigation Reform Act of 1995, notably with respect to the financial condition, results of operations, business
activities and industrial strategy of TOTAL. This document may also contain statements regarding the The adjusted results of the Refining & Chemicals and Marketing & Services segments are presented according
to the replacement cost method. This method is used to assess the segments’ performance and facilitate the
perspectives, objectives and goals of the Group, including with respect to climate change and carbon
neutrality (net zero emissions). An ambition expresses an outcome desired by the Group, it being specified comparability of the segments’ performance with those of its competitors.
that the means to be deployed do not depend solely on TOTAL. These forward-looking statements may In the replacement cost method, which approximates the LIFO (Last-In, First-Out) method, the variation of
generally be identified by the use of the future or conditional tense or forward-looking words such as inventory values in the statement of income is, depending on the nature of the inventory, determined using
“envisions”, “intends”, “anticipates”, “believes”, “considers”, “plans”, “expects”, “thinks”, “targets”, “aims” either the month-end price differentials between one period and another or the average prices of the period
or similar terminology. Such forward-looking statements included in this document are based on economic rather than the historical value. The inventory valuation effect is the difference between the results according
data, estimates and assumptions prepared in a given economic, competitive and regulatory environment to the FIFO (First-In, First-Out) and the replacement cost.
and considered to be reasonable by the Group as of the date of this document.
(iii) Effect of changes in fair value
These forward-looking statements are not historical data and should not be interpreted as assurances that
the perspectives, objectives or goals announced will be achieved. They may prove to be inaccurate in the The effect of changes in fair value presented as an adjustment item reflects for some transactions differences
future, and may evolve or be modified with a significant difference between the actual results and those between internal measures of performance used by TOTAL’s management and the accounting for these
initially estimated, due to the uncertainties notably related to the economic, financial, competitive and transactions under IFRS.
regulatory environment, or due to the occurrence of risk factors, such as, notably, the price fluctuations in
IFRS requires that trading inventories be recorded at their fair value using period-end spot prices. In order to
crude oil and natural gas, the evolution of the demand and price of petroleum products, the changes in best reflect the management of economic exposure through derivative transactions, internal indicators used
production results and reserves estimates, the ability to achieve cost reductions and operating efficiencies
to measure performance include valuations of trading inventories based on forward prices.
without unduly disrupting business operations, changes in laws and regulations including those related to
the environment and climate, currency fluctuations, as well as economic and political developments, TOTAL, in its trading activities, enters into storage contracts, whose future effects are recorded at fair value in
changes in market conditions, loss of market share and changes in consumer preferences including those Group’s internal economic performance. IFRS precludes recognition of this fair value effect.
due to epidemics such as Covid-19. Additionally, certain financial information is based on estimates
particularly in the assessment of the recoverable value of assets and potential impairments of assets Furthermore, TOTAL enters into derivative instruments to risk manage certain operational contracts or assets.
Under IFRS, these derivatives are recorded at fair value while the underlying operational transactions are
relating thereto.
recorded as they occur. Internal indicators defer the fair value on derivatives to match with the transaction
Neither TOTAL nor any of its subsidiaries assumes any obligation to update publicly any forward-looking occurrence.
information or statement, objectives or trends contained in this document whether as a result of new
The adjusted results (adjusted operating income, adjusted net operating income, adjusted net income) are
information, future events or otherwise. Further information on factors, risks and uncertainties that could
affect the Group’s business, financial condition, including its operating income and cash flow, reputation or defined as replacement cost results, adjusted for special items, excluding the effect of changes in fair value.
outlook is provided in the most recent version of the Universal Registration Document which is filed by the Euro amounts presented herein represent dollar amounts converted at the average euro-dollar (€-$)
Company with the French Autorité des Marchés Financiers and the annual report on Form 20-F/A filed with exchange rate for the applicable period and are not the result of financial statements prepared in euros.
the United States Securities and Exchange Commission (“SEC”).
This document also contains extra-financial performance indicators, including a carbon intensity indicator for
Financial information by business segment is reported in accordance with the internal reporting system and energy products used by Total customers, that measures the average greenhouse gas emissions of those
shows internal segment information that is used to manage and measure the performance of TOTAL. In products, from their production to their end use, per unit of energy. This indicator covers the direct GHG
addition to IFRS measures, certain alternative performance indicators are presented, such as performance emissions of production and processing facilities (scope 1) and their indirect emissions associated with energy
indicators excluding the adjustment items described below (adjusted operating income, adjusted net purchase (Scope 2), as well as the emissions associated with the use of products by the customers of the
operating income, adjusted net income), return on equity (ROE), return on average capital employed Group (Scope 3) which Total does not control (for the definitions of scopes 1, 2 and 3, refer to Total’s Universal
(ROACE), gearing ratio and operating cash flow before working capital changes. These indicators are Registration Document).
meant to facilitate the analysis of the financial performance of TOTAL and the comparison of income
between periods. They allow investors to track the measures used internally to manage and measure the Cautionary Note to U.S. Investors – The SEC permits oil and gas companies, in their filings with the SEC, to
performance of the Group. These adjustment items include: separately disclose proved, probable and possible reserves that a company has determined in accordance
with SEC rules. We may use certain terms in this presentation, such as “potential reserves” or “resources”, that
((i) Special items the SEC’s guidelines strictly prohibit us from including in filings with the SEC. U.S. investors are urged to consider
closely the disclosure in our Form 20-F/A, File N° 1-10888, available from us at 2, place Jean Millier – Arche
Due to their unusual nature or particular significance, certain transactions qualified as "special items" are
excluded from the business segment figures. In general, special items relate to transactions that are Nord Coupole/Regnault – 92078 Paris-La Défense Cedex, France, or at our website total.com. You can also
obtain this form from the SEC by calling 1-800-SEC-0330 or on the SEC’s website sec.gov.
significant, infrequent or unusual.
However, in certain instances, transactions such as restructuring costs or asset disposals, which are not
considered to be representative of the normal course of business, may be qualified as special items
although they may have occurred within prior years or are likely to occur again within the coming years.For more information, please visit total.com TOTAL SE Investor Relations 10 Upper Bank Street, Canary Wharf London E14 5BF United Kingdom Share capital: 6,632,810,062.50 euros 542 051 180 RCS Nanterre Reception: +33 (0)1 47 44 45 46 total.com Investor Relations: +44 (0)207 719 7962
You can also read