2018 HALF YEAR RESULTS PRESENTATION - 14 August 2018 - Capital & Regional
←
→
Page content transcription
If your browser does not render page correctly, please read the page content below
2018 HALF YEAR
RESULTS PRESENTATION
      14 August 2018
Lawrence Hutchings
Chief Executive
Highlights
37.9m shopper
Adjusted Profit
visits in H1
+6.9%
+1.7%
Delivering on strategy
Leasing spreads
Strong operational +3.4% to ERV
Occupancy
+3.3% to passing 96.9%
performance
helping drive
LFL NRI +1.3% +1.4%
Resilient property values
Cost efficiency EPRA NAV
on track per share 65p
£1.8m saving -1.8%
Underpinning Interim dividend increase of 5.2%
3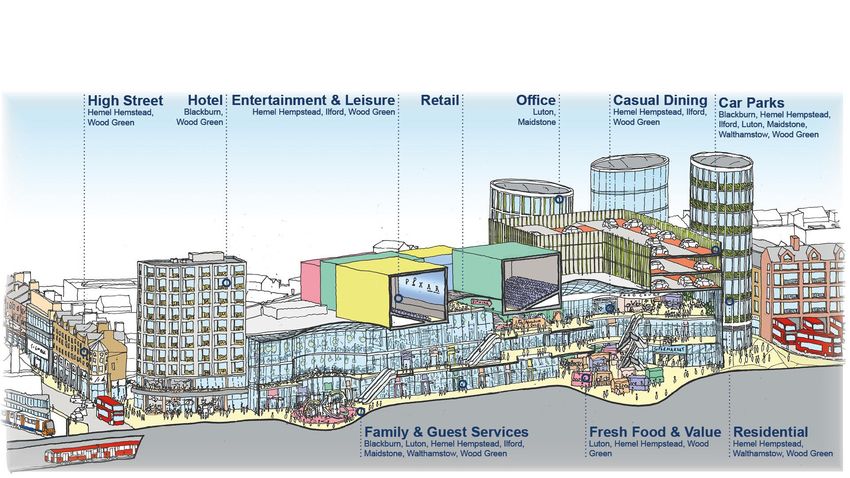
The pillars of our strategy
Redefine – Reposition – Refocus – Enhance –
community shopping assets and retail mix management team shareholder value
centres
Industry body Revo Tailoring to the needs of Senior leadership team Benefits feeding through
finalising new the local community and decentralised to sustainable dividend,
classification of UK structure now fully in up 5.2%
shopping centres Changing use through place delivering on
aligning with global remerchandising and strategy Target dividend growth
practice capex programme, with of 5% to 8% over
over 20 projects Reallocation of medium term
underway and further resources to strengthen
capex opportunities of income generation
over £100m
4
Charles Staveley
Group Finance Director

                         The Marlowes, Hemel Hempstead
Financial Results
                                                        H1 2018         H1 2017        Change
Profitability
Net Rental Income1 like-for-like                        £23.6m          £23.3m          +1.3%
Adjusted Profit                                         £15.5m          £14.5m          +6.9%
Adjusted Earnings per share                              2.15p           2.06p          +4.4%
Dividend
Dividend per share                                       1.82p           1.73p          +5.2%
Dividend payout                                          84.7%           84.0%

                                                   30 June 2018     30 December 2017   Change
Net Asset Value
EPRA NAV                                                £475.0m         £482.6m         -£7.6m
NAV per share                                             66p             67p             -1p
EPRA NAV per share                                        65p             67p             -2p
Group Debt
Net debt to property value                                 46%            46%               -
Average maturity                                        6.8 years       7.3 years      -0.5 years
Cost of debt2                                             3.27%          3.25%          +0.02%

1. Wholly-owned assets   2. Assuming RCF fully drawn.
                                                                                                    6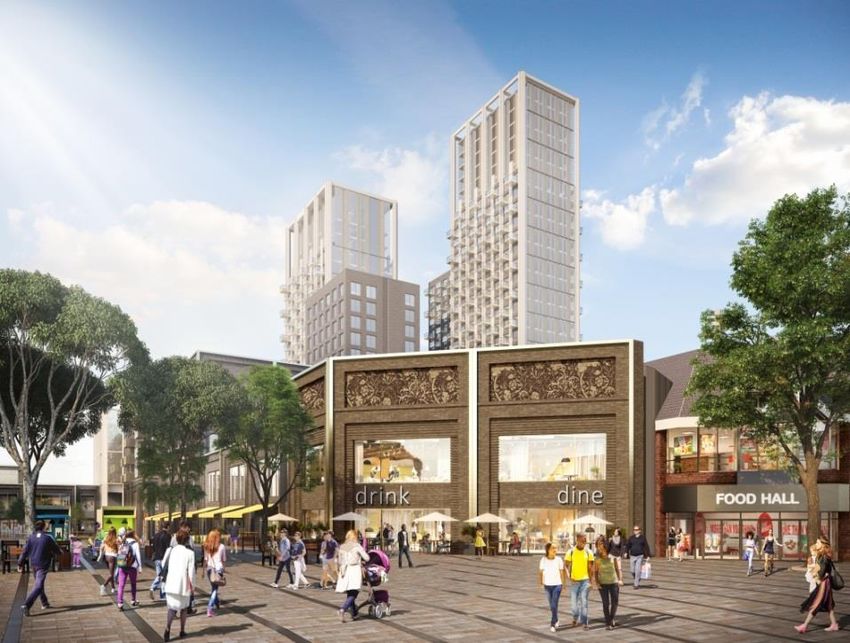
Adjusted Profit
Operational performance driving Adjusted Profit growth – up 6.9%

Amounts in £m                                  H1 2018             H1 2017
Net rental income
 Wholly-owned assets                              26.0                25.0
 Kingfisher, Redditch                              0.7                 0.7
                                                  26.7                25.7
Net interest                                    (10.0)               (9.4)
Snozone profit                                     1.0                 1.0
Central operating costs net of external fees     (2.2)               (2.7)
Tax                                                  -               (0.1)
Adjusted Profit                                   15.5                14.5
                                                +6.9%

Adjusted Earnings per Share                     2.15p                2.06p
                                                +4.4%

                                                                             7
Impact of CVAs and Insolvencies
CVAs
3 of 12 CVAs directly impact our centres
1% of our total units closed or with a change to terms
All UK CVAs nationwide C&R wholly-owned
(year to date) portfolio (year to date)
Total Units Total Units
stores closed stores closed
2,154 480 12 1
CVAs and Insolvencies – financial impact
£0.4m impact on H1 2018 from CVAs (£0.2m) and administrations (£0.2m)
Full year impact on 2018 NRI, assuming no further retailer failures, expected to
be c £1.2m (£0.4m CVAs, £0.8m administrations)
8
H1 2018 EPRA NAV Bridge
        £15.5m          -£11.7m              -           -£12.4m         £1.0m
70p

                                                                                      1p = £7m NAV
         +2.1p            -1.6p            -0.5p          -1.7p          +0.5p
69p

68p

67p

      66.6p opening                                                                      -1.2p / -1.8%
66p
                                                                      65.4p closing

65p

64p
        H1 2018         Dividend       Dilution from    Revaluation      Other
        Adjusted       paid in year    Scrip dividend
         Profit       (net of Scrip)       shares

                                                                                                         9
Valuations
                                                                           Valuation
Property at independent valuation      30 June 2018     30 December 2017
                                                                            change
                                     £m         NIY %    £m        NIY %
London
Ilford                              84.2        6.00%   82.4       6.54%
Walthamstow                         116.0       5.00%   107.7      5.25%     +4.5%

Wood Green                          240.0       5.11%   231.2      5.25%
South East

Hemel Hempstead                     46.8        7.15%   54.0       6.88%

Luton                               209.0       6.50%   214.0      6.35%     -3.7%
Maidstone                           75.5        7.00%   76.0       6.70%
Regional

Blackburn                           111.9       7.04%   121.3      6.65%     -7.7%
Wholly-owned portfolio              883.4       6.04%   886.6      6.06%     -0.4%

                                                                                       10
Group Debt
Efficient long term debt structure
Net debt Average Duration with
Debt Cash Net debt to value interest rate1 Fixed extensions
£m £m £m % % % Years
Four Mall assets 255.0 (9.2) 245.8 45 3.33 100 8.1
Hemel Hempstead 26.9 (2.3) 24.6 53 3.32 100 4.6
Ilford 39.0 (1.2) 37.8 44 2.76 100 5.7
Luton 107.5 (4.7) 102.8 49 3.14 100 5.5
Group RCF - (4.6) (4.6) - 3.80 - 3.6
On balance sheet debt 428.4 (22.0) 406.4 46 3.27 94 6.8
1. Assuming loans fully drawn.
11Dividend
Increase of 5.2% on 2017 interim dividend
0.65p 0.95p 3.12p 3.39p 3.64p
4p
3p
1.91p
1.77p
1.62p Final
2p
Interim
1p 1.82p
1.62p 1.73p
0.60p 1.50p
0.40p
0.25p 0.35p
2013 2014 2015 2016 2017 2018
Average growth in interim dividend of 6.7% pa over the last 3 years
12Market overview
The continuing evolution of retail
Market dynamics support our strategy and offering
Change in store based share of spend (Index vs. 2017): 2017 - 2025
Polarisation to convenience Least exposed
100
and experiential DIY
Health & Convenience
Beauty based
95 Grocery categories
Further growth of online HH Goods
Clothing &
least exposed
to online
and omni-channel retailing 90 Accessories
85
Evolving role of the store Furniture
80
Click and collect drives Leisure
Goods
centre footfall and spend 75 Electrical
Goods
70
Diversification of retail 2017 2018 2019 2020 2021 2022 2023 2024 2025
Most exposed
space Clothing & Accessories Health & Beauty
Leisure Goods Household Goods
Electrical Goods Furniture
Food-to-take-home DIY
Source: Javelin Group X-SPEND
14Occupier restructuring
Changing demands for physical presence
National operator CVAs by number and type of store, Net change in store numbers by retail & leisure business type,
year to date 2017(1)
1,200
1,000
Beauty Café & Ice cream Coffee Book-
800
products Tearoom parlours shops shops
Top ‘fallers’
+30 +30 +27 +25 +20
600
400 -59 -66 -69 -86
Top ‘risers’
200 -314
0
Convenience Pubs & Charity Shoe Fashion &
stores Inns shops shops clothing
1. Excludes service retailers Source: Local Data Company
15Our response
Accelerate remerchandising and repositioning
Rebased affordable rents (£15psf) provide
remerchandising and occupier optionality
Reduce exposure to categories most affected
by online and continued evolution of retailing
Disciplined masterplan execution – flexible
and accretive
Better insight through strong relationships with
retailer customers
Increased resources in leasing and capex
delivery team
16Needs and value based retailers and occupiers
continue to demonstrate robust sales
As shoppers focus on convenience and value, our schemes are well placed
Sales up 9.7% Revenue up 2.9% Sales up 1.5% Sales up 4.5% Sales up 2.3%
(12 weeks to (Quarter to (6 weeks to (12 weeks to (12 weeks to
15 July 2018) 28 March 2018) 30 June 2018) 15 July 2018) 15 July 2018)
Sales up 3% Sales up 6% Sales up 3.7% 8 gym openings &
(18 weeks to (40 weeks to (12 weeks to Revenue up 2%
16 January 2018) 23 June 2018) 15 July 2018) (Six months to revenue up 15.8%
30 June 2018) (3 months to
31 March 2018)
Online shopping presence 17Strategy in action
Delivering for our communities
Increasing relevance to our guests and communities

H1 operational KPIs                                     Footfall to benchmark
                                                                                   Launch of new strategy
Footfall                        38m         +1.7%         +2.0%

                                                          +1.0%
Footfall to benchmark                       +5.1%             -

                                                          -1.0%
Frequency of visits                    1.1 per week
                                                          -2.0%

                                                          -3.0%
Click and collect                            +35%
                                                          -4.0%
                                                                  2015     2016     H1 2017     H2 2017      H1 2018
Occupancy                      96.9%      +1.4   pps1                C&R     National Retail Traffic Index

1. Compared to 30 June 2017.                                                                                           19
Strong footfall drives retailer demand
Remerchandising strategy driving positive leasing spreads
H1 leasing KPIs Change of use over the last 18 months
New lettings 21 £1.4m Department Stores
Fashion
Casual Dining
Renewals settled 23 £1.8m Express Food
Leisure
Total 44 £3.2m Supermarkets
Health & Beauty
Services - Professional
Premium to previous rent 1 +3.4% Services - Personal
Home & Gifts
Variety Stores
Premium to ERV 1 +3.3%
Non Retail
-£1.0m -£0.5m - £0.5m £1.0m
WALE 8.0 years +0.2 Headline rent
1. For lettings and renewals (excluding development deals) with a term of five years or longer which do not include a turnover rent element
20Delivering on the strategy of remerchandising to
diversify uses and tenant mix
21Platform for accretive repositioning
Capital values below replacement cost Secondary rents have rebased and remain
affordable
Value psf (£) Headline Zone A Rent (£/sqft)
800 300
250
600
200
400 150
100
200
50
0 0
C&R valuation Replacement Residential Hotel value 2006 2007 2008 2009 2010 2011 2012 2013 2014 2015 2016
cost value Tier 1 Tier 3 C&R
22Rebased rents, strong trading densities create vibrant places to trade
These venues deliver high proportions of retailer total profits due to dynamic between rental levels & retailer performance
Department Stores
Non-Retail Fashion
Casual Dining
Express
Variety Stores NEEDS: Food
Community
Home & shopping Leisure
Gifts
centres
Fresh Food
Service (Pers.)
Supermarkets
Services (Prof.)
Health & Beauty
Footwear
Source: Javelin group SHOPSCORE & VENUESCORE
Community shopping centres – the “engine room” for UK retailers
23Capital expenditure – delivering our strategy
£6.8m spent in H1 2018, accelerating in H2 for full year £18m to £20m with over 20 live projects
In excess of £100m of opportunities – greater than 50 specific initiatives
Retail
£15m to £25m per year, targeting an average return of 9%+ on new investment extension
Enables flexibility to respond to changes in consumer and retailer occupier demand Cinema /
leisure
Scheme Projects H1 2018 H2 2018 2019
Casual
dining
Blackburn £0.4m £1.0m £0.1m
Residential
Hemel Hempstead £0.5m £2.0m £8.0m
Grab & Go
dining
Ilford £1.0m £2.0m £3.0m
Fresh &
Grocery
Luton £3.6m £3.0m £1.0m
Family area
Maidstone £0.1m £2.0m £3.0m
Guest
amenities
Walthamstow £0.7m £0.2m £4.0m
Ambiance
Wood Green £0.5m £1.0m £4.0m upgrades
24Attributes of successful community shopping centres
Positive footfall from local and convenient assets delivering the non-discretionary and
value-orientated needs of the local community
MTW
TFSS
20%+1 +1.7% 12.6%
220k perOCR
week 1.1 per week 71%
Growing Increasing Affordable High frequency Strong
demographics footfall occupancy of visits Conversion
96.9% 13 minutes 63% non-car 59 min av. stay £43
occupancy Av. drive time Easy Convenient ease Spend per visit
The right size Local catchment accessibility of use
Averages for wholly-owned portfolio 1 Average local authority predicted population growth for towns in which C&R have shopping centres 2014-2039 25Masterplans at work Repositioning community shopping centres
Summary Outlook
Strategy delivering for our Continue to focus on income, objective
communities, retailer customers of dividend growth 5% to 8% over
and shareholders medium term
Resilient demand for high Occupier restructurings present a short
quality, convenient “needs” term challenge, full year 2018 dividend
focussed community shopping growth expected to be at low end of this
centres: range
– Strong letting progress
Our in-house expertise, accretive
– Growth in footfall Capex programme and the strength and
– Improved profitability affordability of our assets enables us to
successfully remerchandise to maintain
Progress across all areas of the positive momentum
businessAppendix
Adjusted Profit to IFRS profit

                                                Six months to   Six months to
Amounts in £m
                                                 30 June 2018   30 June 2017

                                                         £m              £m

Adjusted Profit                                         15.5            14.5

Property revaluation (including Deferred Tax)          (12.4)           (2.8)

Loss on disposals                                       (1.1)               -

Gain on financial instruments                            3.1             0.6

Other items                                              1.6            (0.2)

Profit/(loss) for the period                             6.7            12.1

                                                                                29
Snozone
Four years of profit growth to 31 December 2017
Revenue Profit
£11m £1.75m
£1.50m
£10m
£1.25m
£9m
£1.00m
£8m £0.75m
2013 2014 2015 2016 2017 2013 2014 2015 2016 2017
Average of 11% pa growth in profit
30Reposition – Evolution of the retail mix
Complement super regional malls with substantially differentiated proposition
Health & Beauty Variety Stores
Department Stores
Mobile & Consumer
Non-Retail Fashion Jewellery Electronics
Home & Gifts
Casual Dining
Variety Stores
Express
Services
Variety Stores NEEDS: Food WANTS: (Professional)
Community Super Services
Home & shopping Leisure
regional (Personal)
Gifts
centres malls Leisure
Fresh Food
Casual Dining
Service (Pers.)
Supermarkets
Services (Prof.) Express Food
Health & Beauty Department Stores
Footwear Specialty Fashion
(Fashion &
Footwear)
31Top 10 retailers1
A strong and diversified tenant mix
% of rent Stores
Debenhams 5.81 3
AS Watson 3.20 14
TK Maxx 3.06 4
Primark 3.03 3
H&M 2.65 5
Sports World 2.32 7
Wilko 2.12 5
WH Smith 1.87 6
M&S 1.86 3
JD Sports 1.80 5
TOTAL 29.59 55
1 Wholly-owned portfolio c. 400 different tenants – low concentration risk
32The Mall, Walthamstow
At the heart of the community – with proposed new tube entrance within the scheme
• Extension proposals for c. 80,000 sq ft
retail and leisure extension and c.500
residential units
• Key milestones achieved:
– development agreement signed
– new head lease agreed
– conditional planning consent granted
July 2018
– S106 Agreement signed
– TfL allocated £15m for new tube
entrance unlocks capacity for 2,000
new homes in Walthamstow
• Strong stakeholder relationships with
WFBC, TFL & GLA
33Wholly-owned asset information
As at 30 June 2018
Number of properties 7
Properties at valuation £883.4m
Initial yield 6.0%
Equivalent yield 6.4%
Reversion 15.3%
Weighted average lease length to break 6.6 years
Weighted average lease length to expiry 8.0 years
Contracted rent £62.3m
Passing rent £59.2m
ERV £68.3m
Occupancy 96.9%
34Wholly-owned assets
Number of Annual Car
Size lettable footfall park
Property Description Principal occupiers (sq feet) units (m) spaces
The Mall, Blackburn Leasehold partially covered Primark, Debenhams, H&M, 600,000 122 12.6 1,304
shopping centre on three floors Next, Wilko, Pure Gym
The Marlowes, Hemel Freehold covered scheme on one Wilko, New Look, Sports 350,000 109 6.6 1,200
Hempstead principal trading level Direct, River Island
The Exchange, Ilford Predominantly freehold scheme Debenhams, Next, H&M, TK 300,000 79 10.6 1,060
over three trading levels Maxx, M&S
The Mall, Leasehold covered shopping Debenhams, Primark, H&M, 900,000 170 19.9 1,706
Luton centre on two floors with over M&S, TK Maxx, Wilko, Luton
65,000 sq ft of offices BC (offices)
The Mall, Maidstone Freehold covered shopping centre TJ Hughes, Boots, New Look, 500,000 107 8.8 1,050
on three floors with over 40,000 sq Wilko, Next, Iceland,
ft of offices Maidstone BC (offices)
The Mall, Leasehold covered shopping TK Maxx, Sports Direct, Lidl, 260,000 69 9.0 850
Walthamstow centre on two floors Asda, Boots, The Gym
The Mall, Freehold, partially open shopping Primark, Wilko, H&M, Boots, 540,000 109 10.5 1,500
Wood Green centre, on two floors TK Maxx, Travelodge
35Forward Looking Statement This document contains certain statements that are neither reported financial results nor other historical information. These statements are forward-looking in nature and are subject to risks and uncertainties. Actual future results may differ materially from those expressed in or implied by these statements. Many of these risks and uncertainties relate to factors that are beyond the Group’s ability to control or estimate precisely, such as future market conditions, currency fluctuations, the behaviour of other market participants, the actions of government regulators and other risk factors such as the Group’s ability to continue to obtain financing to meet its liquidity needs, changes in the political, social and regulatory framework in which the Group operates or in economic or technological trends or conditions, including inflation and consumer confidence, on a global, regional or national basis. Readers are cautioned not to place undue reliance on these forward-looking statements, which apply only as of the date of this document. The Group does not undertake any obligation to publicly release any revisions to these forward-looking statements to reflect events or circumstances after the date of this document. Information contained in this document relating to the Group should not be relied upon as a guide to future performance.
You can also read