Renishaw plc - 2020 interim results - 30 January 2020
←
→
Page content transcription
If your browser does not render page correctly, please read the page content below
Renishaw plc – 2020 interim results

           30 January 2020
Summary

• First half revenue of £259.4m (2019: £296.7m); a decrease at constant exchange rates of 14%.

• Reductions in all regions, with APAC seeing a 20% decrease at constant exchange rates.

• Metrology revenue decreased by 13% to £241.5m

    • Subdued market demand for Industrial Metrology products.

    • First half of 2019 benefitted from a number of large orders from end-user manufacturers of
      consumer electronic products in the APAC region which have not been repeated this year.

    • Growth in our optical and laser encoder lines due to a recovery in the semiconductor market.

• Healthcare revenue decreased by 6% to £17.8m

    • Growth in the neurological line due to increased demand for our neurosurgical robot.
Summary (continued)

• Adjusted profit before tax of £14.3m (2019: £59.6m), a decrease of 76%

     • Adjusted operating profit for Metrology of £17.4m (2019: £52.2m); adjusted operating loss of
       £1.5m for Healthcare, compared to break even for the same period last year.

• Statutory profit decreased 84% to £9.9m (2019: £61.6m).

•   Taking a range of actions to improve productivity and reduce the Group’s cost base, including:

     •   Non-replacement of staff who have left the business.
     •   Reductions in direct manufacturing staff in the UK, Ireland and India.

     •   Planned closure of the Staffordshire site in February 2020.
     •   Proposed UK redundancy programme could lead to a headcount reduction of around 200
         people.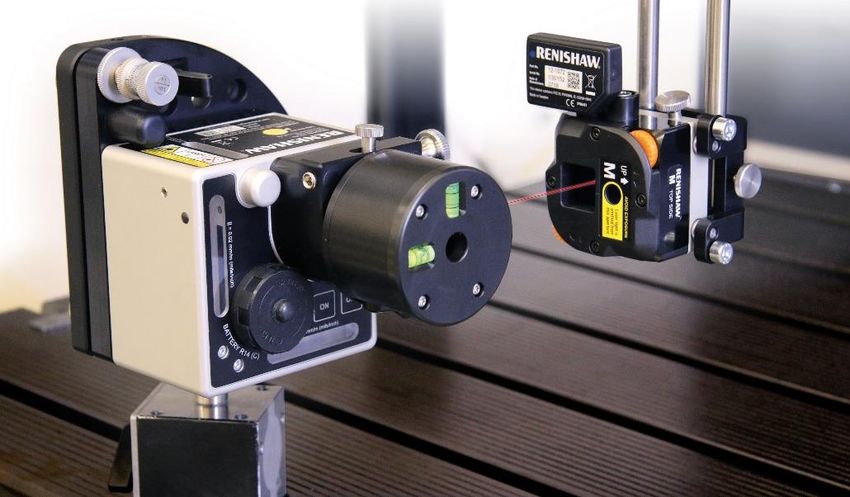
Summary (continued)

•   Capital expenditure of £28.4m, of which property expenditure for future growth totalled £20.8m.

•   Strong balance sheet, with end of period cash of £71.3m.
•   Interim dividend maintained at 14.0p per share.
•   All Board directors have waived their rights to the interim dividend which results in the cost of the
    dividend being £4.8m compared to £10.2m last year.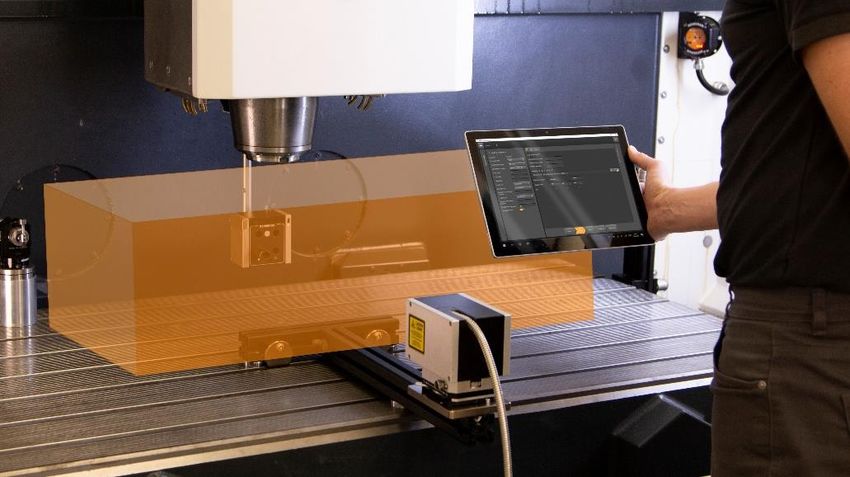
Financial summary
                                   2020    2019    Change   Revenue £m
                                     £m      £m         %   350
                                                                                          296.7
                                                            300                   279.5
Revenue                            259.4   296.7    -13%                  238.1
                                                                                                  259.4
                                                            250
                                                                  198.5
                                                            200

Adjusted profit before tax          14.3    59.6    -76%    150

                                                            100

                                                            50

Statutory profit before tax          9.9    61.6    -84%     0
                                                                  2016    2017    2018    2019    2020
Tax                                (2.5)   (9.6)
Profit after tax                     7.4    52.0    -86%
                                                            Adjusted profit before tax £m
                                                            70                    62.3    59.6
Adjusted earnings per share (p)     15.1    69.3    -78%    60

                                                            50
Statutory earnings per share (p)    10.2    71.5    -86%
                                                            40            36.1
                                                                  28.6
                                                            30

Dividend per share in respect of                            20                                    14.3
                                    14.0    14.0
period (p)                                                  10

                                                            0
Dividend payable in respect of                                    2016    2017    2018    2019    2020
                                     4.8    10.2    -53%
period after Directors’ waiver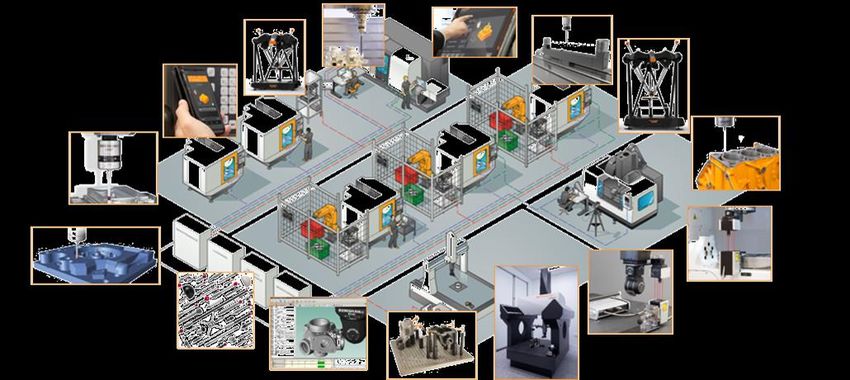
Adjusted profit before tax bridge
Income statement
                                                                       2020              2019
                                                                        £m       %        £m      %     Change   Cost of sales £m
                                                                                                                 120                                                 80
Revenue                                                                259.4    100     296.7    100     13%                                       100.8    98.4
                                                                                                                                          95.4
                                                                                                                 100
                                                                                                                               84.8                                  60
                                                                                                                       71.5

                                                                                                                                                                             % of revenue
Cost of sales                                                          (98.4)   (38)   (100.8)   (34)     2%     80

                                                                                                                 60                                                  40
Engineering (inc. R&D)                                                 (46.1)   (18)    (47.8)   (16)     4%
                                                                                                                 40
                                                                                                                                                                     20
Gross profit                                                           114.9    44      148.1    50      22%     20

                                                                                                                   0                                                 0
Distribution costs                                                     (65.6)   (25)    (63.8)   (22)     -3%          2016    2017       2018     2019     2020

Administrative costs                                                   (31.9)   (12)    (29.0)   (10)    -10%                 Cost of sales £m       % of revenue
Fair value losses on financial instruments - derivatives                (8.6)   (3)      (1.2)   (0)
                                                                                                                 Adjusted operating profit £m
Fair value gains on financial assets                                     2.7     1           -    -
                                                                                                                 70                                                      60
                                                                                                                                          61.4
Financial income/(expense) (net)                                        (2.5)   (1)       5.3     2
                                                                                                                 60                                 52.2                 50
Share of profits of associates and joint ventures                        0.9     0        2.2     1              50

                                                                                                                                                                                     % of revenue
                                                                                                                                                                         40
                                                                                                                 40            36.0
Statutory profit before tax                                              9.9     4       61.6    21      84%           28.5                                              30
                                                                                                                 30
FV gains and losses on instruments not eligible for hedge accounting                                                                                                     20
                                                                                                                 20                                          15.9
-reported in revenue                                                    (3.1)   (2)      (3.2)   (1)             10                                                      10

-reported in fair value gains/(losses) on financial instruments          5.3     2        1.2     0               0                                                      0
                                                                                                                       2016    2017       2018      2019     2020
Restructuring costs                                                      2.2     1           -    -
                                                                                                                                Operating profit      % of revenue
Adjusted profit before tax                                              14.3     5       59.6    20      80%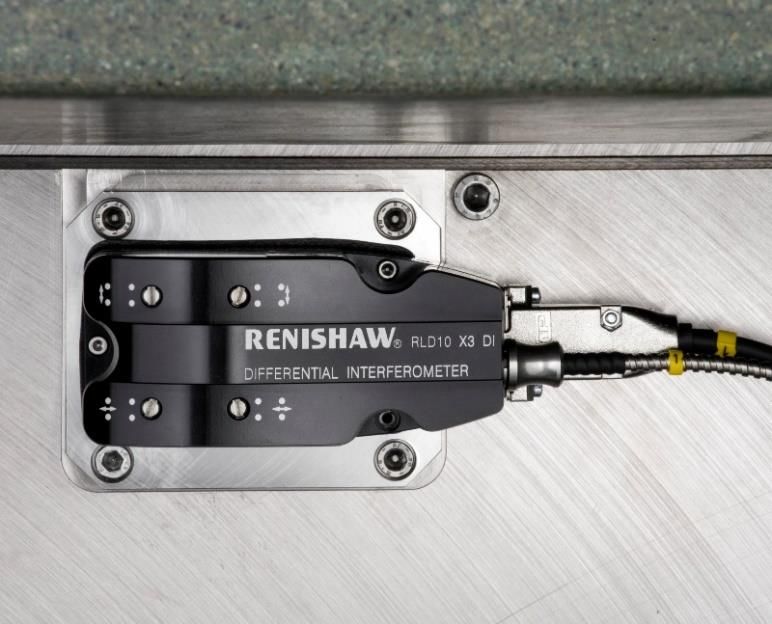
Income statement (continued)
Engineering costs £m                                                               Administrative costs £m
60                                                        50                       35                                                     31.9      30
                                                  46.1                                                                        29.0
50                                  47.8                  40                       30                                                               25
                        39.1                                                                        24.6         24.1
            36.4                                                                   25

                                                               % of revenue

                                                                                                                                                         % of revenue
40                                                                                         20.5                                                     20
     33.3                                                 30
                                                                                   20
30                                                                                                                                                  15
                                                          20                       15
20                                                                                                                                                  10
                                                                                   10
10                                                        10                                                                                        5
                                                                                    5
 0                                                        0                         0                                                               0
     2016   2017        2018        2019          2020                                     2016     2017         2018         2019        2020
                                                                                                    Administrative costs £m          % of revenue
                    R&D £m         % of revenue

Distribution costs £m                                                              Group headcount Dec No.
                                                                                                                              4,941       4,871
70                                  63.8          65.6    50                       5,000                          4,584
                        59.2                                                                4,163     4,358
             54.6                                                                  4,500
60
                                                          40                       4,000
50   44.7
                                                                    % of revenue

                                                                                   3,500
40                                                        30                       3,000
                                                                                   2,500
30                                                        20
                                                                                   2,000
20                                                                                 1,500
                                                          10
10                                                                                 1,000
                                                                                     500
 0                                                        0
     2016    2017       2018        2019          2020                                 0
                                                                                             2015     2016        2017        2018        2019
            Distributon costs £m           % of revenue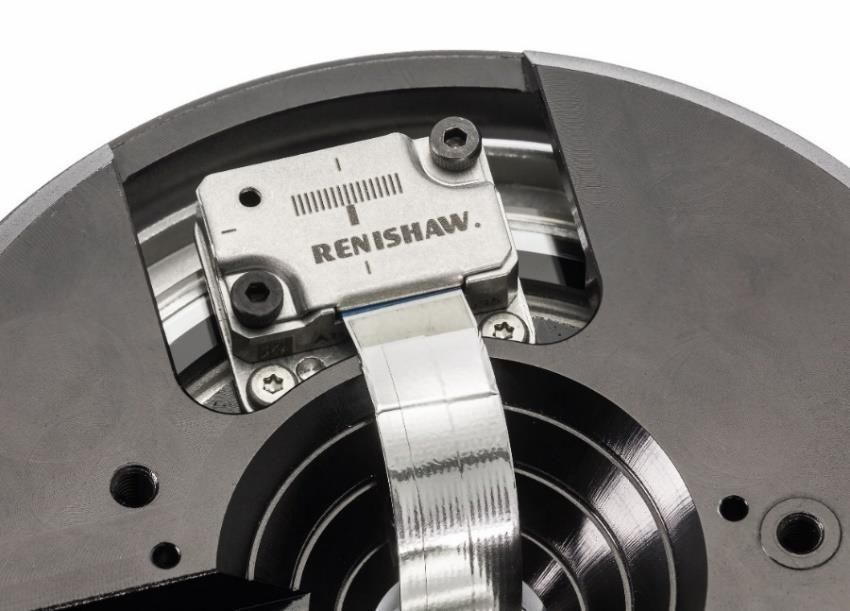
Balance sheet
£m                                  Dec 2019    Dec 2018    June 2019
Property, plant & equipment            272.2       240.0        263.4
                                                                         Total equity Dec, £m
Intangible assets & investments         72.1        71.3         73.0
Right of use assets                     13.0            -            -   700
                                                                                                                589.9
Deferred tax assets                     21.2        29.0         29.8    600                            558.8
                                                                                                490.7
Derivatives                             13.2         2.0          1.3    500
                                                                               403.3
Total non-current assets               391.7       342.3        367.5    400           370.5

                                                                         300
Inventory                              117.8       122.5        129.0
                                                                         200
Debtors                                139.7       155.8        159.2
                                                                         100
Pension fund cash escrow                10.5        10.4         10.5
Cash                                    71.3       100.5        106.8      0
                                                                               2016    2017     2018    2019    2020
Derivatives                             (1.0)      (27.1)       (16.1)
Current borrowings                      (1.0)           -        (1.0)
Current lease liabilities               (4.5)           -            -
Creditors (current)                    (56.7)      (68.0)       (75.7)
Net current assets                     276.1       294.1        312.7

Non-current borrowings                  (9.6)          0         (9.4)
Non-current lease liabilities           (8.5)           -            -
Pension scheme deficit                 (42.8)      (52.7)       (51.9)
Deferred tax liabilities                (0.5)       (0.2)        (0.5)
Derivatives                            (16.5)      (24.7)       (35.1)
Net assets, equal to Total equity      589.9       558.8        583.3
Cash flow

*Including continuing and discontinued operations
Capital expenditure
                                      2020       2019
                                                               Capital expenditure £m
                                       £m         £m
                                                               40

   Capital expenditure                28.4       19.6
                                                               35

Property                                                       30
                                                                                                             17.8
- in the UK, ongoing construction of a 94,000 sq ft
extension to our Renishaw Innovation Centre which is           25                                                       7.6

nearing completion
                                                               20
- in India, acquisition of a property in Pune to provide
capacity for future growth                                     15

- in the USA, construction of a new facility in Michigan for         27.5
                                                                                          11.9
                                                                                                   13.6
                                                                                                                       20.8
use by Renishaw Fixturing Solutions, having outgrown the       10              35.6                          19.8

current leased facility                                         5
                                                                     20.9
Plant & equipment                                                                         24.2
                                                                                                    5.6
                                                                               17.4
- £7.6m expenditure on plant and equipment in 2020              0
                                                                    H2 2017   H1 2018   H2 2018   H1 2019   H2 2019   H1 2020
(2019: £13.6m)
Capital expenditure in second half expected to reduce                          Property     Plant & equipment

significantly
Industrial metrology - market drivers
Weaker current investment levels,
including machine tool sector
Same market drivers exist
Increasing component complexity and
closer tolerances – new performance
monitoring equipment
Measurement at point of manufacture –
shop floor measurement
Increased need for automation
Renishaw’s strength is breadth of products and applications knowledgeIndustrial metrology
Performance monitoring
To produce complex parts with tight tolerances requires
consistently capable machines.
The new XK10 alignment laser system is used during the
build and alignment of machine tools, replacing the need for
expensive artefacts. It can also be used to diagnose the source XK10
of errors following a collision or as part of regular maintenance.
Machine tools have positioning errors in multiple degrees of
freedom that vary throughout the working volume which will
also change over time. Using the XM-60 multi-axis calibrator
and new Compensate software, volumetric compensation can
be applied so that the machine tool controller automatically
applies a correction to reduce these errors.
CompensateIndustrial metrology
Shopfloor measurement
Cutting tools and components remain in situ on the machine
tool and automatically checked using an inspection probe (e.g.
RMP400
RMP400) or contact/laser-based tool setting probe (e.g. new
APCS-45 or new NC4+ Blue).
Featuring industry-first, blue laser technology, NC4+ Blue
systems deliver significant improvements in tool measurement
accuracy. Blue laser technology enables the measurement of NC4+ Blue
very small tools, whilst minimising tool-to-tool measurement
errors.
Measurement data used to automatically update the
manufacturing process and for trend reporting, using tools
such as the new enhanced Reporter real-time process
monitoring app.
ReporterIndustrial metrology
RFP1 fringe probe
Automation
There is increasing use of automated changing between
different sensor types for the REVO® measuring head for co-
ordinate measuring machines (contact, optical, surface finish
and new RFP1 fringe probe).
The new probe is suited to the measurement of freeform
surfaces and complex geometry, such as additively
manufactured parts, aerospace blades and blisks,
automotive cylinder head combustion chambers, and
delicate surfaces not suited to tactile measurement.
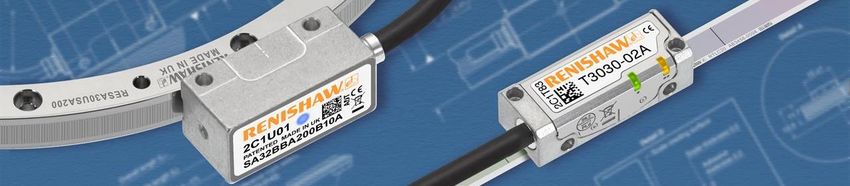
RFP1 measuring an aerospace bladePosition measurement – market drivers Some positive indications of recovery in the semiconductor market. Market drivers are size, accuracy, speed, ease of use. Opportunities due to increased utilisation of our encoders and new application areas. Positive trends include new flat panel display technology, the demand for 5G mobile products, more automation/robotics and increasing requirement for more real-time data on machine performance.
Position measurement

ATOM DX™ encoder series
• Our smallest incremental encoder, with digital output direct from
  the readhead, eliminating the need for bulky interfaces.
• A high-performance encoder that features resolutions down to
  2.5 nm, low Sub-Divisional Error (SDE) and low jitter.
• Can be used with a wide range of linear and rotary scales to
  meet most application requirements.
• Launched in July 2019.
Position measurement

Functional safety
Certain machinery safety functions that ensure that operators are protected in the event of hardware failure or
human error, require the encoder feedback to be functionally safe (FS).
For safety critical applications, including medical robots and collaborative robots (Cobots), Renishaw offers a
range of functionally safe position encoder solutions certified to international safety standards, including new
RESOLUTE™ FS with BiSS® Safety absolute open optical encoder system, and TONiC™ FS incremental
open optical encoder system.
Additive manufacturing – market drivers

Our systems are based on laser powder bed fusion technology for high-value metal part production.

Market drivers include machine productivity, lower cost-per-part, process stability and part quality.

Opportunities in multiple markets, with greater maturity in aerospace, healthcare and tooling.

                                                                       The new RenAM 500E is designed to
                                                                       offer value to new users, who want to
                                                                       develop their AM skills and
                                                                       understanding.
                                                                       Designed to offer users the ability to
                                                                       change between different materials for
                                                                       the purposes of experimentation and
                                                                       process flexibility.
Additive manufacturing
Recent collaboration
• In December we signed a Memorandum of Understanding with
BAE Systems (UK) to work together on the development of
additive manufacturing capability for the aerospace and defence
sector, designed to help improve performance, reduce costs and
speed up manufacturing processes on combat aircraft of the
future. BAE Systems use Renishaw AM systems
• BAE Systems is currently using AM technology to make
production standard components for the Typhoon fighter aircraft.
It is also applied in the rapid prototyping of new technology
concepts as part of a drive to deliver Tempest - a capable,
affordable and exportable next generation future combat air
system.
Senior directors from Renishaw and BAE SystemsHealthcare - Raman spectroscopy Market applications We are focussing on new application areas to address existing and new markets for our Raman systems. Our current areas of interest include healthcare (cancer and infectious disease diagnosis) and environmental (microplastics and green energy). The new Virsa™ Raman Analyser is a versatile, fibre-optic-coupled Raman spectroscopy system designed for reliable, detailed remote analysis. It enables the expansion into new markets and environments beyond the confines of a laboratory. Applications range from art and heritage, manufacturing, forensics, pharmaceutical and medical. Virsa can be integrated with third-party systems, enabling users to analyse samples using two or more techniques. We are in the process of setting up OEM agreements with instrument vendors in a variety of fields.
Brexit
• The Board continues to oversee the
work of the Brexit steering group in
identifying the key risks arising from a
no-deal Brexit and implementing
mitigation plans.
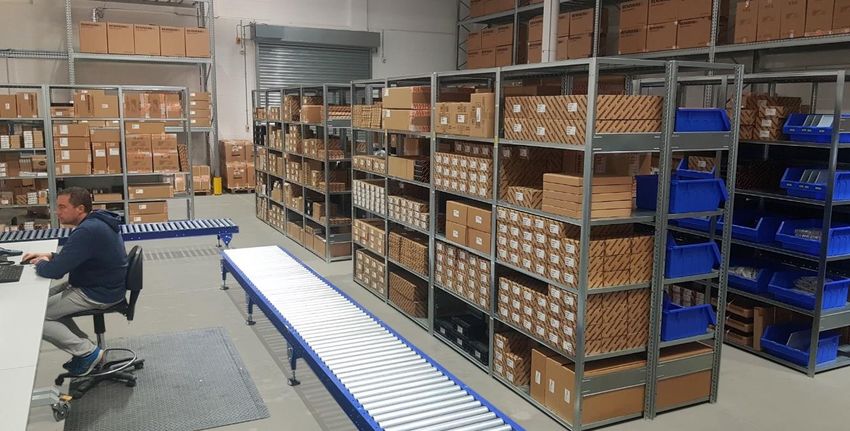
New warehouse in Ireland
Mitigation plan
• New warehouse established in Ireland to direct ship to 3rd parties within the EU.
• General increase in inventory adding an additional 4 weeks in both finished goods
and components in our UK and Ireland manufacturing sites, as well as within
Renishaw GmbH.
• Ongoing assessment of other risks and possible negative impacts.
29/01/2020
22Outlook - summary • Trading conditions expected to remain challenging through the remainder of this financial year. • We remain confident in the long-term prospects for the Group due to the high quality of our people, our innovative product pipeline, extensive global sales and marketing presence and relevance to high-value manufacturing. • Expect full-year revenue to be in the range of £530m to £560m and adjusted profit before tax to be in the range of £50m to £70m. • Profits in the second half of the year expected to benefit from an increase in revenue, reduced operating costs and a favourable currency impact from forward contracts compared to the first half year.
Disclaimer
This document contains statements about Renishaw plc that are or may be forward-looking statements.

These forward-looking statements are not guarantees of future performance. They have not been reviewed by the auditors of Renishaw
plc. They involve known and unknown risks, uncertainties and other factors which may cause the actual results, performance or
achievements of any such person to be materially different from any results, performance or achievements expressed or implied by
such statements. They are based on numerous assumptions regarding the present and future business strategies of such persons and
the environment in which each will operate in the future. All subsequent oral or written forward-looking statements attributable to
Renishaw plc or any of its shareholders or any persons acting on its behalf are expressly qualified in their entirety by the cautionary
statement above. All forward-looking statements included in this document speak only as of the date they were made and are based on
information then available to Renishaw plc. Investors should not place undue reliance on such forward-looking statements, and
Renishaw plc does not undertake any obligation to update publicly or revise any forward-looking statements.

No representation or warranty, express or implied, is given regarding the accuracy of the information or opinions contained in this
document and no liability is accepted by Renishaw plc or any of its directors, members, officers, employees, agents or advisers for any
such information or opinions.

This information is being supplied to you for information purposes only and not for any other purpose. This document and the
information contained in it does not constitute or form any part of an offer of, or invitation or inducement to apply for, securities.

The distribution of this document in jurisdictions other than the United Kingdom may be restricted by law and persons into whose
possession this document comes should inform themselves about, and observe any such restrictions. Any failure to comply with these
restrictions may constitute a violation of laws of any such other jurisdiction.
You can also read